The State of the Region report is the result of a task force created by PECC's governing body. Progress towards the Bogor Goals and the Asia-Pacific Free Trade Area (FTAAP).
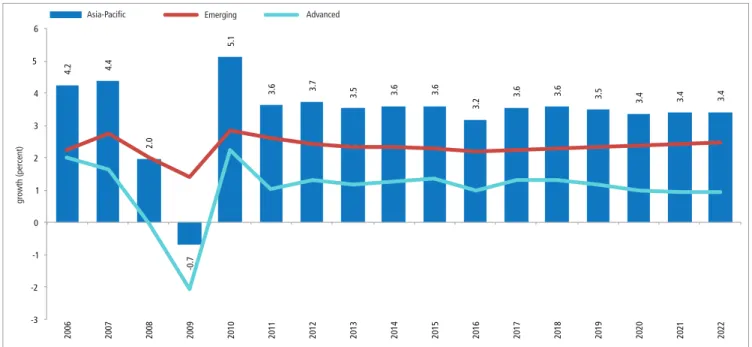
CHAPTER ASIA-PACIFIC ECONOMIC OUTLOOK
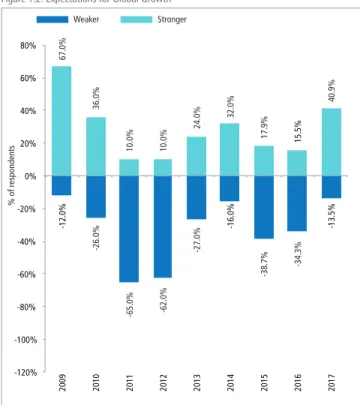
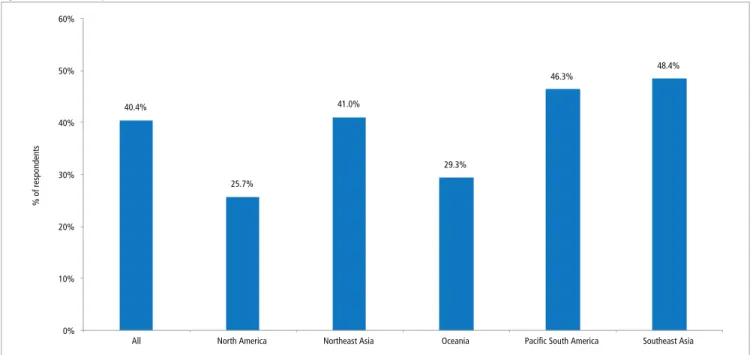
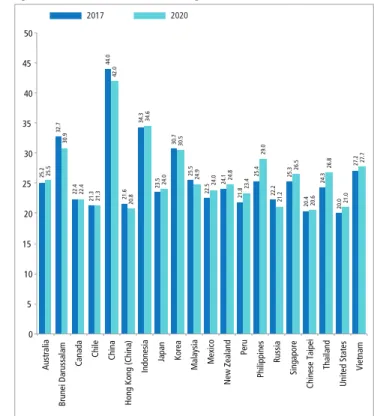
As shown in Figure 1.2, our respondents' expectations for global growth over the next 12 months are significantly higher than they were at this time last year.
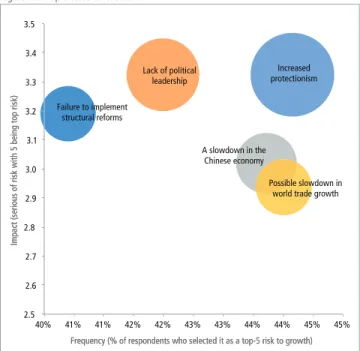
RISKS TO GROWTH
FEARS OF INCREASED PROTECTIONISM
LACK OF POLITICAL LEADERSHIP
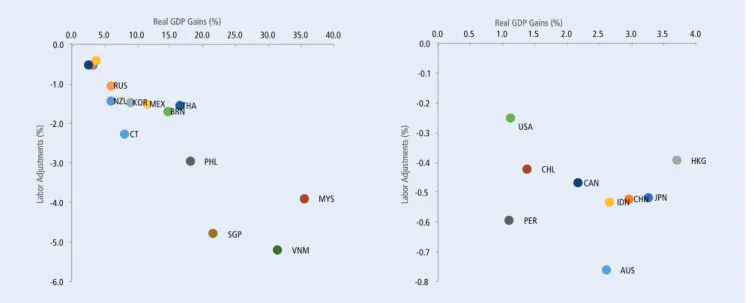
Macroeconomic effects of the TPP would be less affected by the absence of the United States due to the possible effects of NTM reductions. This applies especially to the smaller economies in ASEAN and the Asia-Pacific region.
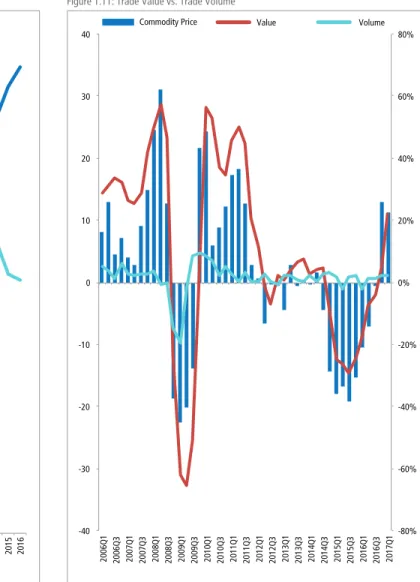
POSSIBLE SLOWDOWN IN WORLD TRADE GROWTH
However, analysis of the numbers suggests that variations in volume explain about 61 percent of the variation in variations in value. There is also a relationship, but not as strong, between changes in the commodity price index and the trade value index.
A SLOWDOWN IN THE CHINESE ECONOMY
FAILURE TO IMPLEMENT STRUCTURAL REFORMS
However, as discussed above, the US savings-investment balance is still in deficit, with investment outpacing savings by about $500 billion. Similarly, in the Philippines, investment as a percentage of GDP is expected to grow to around 29 percent.
A NEW FRONTIER FOR WIN-WIN COOPERATION
The BRI matches the development demands of China with those of the economies along the Belt and Road. Under such a historical context, China seized the opportunity to introduce the idea of building a community of shared future by proposing the BRI, which forms a new kind of international relations and improves global governance. The underlying concept of the BRI is not a collection of short-term projects, but to strive to build a great future of common destiny.
Although a zero-sum mentality still manifests in current international relations, the BRI concept of broad consultation, joint contribution and shared benefits aims to build a global network of partnerships rather than alliances. In November 2016, the BRI's core concept of broad consultation, joint contributions and joint benefits was written into the Leaders. On 17 November 2016, the BRI was written into the resolution of the 71st session of the UN General Assembly for the first time.
PROSPECTS FOR FREER TRADE
Twenty years after the end of the Cold War, the global trend towards multipolarization is increasingly unstoppable, and human society will become more pluralistic, inclusive and balanced. However, peace and human development still face many obstacles: the international situation is complicated and complex, and global challenges are constantly emerging, increasing the uncertainty of the future. Over the years, the BRI has evolved from a Chinese proposition to a program for the world, while its concept of win-win cooperation has been welcomed and supported by a growing number of economies and international organizations.
New Zealand is the first Western developed economy to sign a BRI cooperation document with China. On April 11, 2017, a Memorandum of Understanding on Promoting Regional Connectivity and the Belt and Road Initiative between China's Ministry of Foreign Affairs and the United Nations Economic and Social Commission for Asia and the Pacific (UN ESCAP) was signed in Beijing. In summary, the BRI embodies the joint will of China and the international community to further promote economic globalization, support open and free trade, and build a community with a shared future, which is of particular importance given the current challenging international context.
WHAT PROSPECTS FOR THE FTAAP?
PRIORITIES FOR THE APEC LEADERS’ MEETING
Inclusive growth was stated as a core principle of APEC's growth strategy in the 2011 Leaders' Statement. The digital economy will certainly require optimal budget allocation, but will be a central factor in promoting inclusive growth over the next decade. This will be a decisive factor for economic prosperity and growth in the Asia-Pacific region.
Women make up half of the world's population, but their participation in the global labor market is not proportional. Meanwhile, fewer and fewer stakeholders have seen it as a priority for the region. Today, about 45 percent of the population in the Asia-Pacific region has access to the Internet, compared to 25 percent 5 years ago.
CHAPTER AN ASIA-PACIFIC AGENDA FOR THE DIGITAL ECONOMY
INTRODUCTION
4 For more details, see Mari Pangestu and Grace Dewi, “Indonesia and the Digital Economy: Creative Destruction, Opportunities and Challenges” in Edwin Jurriens and Ross Tapsell (eds), Digital Indonesia: Connectivity and Convergence, ISEAS, Singapore 2017.
DIGITIZATION: REDUCING FRICTIONS, INCREASING TENSIONS?
CHANGING BUSINESS MODELS?
INCLUSION
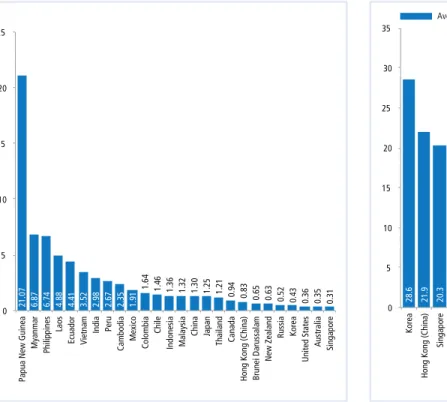
Given the opportunities from the digital economy, Internet access must be improved, especially for developing economies and remote areas. As shown in Figure 2.1, the cost of Internet access varies considerably across regions, but costs as a percentage of GNI per capita are significantly higher in developing economies, which also tend to have faster average speeds. low internet. Source: Akamai State of the Internet Report 2017 and http://www.dospeedtest.com/speedtest- result /country-statistics/Papua-New-Guinea/ average speed of Papua New Guinea Mbps.
Korea Hong Kong (China) Singapore Japan United States Canada Thailand New Zealand Australia Vietnam Chile Malaysia China Mexico Indonesia India Ecuador Peru Colombia Philippines Papua New Guinea Figure 2.1: Asia-Pacific cost of internet access (price of mobile broadband, % GNI per capita 1 GB). Papua New Guinea Myanmar Philippines Laos Ecuador Vietnam India Peru Cambodia Mexico Colombia Chile Indonesia Malaysia China Japan Thailand Canada Hong Kong (China) Brunei Darussalam New Zealand Russia Korea United States Australia Singapore. World Cambodia China Colombia Indonesia Laos Malaysia Mexico Myanmar Papua New Guinea Peru Philippines Thailand Vietnam.
DIGITAL ECONOMY AND JOBS
EDUCATION
THE POLICY AGENDA
AN ASIA-PACIFIC AGENDA
If governments formulate policies based on the interests of one sector of the economy, the risk is missing the development of new growth sectors. The purpose of the sandbox is to minimize legal uncertainty; improving access to investment; adapt to testing and learning methods; and create rules for new products and services. Another critical ingredient is 'trust': how governments build trust in adopting new systems.
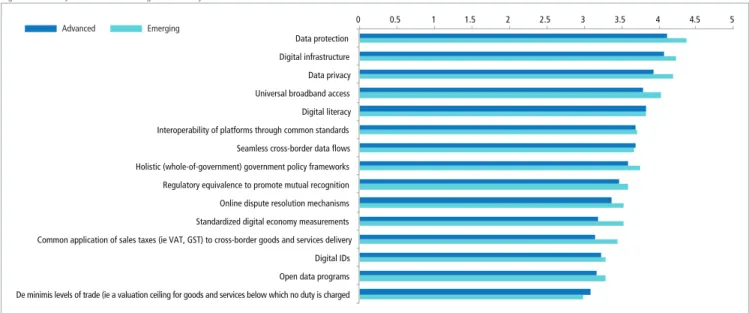
In this regard, another area for international cooperation in the digital economy is in cross-border payment systems. This again depends on sharing data across platforms and across jurisdictions, so a logical starting point might be trade finance – where most data is already shared. Data protection Digital infrastructure Data privacy Universal broadband access Digital literacy Interoperability of platforms through common standards Seamless cross-border data flows Holistic government policy frameworks (whole of government) Regulatory equivalence to promote mutual recognition Online dispute resolution mechanisms Standardized measurements of the digital economy Common application of sales taxes (ie VAT, GST) on cross-border supply of goods and services.
INTERNATIONAL COOPERATION
CONCLUSION
CHAPTER INDEX OF ECONOMIC INTEGRATION IN THE ASIA-PACIFIC *
1 See Bo Chen and Yuen Pau Woo (2010), “Measuring Economic Integration in the Asia-Pacific Region: A Principal Components Approach”, Asian Economic Papers, Vol.9 (2), p. This is to control for the effect that sub-regional flows can have on the index, where a very high level of integration between, for example, NAFTA economies could result in a falsely high level of integration with the Asia-Pacific region as a whole. The value of the index for the region as a whole can also be seen as a measure of closer economic ties between Asia-Pacific economies and as one of the indicators of APEC's success.
As a result, 8 out of the 17 Asia-Pacific economies included in this study converged more towards the Asia-Pacific average level in 2014. Given the fact that most of the economies were recovering in 2014, the in the convergence indices of some economies indicate that these economies interact more with. As a result, the overall convergence index in 2014 improved only slightly compared to the 2013 level, but the negative sign means that the overall level of convergence in the Asia-Pacific region is still below its original level in 1990.
ASIA-PACIFIC TRADE FLOWS
TOURISM FLOWS
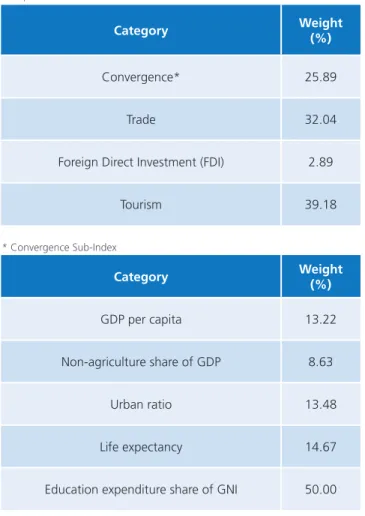
CONVERGENCE INDEX
Throughout the index period, income divergence has been driven by differences in growth rates. However, income levels in some economies have grown at a much higher rate than the regional average, while others have grown below the average. For incomes to converge, those economies at the bottom left must move up to where China and Vietnam are positioned to move right at a faster pace.
LESS DIVERGING INCOMES
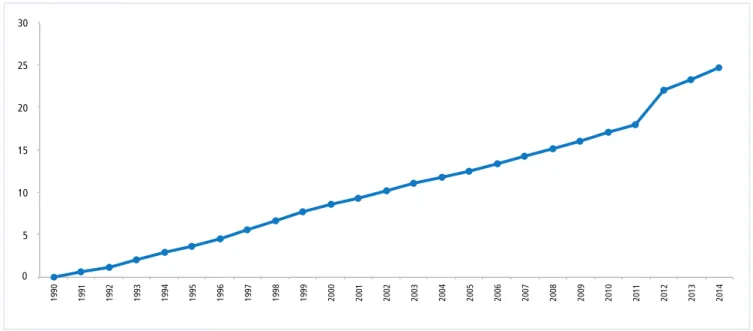
The pace of urbanization in the region has been stable throughout the period as represented by the percentage of the population living in urban areas presented in Figure 3.8. As seen in Figure 3.8, this has been a very linear and stable trend in the region. In contrast to the convergence shown in the pace of urbanization, the non-agricultural share of GDP has been much more volatile, with some significant declines occurring in 2007 and again in 2010.
The level of convergence in life expectancy in the region has been consistently below that of 1990 since 2006. When APEC leaders set the Bogor Goals in 1994, they set out a vision through which the region would not only maintain high growth rates, but even narrow gap development. While the region has fared well in integration and overall incomes have grown at a dramatic pace, the index shows that it has a long way to go in terms of closing development gaps.
ANNEX
B RESULTS OF ASIA-PACIFIC POLICY COMMUNITY SURVEY
GOVERNMENT
BUSINESS
NON-GOVERNMENT: RESEARCH COMMUNITY/CIVIL SOCIETY/MEDIA
RESPONDENT BREAKDOWN
BREAKDOWN OF RESPONDENTS BY SECTOR
BREAKDOWN OF RESPONDENTS BY SUB-REGION
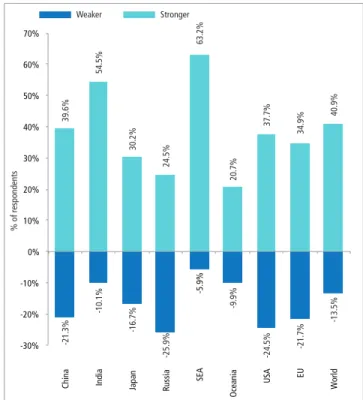
- What are your expectations for economic growth over the next 12 months compared to the last year for the following economies/
- What level of impact do you think each of the following technologies will bring to your economy in the upcoming 5 years?
- How important do you think the following areas are as concerns about the growth of the digital economy?
- How important do you think the following areas are as benefits of the digital economy?
- How important do you think the following areas are for the growth of the digital economy?
- How do you think the digital economy is likely to impact the number of the following types of jobs in your economy?
- How do you assess the political environment for freer trade and investment today? Please tick the box that best fits your assessment
- 5-Very
- Please indicate your agreement or disagreement with the following statements
- Please state your view on the following statements by ticking the appropriate box
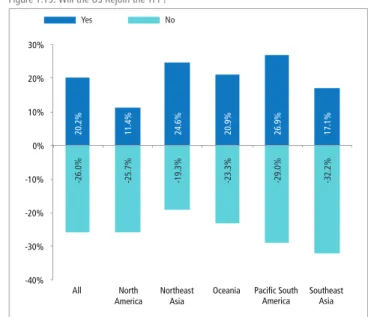
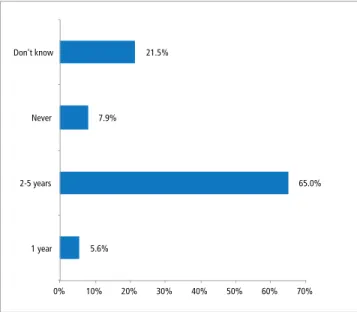
- Do you think the US will rejoin the Trans-Pacific Partnership?
- What do you think should be the top 5 priorities for APEC Leaders to address at their upcoming meeting in Danang? Please select ONLY five (5) issues, using a scale of 1-5, please write 1 for the issue you think is most important, 2 for the next most
What are your expectations for economic growth over the next 12 months compared to the previous year for the following economies/. Please write 5 for the most serious risk, 4 for the next most serious risk, 3 for the next third highest risk, 2 for the fourth from 1-5. Please write 5 for the most serious risk, 4 for the next most serious risk, 3 for the next third highest risk, 2 for the fourth highest risk and 1 for the least serious risk.
How important do you think the following areas are as benefits of the digital economy. How important do you think the following areas are for the growth of the digital economy. Please select five (5) issues ONLY, using a scale of 1-5, please write 1 for the issue you think is most important, 2 for the next most selected issue ONLY five (5) issues, use a scale of 1 -5, please write 1 for the issue you think is the most important, 2 for the next most important issue, 3 for the third most important, 4 for the fourth most important and 5 for the fifth most important.
MEMBER COMMITTEES
PECC CO-CHAIRS
BRUNEI DARUSSALAM
CANADA
CHILE
CHINA
AUSTRALIA
62 62COLOMBIA
HONG KONG, CHINA
JAPAN
INDONESIA
ECUADOR
KOREA
MEXICO
NEW ZEALAND
MONGOLIA
MALAYSIA
PHILIPPINES
CHINESE TAIPEI
UNITED STATES
THAILAND
VIETNAM
PACIFIC ISLANDS FORUM (PIF)
SINGAPORE
ASSOCIATE
MEMBERS INSTITUTIONAL MEMBERS
FRANCE (PACIFIC TERRITORIES)
PACIFIC TRADE AND
DEVELOPMENT CONFERENCE (PAFTAD)
PACIFIC BASIN ECONOMIC COUNCIL (PBEC)