The detection efficiency for the 252Cf ring source is derived from the ratio (total counts)/(total number of emitted neutrons) in continuous rotation of the neutron source. The NAS plays a cross-calibration tool role for the NFM in the LHD deuterium campaign.
Introduction
- Energy crisis
- Nuclear fusion
- Neutron
- Fusion device
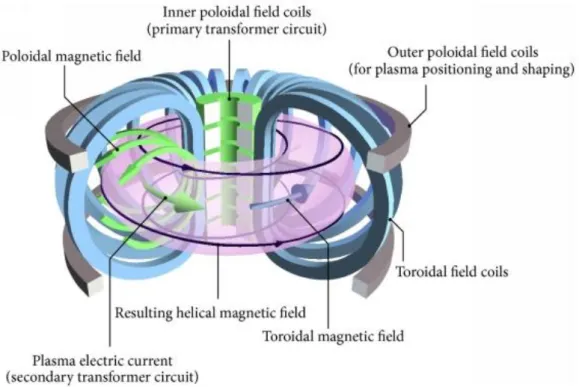
- Tokamak
- Stellarator
- Triton burnup study in tokamaks
It should be noted that in the D-T fusion plasma, the D-T born - particles can also be confined by a magnetic field. The D-T born α-particle may play an important role in self-heating. The heating power of this α-particle can be written as 𝑃𝛼 =14𝑛2〈𝜎𝑣〉𝐸𝛼𝑉, where 𝐸𝛼 represents the energy of α-particles. When the total power is balanced using auxiliary heating with power 𝑃ℎ, the power loss can be described as 𝑃𝑙= 𝑃ℎ+ 𝑃𝛼.
![Fig. 1.2 D-T reaction [2]](https://thumb-ap.123doks.com/thumbv2/123deta/10561931.0/12.892.176.705.628.1008/fig-1-2-d-t-reaction-2.webp)
Theories
Fusion neutron emission
- Fusion cross section
- Fusion reactivity
- Neutron energy spectra
- Neutron transport theory
In addition, analytical values of the fusion cross sections are required for calculations of fusion reaction rates. The factor 1/E results from the quantum mechanical description of the merger probability, and S is the astrophysical S-function [26].

Simulations for fusion neutron emission
- Calculation for neutron emission
- Code of triton burnup calculation
For the simulation of the neutron emission, accurately measured basic plasma data and neutron signals are used as input data. This leads to the decomposition of the neutron rate 𝑆𝑛 into three different neutron rates, 𝑆𝑛−𝑡𝑡 (thermal-thermal), 𝑆𝑛−𝑏𝑡 (beam-thermal) and 𝑆𝑛−𝑏𝑏 (beam-beam).

Classical slowing-down theory
Single-particle orbit motions
- 𝐄 × 𝑩 drift
- Motion in a magnetic mirror
- Motion in a toroidal magnetic field
Therefore, (𝑥 − 𝑎0𝑟0)2+ 𝑦2 ≈ 𝑟02, which means that the entire drift surface of the accompanying (clockwise) particle orbit moves a distance ∆𝑟 to the right relative to the magnetic field. The critical angle 𝜃𝑐 of the toroidal magnetic field can be obtained by the loss cone similar to the magnetic mirror.
![Fig. 2.3 Drifts of charged particles in crossed electric and magnetic fields. [47]](https://thumb-ap.123doks.com/thumbv2/123deta/10561931.0/36.892.285.632.718.973/fig-drifts-charged-particles-crossed-electric-magnetic-fields.webp)
Neutron diagnostics for triton burnup study on LHD
- Large Helical Device
- Neutron flux monitor
- Neutron activation system
- Principle of activation measurement
- Activation foils
- High-purity germanium detector
- Pneumatic system
- Scintillating-fiber detector
The system design of the NAS is based on that used in the JT-60U.[15] The activation foil is mounted on a capsule made of polyethylene. 3.11 (a) Overview of the NIFS Sci-Fi detector and (b) Principle of the NIFS Sci-Fi detector. The LANL Sci-Fi detector is located on the outside of the 8-O port, and the NIFS Sci-Fi detector is located on the outside of the 2.5-L port.
Here, the pulse width of the anode signal from the Sci-Fi detectors is 10-20 ns.
![Fig. 3.1 (a) The Large Helical Device, and (b) the shape of LHD plasma and helical coils.[50]](https://thumb-ap.123doks.com/thumbv2/123deta/10561931.0/48.892.238.659.200.1000/fig-large-helical-device-shape-plasma-helical-coils.webp)
Calibration for neutron diagnostics on LHD
Calibration tools
The train is loaded with a neutron source that rotates at the position of the magnetic axis with a larger radius of 3.744 m inside the LHD vacuum chamber to generate a ring-shaped neutron source. An approximately 800 MBq 252Cf fission neutron source was chosen for in situ calibration because the average neutron energy of neutrons emitted from 252Cf is approximately 2.1 MeV, which is close to neutrons produced by the D–D reaction. The 252Cf neutron source releases an average of 3.7 neutrons per spontaneous fission event, which is almost 3.1% decay.
Therefore, the birth neutron emission rate was calculated as n/s day by day during the in situ calibration period.
In situ calibration of neutron flux monitor on LHD
- Experimental results
- Neutron transport analyses
4.5(a) and (b) show the poloidal diameter of the LHD in the MCNP model for the in situ calibration case and the real plasma case, respectively. The statistical error of the MCNP calculation is ±3% or less, which is smaller than the symbol size in Fig. The error of 𝜀𝑝𝑙𝑎𝑠𝑚𝑎 in Table 4.1 is evaluated from the statistical error of the in situ calibration and the MCNP calculations.
Taking these factors into account, the overall uncertainty of the neutron emission rate measurement with the Campbell mode fission chambers is estimated at ±9%.

In situ calibration of neutron activation system on LHD
- Efficiencies of the HPGe detector
- Experimental results
- Discussion based on MCNP simulation
- Correction for the LHD experiment
In the other measurements, gamma ray measurements were performed for the thirty pieces of indium foils without the capsule. Here thirty pieces of the indium foil inside the capsule are modeled in the MCNP calculation for 252Cf annular source in the case of capsule with foil. Thus, the self-shielding effect of the foil for neutron was calculated by MCNP in the case of capsule with foil.
These reasons would lead to the differences in the activation response coefficients for each reaction in the annular source case of 252Cf and the plasma case.

Neutron measurement on LHD
Shot-integrated neutron yield on LHD
- NAS measurement on 8-O port
- Comparison of NFM and NAS on 8-O port
- Cross-calibration of NAS on 2.5-L port with NFM
The shot-integrated neutron yield in the LHD experiment was evaluated by the gamma-ray intensity emitted from the activated foil after irradiation. 5.5 (a) y0 in the exponential decay equation as a constant for shot-integrated neutron yield, and (b) A0 evaluated from the exponential decay equation as a function of shot-integrated neutron yield. At the same time, shot-integrated 14 MeV neutron yield is measured by 28Si(n, p)28Al reaction.
Therefore, changes in the neutron yield measured by NAS from the shift of the neutron profile with Rax are negligible.

Time evolution of neutron emission rate on LHD
5.14 (a) Comparison of the neutron emission rate of 14 MeV measured using the LANL Sci-Fi detector with different thresholds at PMT HV of -17.00 V and the total neutron emission rate measured using NFM, and (b) comparison of the neutron emission rate of 14 MeV measured using the NIFS Sci-Fi detector with different thresholds at PMT HV of 2000 V and the total neutron emission rate measured using. The time evolution of the total neutron emission rate was measured by NFM and the Sci-Fi detector as shown in figure. The two Sci-Fi detectors have shown the same time evolution of 14 MeV neutrons, with in the case of high threshold levels and the same influence by 2.45 MeV neutrons and gamma rays in the case of the low threshold levels in this image.
The pulse height spectra (PHS) of the two Sci-Fi detectors were obtained to select the appropriate threshold for discrimination in order to reject lower energy neutrons and gamma rays.

Evaluation of response for Sci-Fi detector
Objective
Principle of Sci-Fi detector
- Edge effect
- Gamma-ray rejection and neutron discrimination
Therefore, Sci-Fi has almost the same optical and scintillation properties as a plastic scintillator. Therefore, the Al matrix Sci-Fi detector is expected to have a lower gamma-ray detection efficiency than the bulk scintillator detector. On the one hand, gamma-ray rejection capabilities are defined as the different gamma-ray detection efficiency of scintillation detectors for the same (or normalized) neutron detection efficiency.
When 𝜀𝑛𝑟𝑒𝑓= 𝜀𝑛𝑠𝑎𝑚𝑙𝑙 ≤ C𝑟𝑒𝑓 =C𝑠𝑚𝑎𝑙𝑙 ≅ still the gamma ray shows a small diameter scintillator compared to a plastic scintillator with a fix coefficient of C𝑟𝑒𝑓.

Accelerator experiment
- Experimental setup
- Experimental results
Gamma ray rejection and neutron discrimination of 0.5 mm Sci-Fi is the best. The gamma ray rejection and neutron discrimination capability of the 1mm Sci-Fi is the second best. 6.4 (a) The 14 MeV neutron response of 1 mm Sci-Fi measured using the FNS DT neutron generator with the incident neutron angle of 0 degrees, and (b) PHS of 1 mm Sci-Fi measured by D-Li reaction and D-D reaction in FNL experiment.
PHS of 1 mm Sci-Fi measured by D-Li reaction shows an inconspicuous recoil proton edge generated by D-Li neutron.

Calculation of D-D neutron response for four different-head detectors
- Calculation for neutron spectra of D-D reaction
- Response calculation for D-D reactions
- A n al yses for the experimental results based on the calculations
To compare the 1mm Sci-Fi without Al to a PS, the neutron reactions are virtually the same. Therefore, the PHS of the 1mm Sci-Fi without Al and the plastic scintillator is in Figure. On the other hand, the PH of the 1 mm Sci-Fi without Al is lower than that of the plastic scintillator, as shown. in fig.
It is concluded that the property of Sci-Fi 1 mm w/o Al is almost the same as that of a plastic scintillator.

Comparison of calculation and experiment for the 1 mm Sci-Fi detector
- Comparison for accelerator experiment
- Comparison for LHD experiment
The science fiction detector signal was almost induced by gamma rays because the Eee of 2.45 MeV neutrons is lower than the energy of gamma rays as shown in the figure. is analyzed. Note that the induced gamma-ray response comes only from the sci-fi detector itself in the LHD experiment.
Finally, the detection efficiency of the Sci-Fi detector is evaluated by the calculated neutron response and the LHD experiment as shown in Fig.

Conclusion
Therefore, the experimental detection efficiency error is estimated from those errors and the standard error of the integrated shot count of the Sci-Fi detector with thresholds. For the Sci-Fi detector measurement in the LHD experiment, the first component of the decay of the pulse height spectrum in the low pulse height region is found to correspond to signals induced by 2.45 MeV neutrons and gamma rays from the PHITS Calculation . The threshold level of the Sci-Fi detector with a high voltage of -1700 V is estimated to correspond to Eee.
The detection efficiencies of the sci-fi detector estimated from the higher-threshold LHD experiment are in good agreement with the detection efficiencies of the sci-fi detector calculated with the PHITS code.
Appendix
Detection efficiency of the 1mm Sci-Fi detector contributed by protons has been evaluated by PHITS calculations with the different threshold values of the proton energy, as shown in Figure 6.24(b) shows the detection efficiency of the 1mm Sci- Fi detector showing the contribution of carbon-elastic scattering by neutrons of different energy with different carbon energy thresholds for the contribution of the reflected carbon by n-C-elastic scattering. Clearly, the reduced detection efficiency arises from the competition between n-p and n-C elastic scattering around 8 MeV neutrons.
The decrease in detection efficiency in low proton threshold cases at 4 MeV also has the same reason.

Triton burnup study on LHD
Triton burnup ratio measured in various plasma conditions using NAS
In the first LHD deuterium plasma campaign, the triton burnup ratio was measured using NAS on the 8-O port in various magnetic configurations. The drift surface of spirally trapped energetic ions in Rax of 3.55 m corresponds to magnetic flux surfaces. Collisionless orbits of spirally trapped energetic ions in the Boozer coordinates in Rax of 3.55 m, 3.6 m and 3.75 m.
It appears that more data points are needed to show the dependence at Rax of 3.90 m.

Time-evolution measurement of triton burnup
- Cross-calibrated Sci-Fi counts with total 14 MeV neutron yield
- Time evolution of triton burnup 14 MeV neutron
- Comparison of triton burnup ratio evaluated with NAS and Sci-Fi detector
The time trace of the 14 MeV neutron emission rate can be measured using two Sci-Fi detectors with absolute detection efficiencies as shown in Fig. 7.7, the triton burn ratios are estimated from shock-integrated Sci-Fi counts with a threshold voltage of 300 mV and a calibration factor of 2.3×10⁻¹⁰ counts per 14 MeV neutron for the Sci-Fi LANL detector as shown in Fig. It can be seen that the density dependence of the triton burn ratio estimated by Sci-Fi is almost the same as that from NAS.
Therefore, it is again demonstrated that the Sci-Fi detector can work as complementary 14 MeV neutron diagnostics to NAS and will play an important role in triton burnout study.

Time-evolution calculation of 14 MeV neuron emission rate
Summary
Two Sci-Fi detectors worked successfully to measure the time evolution of the 14 MeV neutron emission rate for the triton burn study on the LHD. For the measurement of the Sci-Fi detector in the LHD experiment, the first decay component of the PHS in the low-pulse-height region has been found to correspond to . The detection efficiency of the 1 mm Sci-Fi detector for 14 MeV neutron is obtained with different thresholds for the LHD experiment.
Pu, et al., "Scintillating fiber detectors for time-evolution measurement of the triton burnout on the Large Helical Device", Review of Scientific Instruments, 89 10I105 (2018).