저작자표시-변경금지 2.0 대한민국 이용자는 아래의 조건을 따르는 경우에 한하여 자유롭게
l 이 저작물을 복제, 배포, 전송, 전시, 공연 및 방송할 수 있습니다. l 이 저작물을 영리 목적으로 이용할 수 있습니다.
다음과 같은 조건을 따라야 합니다:
l 귀하는, 이 저작물의 재이용이나 배포의 경우, 이 저작물에 적용된 이용허락조건 을 명확하게 나타내어야 합니다.
l 저작권자로부터 별도의 허가를 받으면 이러한 조건들은 적용되지 않습니다.
저작권법에 따른 이용자의 권리는 위의 내용에 의하여 영향을 받지 않습니다. 이것은 이용허락규약(Legal Code)을 이해하기 쉽게 요약한 것입니다.
Disclaimer
저작자표시. 귀하는 원저작자를 표시하여야 합니다.
변경금지. 귀하는 이 저작물을 개작, 변형 또는 가공할 수 없습니다.
공학석사 학위논문
의료영상을 이용한 인공지능 분류 모델 성능을 향상시키기 위한 라벨 노이즈 및 영상 크기에
관한 연구
A Study on Label Noise and Matrix Size for Enhancing Performance of Deep Learning-based Classification Model in
Medical Imaging
[UCI]I804:48009-200000365113 [UCI]I804:48009-200000365113
의료영상을 이용한 인공지능 분류 모델 성능을 향상시키기 위한 라벨 노이즈 및 영상 크기에
관한 연구
지 도 교 수 김 남 국, 서 준 범
이 논문을 공학석사 학위 논문으로 제출함
2021 년 2 월
울 산 대 학 교 대 학 원
의 과 학 과
장 령 우
감사의 글
새로운 도전을 한 지 어느덧2년이 되어 졸업을 앞두고 있습니다.막연하게 꾸었던 의료인공지능에 대한 꿈도 어느덧 구체화가 되어 가지만 아직도 무궁한 가능성의 대해 를 탐험하는 느낌을 받습니다.이 망망대해에서 길잡이가 되었던 연구실 생활은 제 인 생에서 잊지 못할 추억과 배움의 장이 되었습니다.
석사 과정 연구와 공부,그리고 그 외 부분까지 세심하게 살피시고 진심어린 조언을 아끼지 않았던 김남국 교수님,서준범 교수님께 마음을 다해 감사의 인사를 올립니다.
교수님들이 없는 제 학위생활은 상상하기가 힘들 정도로 큰 버팀목과 길잡이가 되어주 셨습니다.
또한 학위 과정동안 제게 많은 가르침을 주었던 연구실 동료들,김영곤 선생님,김인 환 선생님,김성철 선생님,조성만 선생님,박주영 선생님,조경진 선생님,서지연 선생 님,김민지 선생님,은다인 선생님,김민규 박사님 그리고 모든 선생님들께도 고개숙여 감사드립니다. 즐거울 때나 힘들 때나 함께 옆에 있어주고 학문적으로 가르침을 주시 고 인간적으로 저를 존중해주셨던 선생님들 덕분에 이 자리까지 올 수 있게 되었습니 다.
바쁘신 와중에도 심사위원을 흔쾌히 허락해주신 배현진 대표님,연구 과정에서 많은 도움을 주신 이상민 교수님,황혜전 교수님,노한나 교수님께도 감사의 인사를 드립니 다.
대학원에 입학하여 과학적 마음가짐이 무엇인지,연구란 무엇인지 하나하나 배워나 가며 점차 발전하는 제 모습을 볼 수 있어서 행복하다는 말로는 부족했던2년이었습니 다.
마지막으로 도전하는 제 모습을 언제나 사랑해주시고 무한한 응원을 해주시는 존경 하는 부모님,그리고 사랑하는 동생 지원이에게 감사의 인사를 전합니다.
Abstract
Deep learning, a cutting-edge paradigm for machine learning, had accelerated development of medical artificial intelligence on imaging modalities. Today, many studies on various imaging modalities are based on deep learning algorithms. Among deep learning algorithms, convolutional neural network (CNN) is major tool for studying images, videos.
Medicine is distinguished domain to apply deep learning methods. Medical images are different from common images, as they are composed into digital imaging and communication in medicine (DICOM) format. Common images are based on 8-bit image format, such as portable network graphics (PNG) or joint points expert group (JPEG), while medical DICOM images are based on bits same or higher than 8-bit, for example 12-bit or 16-bit. Furthermore, their unique acquisition protocols, imaging contrast mechanisms are different from those of natural images. Furthermore, natural images contain objects usually in area nearby center of image, in contrast in DICOM images the region of interest (ROI) can be in any spot, any size.
For example, lung nodule can locate in upper area of lung in chest X-ray (CXR), lower area, middle area, that is, literally anywhere. Also, it can have sharp margin, speculated margin, or vague margin as well. Therefore, deep learning training strategy may, or should be different from that of natural images. In this study, we contemplated how to train medical artificial intelligence efficiently, in the perspective of robust learning and image size in CXR.
There are enormous factors that have effect on model performance. From accuracy of label or matrix size, model selection, to dataset size, every factor determines model performance.
However, in this paper, we only experimented label noise and matrix size, which are considered to be most basic factors when constructing dataset and feeding image data to network.
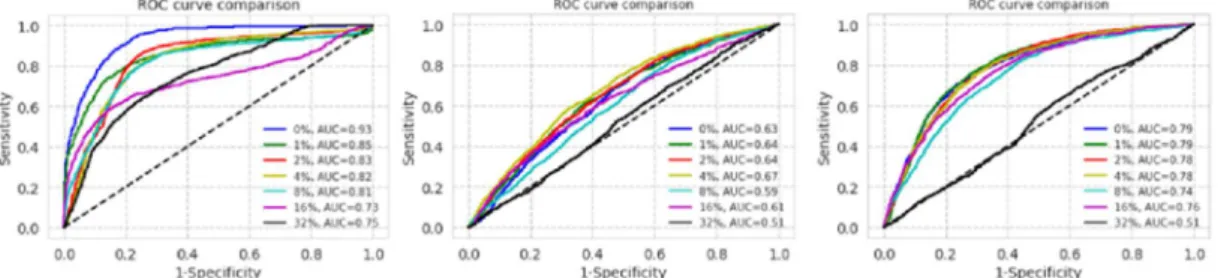
we have randomly converted labels from normal to abnormal, and abnormal to normal, with 0%, 1%, 2%, 4%, 8%, 16%, 32% and analyzed area under the receiver operating characteristic (AUROC). There was statistically significant difference between 0% of our collected dataset from 2% noise rate to 32% noise rate. This means CNN model is highly sensitive to label noise.
Furthermore, we had experimented the same setting on public dataset, from national institute of health (NIH) and Stanford CheXpert dataset, and the result showed these public datasets endured label noise up to 16%. This result has to possible interpretations: (1) CNN is sensitive to label noise and public datasets endure label noise because they contain label noise to some extent. (2) CNN itself is robust to label noise, yet for some reason, CNN model on our dataset seems to be sensitive to label noise. To distinguish these two possibilities, we randomly selected images from each public dataset and one radiologist with more than 10-years experiences visually confirmed whether images are correctly labeled or not. The result of visual scoring said that there was around 20~30% incorrect labels. Therefore, we could conclude that possibility (1) is correct.
For the matrix size of medical artificial intelligence, to investigate the optimal input matrix size for deep learning-based computer-aided diagnosis (CAD) of nodules and masses on chest radiographs. Detection model and classification models were experimented to find out optimal matrix size, with various matrix sizes (256, 448, 896, 1344, 1792)
We had experienced two networks for detection, and one network for classification. In detection networks, matrix size was proved to be optimal with size 896 and 1344, and 896 in two models, respectively. In classification network, matrix size was proved to be optimal with size 896. Thus, we can conclude that matrix size around 1000 is optimal for training medical image data. This is coherent to the fact that many deep learning studies are based on matrix size of around 1024.
To summarize, in this paper we analyzed two factors to increase model performance in medical artificial intelligence on imaging modalities. First is the label noise, which had conclusion that the more accurate dataset, the higher performance. Second is the matrix size, which had conclusion that matrix size around 1000 is best for detection and classification tasks.
Contents
Abstract ...i
Table Content...iv
Figure Content ...v
Introduction ...1
A Study on Label Noise and Matrix Size for Enhancing Performance of Deep Learning-based Classification Model in Medical Imaging ...3
Materials and Methods ...3
Assessment of robustness of convolutional neural networks using chest X-ray...3
Assessment of effect of matrix size on convolutional neural network using chest X- ray...8
Results ...10
Assessment of robustness of convolutional neural networks using chest X-ray....10
Assessment of effect of matrix size on convolutional neural network using chest X- ray...14
Discussion...17
Assessment of robustness of convolutional neural networks using chest X-ray....17
Assessment of effect of matrix size on convolutional neural network using chest X- ray...18
Conclusion...18
References ...20
Korean Abstract ...21
Table Content
Table 1 Dataset description of the Asan medical center and Seoul national university
Bundang hospital dataset ...3 Table 2 Dataset description of the national institutes of health (NIH) dataset ...4 Table 3 Dataset description of CheXpert dataset ...4 Table 4 Brief description of the datasets of Asan medical center (AMC) and Seoul national
university Bundang hospital (SNUBH), national institute of health (NIH), and CheXpert ...5 Table 5 Distribution of 3 randomly shuffled datasets. (Normal to normal: Normal labels that
have not been changed after random shuffling ...6 Table 6 Dataset description for training, validation, and test sets of the Asan Medical Center
(AMC) and Seoul National University Bundang Hospital (SNUBH) dataset ...7 Table 7 Demographics for training, validation, and test sets in Asan medical center and Seoul national university Bundang hospital ...9 Table 8. ROC comparison for AMC, SNUBH, NIH, CheXpert datasets ...12 Table 9. Table of merit of jackknife free-response receiver operating curve of detection
models trained with different sizes of input matrix for Mask RCNN and RetinaNet ....15 Table 10. Receiver operating curve comparisons of classification models trained with
different size of input matrix for public dataset (CheXpert dataset) ...16
Figure Content
Figure 1. Receiver operating characteristic (ROC) curves for datasets of Asan Medical Center and Seoul National University Bundang Hospital, National Institutes of Health, and CheXpert (from left to right) with each label noise rate ...10 Figure 2. Semilog plot of area under the curves (AUC) of receiver operating characteristic
(ROC) curves in the datasets of Asan Medical Center and Seoul National University Bundang Hospital, National Institutes of Health, and CheXpert (from left to right) ...10 Figure 3. F1 scores of the datasets of Asan Medical Center and Seoul National University
Bundang Hospital, National Institutes of Health, and CheXpert (from left to right) ...10 Figure 4. Visual scoring by 3 licensed physicians ...13 Figure 5. Visual scoring of thoracic radiologist over a 20-year experience ...13 Figure 6. Free-response receiver operating curve comparisons of models trained with
different sizes of input matrix using (a) Mask R-CNN and (b) RetinaNet ...14
Introduction
With the rise of deep learning since 2012 ImageNet Large Scale Visual Recognition Challenge (ILSVRC), in which AlexNet1 was introduced, computer vision had met new era. It is impossible to think image and video analysis without deep learning, and medical image analysis is not the exception. There has been enormous studies that utilized deep learning method for medical images2 and convolutional neural network (CNN) is the most efficient, specialized, and frequently used method in deep learning.
However, there is a basic question about utilizing deep learning in medical image analysis.
First is the unique feature of medical images pixels. Medical images are different from those of portable network graphics (PNG) or joint points expert group (JPEG), which is formatted as digital imaging and communication in medicine (DICOM). Difference in file extension implies different data architecture. Usually, PNGs and JPEGs are composed of 8-bit image structure. That is, pixels have range from 0 to 255. Compared to these formats, DICOMs are composed of higher bits, which means DICOMs have more range than PNGs or JPEGs. For example, usual computed tomography (CT) images range from -1024 to 3071, having 4096 possible pixel range. Furthermore, X-rays can range from 0 to 65535, having 16-bit pixel range.
Therefore, not only preprocessing but also training strategy for medical image analysis may be and should be different from PNGs or JPEGs.
Second is domain-specific region of interest (ROI) in medical images. In usual images, subjects are located at center of the image or near of center of the image. There can be exceptions, yet usual tendency is near of center of image. However, in medical image, ROI can be anywhere. For example, lung nodule or mass can locate in left as well as right lung, from lower lung area to upper lung area. Furthermore, this nodule or mass is not dominantly shown in the given chest X-ray (CXR). They are usually vague or opaque. Therefore, researchers should not just implement usual deep learning strategy to medical image.
There had been uncountable studies that modified and utilized deep learning methods to medical images. However, the universally applicable strategy had not been studied. For example, as deep learning requires large dataset for training, we need to gather data as much as possible. Considering medical images are hard to label and takes tremendous effort to acquire high-quality bulk dataset, how much can we trust report-based, noisy dataset3? For
the other example, lesions such as lung nodule or lung mass can locate in anywhere in the lung with small size. Then, what should we choose between efficiency of training process – the small image, the better more efficient – and higher performance of the network – the bigger of the image, the better the performance is expected. In other words, there is trade-off between training efficiency and model performance4.
To develop medical deep learning model, first step is to construct dataset. Evidently, it is labor intensive and tedious for clinician to develop high-quality image dataset. Therefore, many studies and products are based on report-based data cleansing. However, this study had revealed that report-based data cleansing might have label noise to some extent, and this label noise had effect on model performance. Furthermore, original DICOM image have matrix size around 2,000 by 2,000 and some may argue that this original size is necessary for the network to have high performance. However, we had revealed that only 1,000 by 1,000 size seemed to be enough for the network to saturate.
To summarize, in this paper we have contemplated two training strategies for CXR, to maximize CNN-based model performance.
A Study on Label Noise and Matrix Size for Enhancing Performance of Deep Learning- based Classification Model in Medical Imaging
In this paper, we had analyzed two factors that have effect on medical deep learning model performance. That is, label noise and matrix size. There are other various factors that might have effect on performance of deep learning model, such as model type, learning rate, preprocessing etc. However, in this paper we only speculated two factors: label noise and matrix size, which are considered to be two basic options when training medical images to deep learning.
Materials and Methods
Assessment of robustness of convolutional neural networks using chest X-ray
For CXR dataset, we had collected two-centered dataset from Asan medical center (AMC) and Seoul national university Bundang hospital (SNUBH). These data are chosen to be the ones that have corresponding CT image with interval within 7 days. And for the public dataset, we had acquired national institute of health (NIH) dataset5 and Stanford CheXpert dataset6. Detailed information of AMC and SNUBH are shown in Table 1, NIH for Table 2, CheXpert for Table 3.
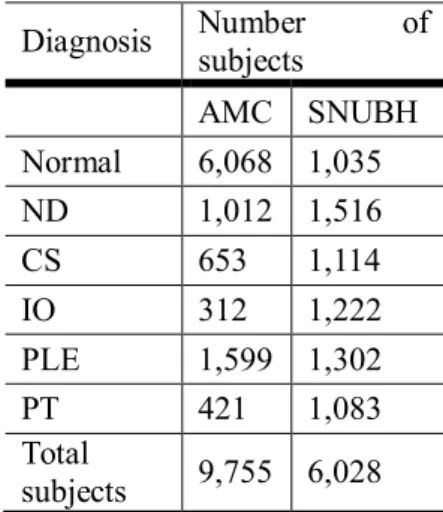
Table 1 Dataset description of the Asan medical center and Seoul national university Bundang hospital dataset
Diagnosis Number of
subjects
AMC SNUBH Normal 6,068 1,035
ND 1,012 1,516
CS 653 1,114
IO 312 1,222
PLE 1,599 1,302
PT 421 1,083
Total
subjects 9,755 6,028
One subject may have multiple abnormalities in given chest x-ray. (Abbreviations - AMC:
Asan medical center, SNUBH: Seoul national university Bundang hospital, ND: nodule, CS:
consolidation, IO: interstitial opacity, PLE: pleural effusion PT: pneumothorax)
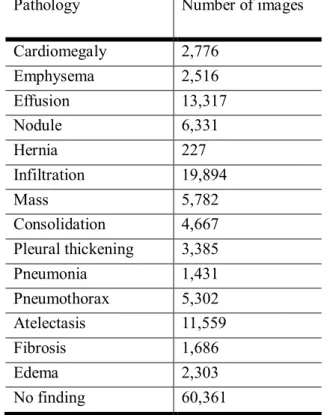
Table 2 Dataset description of the national institutes of health (NIH) dataset
Pathology Number of images
Cardiomegaly 2,776
Emphysema 2,516
Effusion 13,317
Nodule 6,331
Hernia 227
Infiltration 19,894
Mass 5,782
Consolidation 4,667
Pleural thickening 3,385
Pneumonia 1,431
Pneumothorax 5,302
Atelectasis 11,559
Fibrosis 1,686
Edema 2,303
No finding 60,361
Dataset description of the national institutes of health (NIH) dataset. One subject may have multiple abnormalities in given chest x-ray.
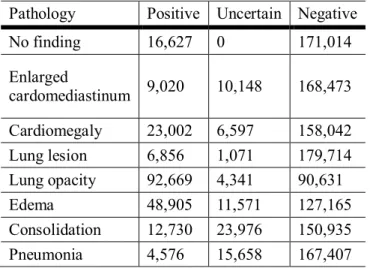
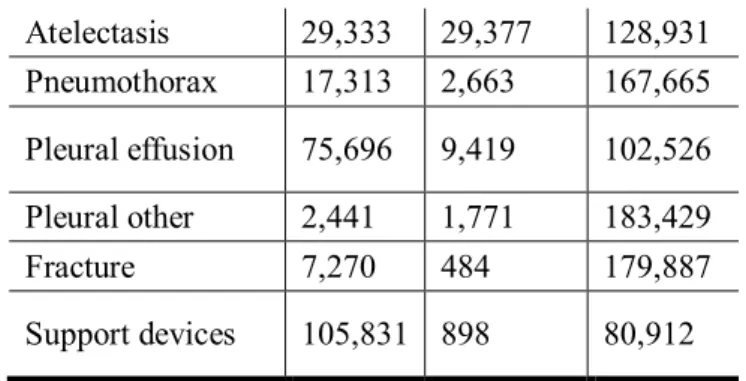
Table 3 Dataset description of CheXpert dataset
Pathology Positive Uncertain Negative
Atelectasis 29,333 29,377 128,931
Pneumothorax 17,313 2,663 167,665
Pleural effusion 75,696 9,419 102,526
Pleural other 2,441 1,771 183,429
Fracture 7,270 484 179,887
Support devices 105,831 898 80,912
One subject may have multiple abnormalities in given chest x-ray.
Because there were differences of number of images between AMC and SNUBH dataset and public datasets, we had randomly sampled normal and abnormal images from public datasets to be same as our dataset. That is, randomly sampled 7,103 normal images and 8,680 abnormal images are used for training, validation, and test sets. In the NIH dataset, images were classified into 15 categories including a “no finding” category. Except “no finding” category, all other disease categories were considered as “abnormal” category, not distinguishing diseases. Same strategy is applied to CheXpert dataset, which had 14 categories including “no finding”. The reason not distinguishing disease categories is that there was no intersection of three dataset disease categories. Distribution of normal and abnormal images are shown in Table 4.
Table 4 Brief description of the datasets of Asan medical center (AMC) and Seoul national university Bundang hospital (SNUBH), national institute of health (NIH), and CheXpert
Distribution of images AMC and SNUBH NIH CheXpert
# of no finding/normal 7,103 60,361 22,419
# of abnormal 8,680 51,759 201,897
# of total 15,783 112,120 224,316
After selecting data, we had randomly changed given label of each dataset. This changing label process will be called as label noise. Ratio were 0%, 1%, 2%, 4%, 8%, 16%, 32%. “Normal”
or “no finding” label became “abnormal”, and vice versa.
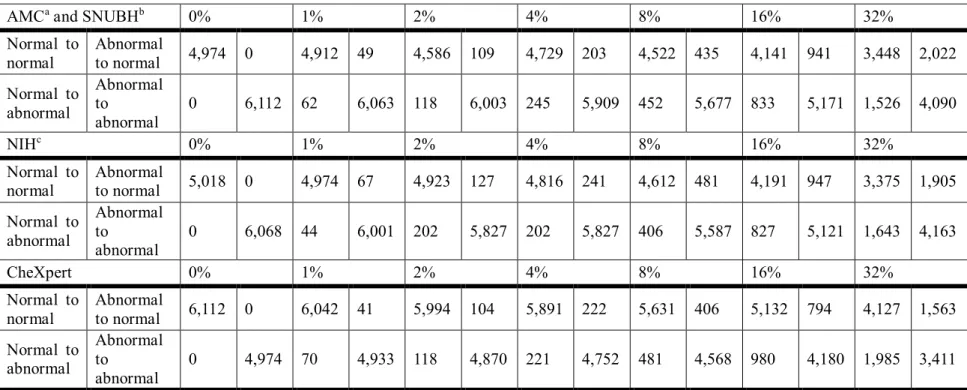
The distributions of this random label shuffle are shown in Table 5.
Table 5 Distribution of 3 randomly shuffled datasets. (Normal to normal: Normal labels that have not been changed after random shuffling
AMCaand SNUBHb 0% 1% 2% 4% 8% 16% 32%
Normal to normal
Abnormal
to normal 4,974 0 4,912 49 4,586 109 4,729 203 4,522 435 4,141 941 3,448 2,022
Normal to abnormal
Abnormal to
abnormal
0 6,112 62 6,063 118 6,003 245 5,909 452 5,677 833 5,171 1,526 4,090
NIHc 0% 1% 2% 4% 8% 16% 32%
Normal to normal
Abnormal
to normal 5,018 0 4,974 67 4,923 127 4,816 241 4,612 481 4,191 947 3,375 1,905
Normal to abnormal
Abnormal to
abnormal
0 6,068 44 6,001 202 5,827 202 5,827 406 5,587 827 5,121 1,643 4,163
Images in NIH and CheXpert datasets are all 8-bit PNG format, therefore windowing of 12- bit or higher AMC and SNUBH DICOM dataset is required to compare fairly. In public datasets, sizes of images were different from image to image. Therefore, we had resized images from all three datasets into 1024 by 1024 pixels. Bilinear interpolation was used to resize image and min-max scaling was applied to each image so that every pixel value was in range from 0 to 1.
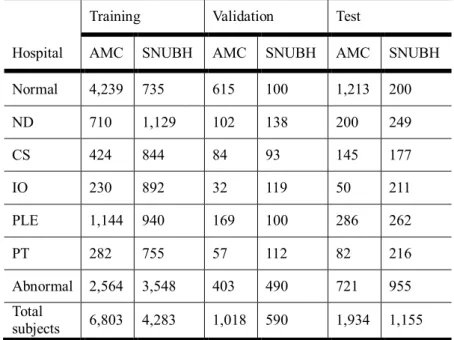
We divided each dataset into three groups: train, validation, test sets. Detailed composition of AMC and SNUBH dataset is shown in Table 6.
Table 6 Dataset description for training, validation, and test sets of the Asan Medical Center (AMC) and Seoul National University Bundang Hospital (SNUBH) dataset
Training Validation Test
Hospital AMC SNUBH AMC SNUBH AMC SNUBH
Normal 4,239 735 615 100 1,213 200
ND 710 1,129 102 138 200 249
CS 424 844 84 93 145 177
IO 230 892 32 119 50 211
PLE 1,144 940 169 100 286 262
PT 282 755 57 112 82 216
Abnormal 2,564 3,548 403 490 721 955
Total
subjects 6,803 4,283 1,018 590 1,934 1,155
One subject may have multiple abnormalities in given chest x-ray. (Abbreviations - AMC:
Asan Medical Center. SNUBH: Seoul National University Bundang Hospital. ND = nodule.
CS = consolidation. IO = interstitial opacity. PLE = pleural effusion. PT = pneumothorax.)
There are hundreds of CNN models, however we had chosen CheXNet7as our baseline model.
CheXNet is 121-layered DenseNet8with 14 categories including “no finding”. We modified last fully connected layer to be have one node of activation sigmoid to classify normal and abnormal. We trained this model not using transfer learning, for example from ImagNet9-
pretrained network. That is, we trained model from scratch. We used Keras package in python language and used Adam optimizer10 with learning rate of 0.0001. Loss was set to be binary cross-entropy, and we measured accuracy during training with threshold 0.5. All three dataset was trained for 20 epochs for each label noise level. Training was conducted with a NVIDIA GeForce RTX 2070 for approximately 9 days for total training process. Moreover, we did not apply label noise for the validation and test sets.
For inference, model with smallest validation error for each dataset and for each label noise was selected. In each model, we analyzed performance of test set with receiver operating characteristic (ROC) and area under the curve (AUC). To inspect effect of label noise, we compared AUC of each label noise to AUC of 0% label noise using statistical method11. The standard error (SE) is defined as
SE = (1 − ) + ( − 1)( − ) + ( − 1)( − )
Where is AUC, is the number of abnormal images, and is the number of normal
images, = and = .
Assessment of effect of matrix size on convolutional neural network using chest X-ray
Datasets are same as above AMC and SNUBH dataset. Among various disease categories, we collected only normal and nodule category, and split dataset into three parts – train, validation, and test sets. Detailed description of nodule category is shown in Table 7. To extra-validate, CheXpert dataset was used. Details of CheXpert dataset is described previously. In CheXpert
using figure of merit (FOM) of jackknife free-response receiver operating curve (JAFROC).
FOMs trained with 896 input matrix size were compared with other models’ performances trained with different sizes. 5-fold cross-validation were conducted. Paired t-test were conducted to determine whether the model’s performances with different sizes of matrices were significant.
For the classification network, we performed AUC comparison for every pair of AUCs for each fold. After comparison, we performed AUC comparison and statistically similar AUCs were grouped. For each fold, we presented we presented results of AUC comparison with matrix size 896. To confirm whether 5-fold cross-validation is valid or not, we performed one- way analysis of variation between 5-fold cross-validation.
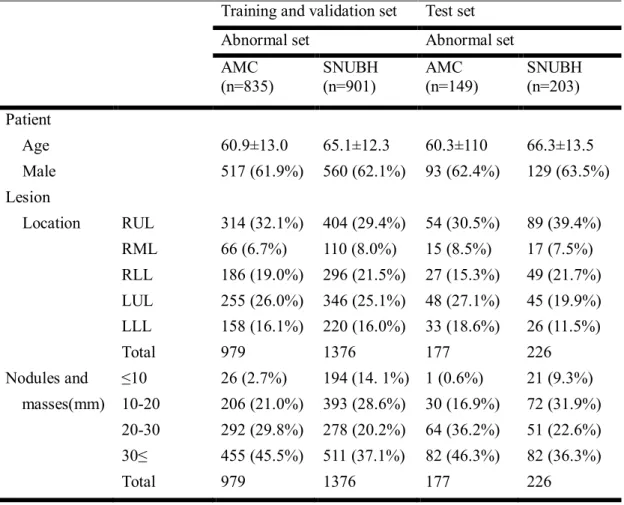
Table 7 Demographics for training, validation, and test sets in Asan medical center and Seoul national university Bundang hospital
Training and validation set Test set
Abnormal set Abnormal set
AMC (n=835)
SNUBH (n=901)
AMC (n=149)
SNUBH (n=203) Patient
Age 60.9±13.0 65.1±12.3 60.3±110 66.3±13.5
Male 517 (61.9%) 560 (62.1%) 93 (62.4%) 129 (63.5%)
Lesion
Location RUL 314 (32.1%) 404 (29.4%) 54 (30.5%) 89 (39.4%)
RML 66 (6.7%) 110 (8.0%) 15 (8.5%) 17 (7.5%)
RLL 186 (19.0%) 296 (21.5%) 27 (15.3%) 49 (21.7%) LUL 255 (26.0%) 346 (25.1%) 48 (27.1%) 45 (19.9%) LLL 158 (16.1%) 220 (16.0%) 33 (18.6%) 26 (11.5%)
Total 979 1376 177 226
Nodules and ≤10 26 (2.7%) 194 (14. 1%) 1 (0.6%) 21 (9.3%) masses(mm) 10-20 206 (21.0%) 393 (28.6%) 30 (16.9%) 72 (31.9%)
20-30 292 (29.8%) 278 (20.2%) 64 (36.2%) 51 (22.6%) 30≤ 455 (45.5%) 511 (37.1%) 82 (46.3%) 82 (36.3%)
Total 979 1376 177 226
Results
Assessment of robustness of convolutional neural networks using chest X-ray
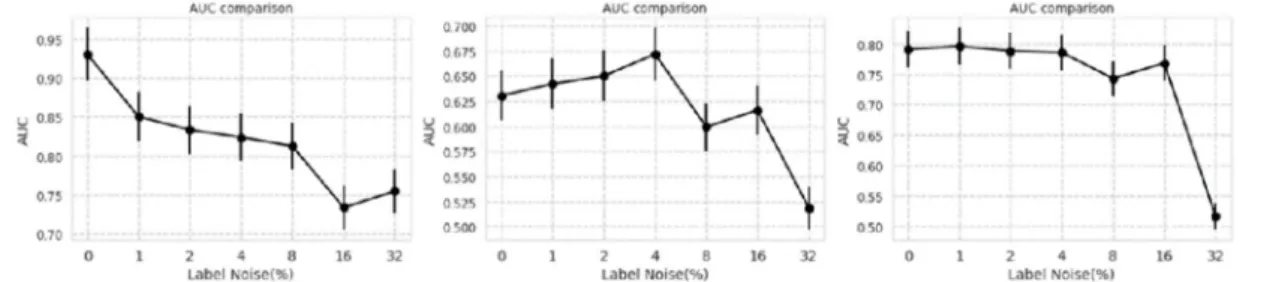
After training, ROC curves on test sets are shown in Figure 1. Semilog plot of AUCs of ROCs are shown in Figure 2. F1 scores of the results are shown in Figure 3.
Figure 1. Receiver operating characteristic (ROC) curves for datasets of Asan Medical Center and Seoul National University Bundang Hospital, National Institutes of Health, and CheXpert (from left to right) with each label noise rate
Figure 2. Semilog plot of area under the curves (AUC) of receiver operating characteristic (ROC) curves in the datasets of Asan Medical Center and Seoul National University Bundang Hospital, National Institutes of Health, and CheXpert (from left to right)
Bundang Hospital, National Institutes of Health, and CheXpert (from left to right)
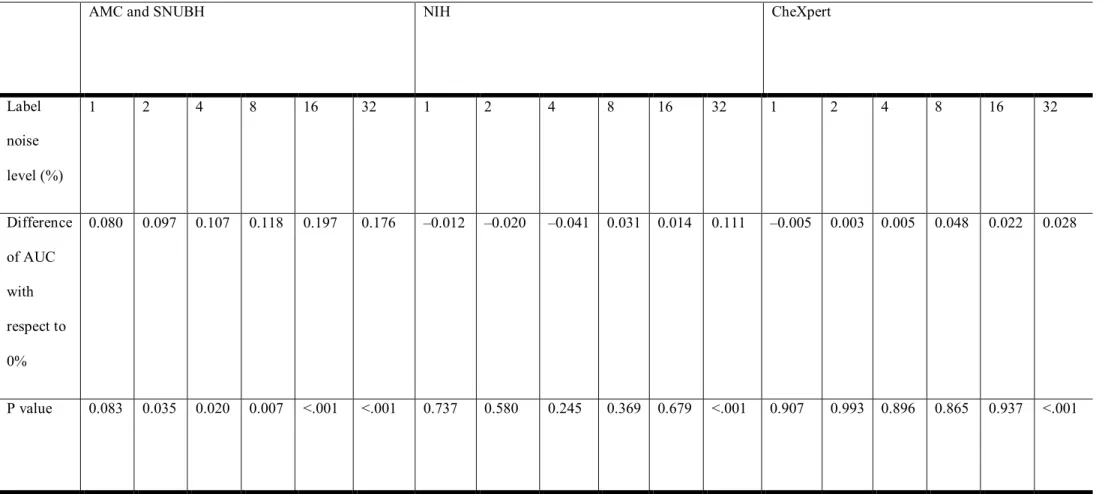
Comparison of performance of 0% label noise to other label noise for three datasets are shown in Table 8.
Table 8. ROC comparison for AMC, SNUBH, NIH, CheXpert datasets
AMC and SNUBH NIH CheXpert
Label noise level (%)
1 2 4 8 16 32 1 2 4 8 16 32 1 2 4 8 16 32
Difference of AUC
0.080 0.097 0.107 0.118 0.197 0.176 –0.012 –0.020 –0.041 0.031 0.014 0.111 –0.005 0.003 0.005 0.048 0.022 0.028
The NIH and CheXpert datasets were re-evaluated by 3 non-radiologist licensed physicians and one radiologist with more than 10-years experiences. Three physicians evaluated CXRs one for each doctor, and the radiologist evaluated CXRs twice. The result is shown in Figure 4 and 5 for 3 physicians, one radiologist, respectively.
Figure 4. Visual scoring by 3 licensed physicians
(Abbreviations - Pred: predicted; Abnl: abnormal; NL: normal; NIH: National Institutes of Health; Acc: accuracy.)
Figure 5. Visual scoring of thoracic radiologist over a 20-year experience
(Abbreviations - Pred: predicted; Abnl: abnormal; NL: normal; NIH: National Institutes of Health; Acc: accuracy).
Assessment of effect of matrix size on convolutional neural network using chest X-ray
In detection models, similar tendencies were observed: (1) models with input matrix size 896 performed better in terms of FOM and average sensitivity for nodule and mass. The result is shown in Figure 6. (2) As shown in Table 9, matrix size of 896 showed best performance for detection task.
Figure 6. Free-response receiver operating curve comparisons of models trained with different sizes of input matrix using (a) Mask R-CNN and (b) RetinaNet
Table 9. Table of merit of jackknife free-response receiver operating curve of detection models trained with different sizes of input matrix for Mask RCNN and RetinaNet
Matrix sizes
256 448 896 1344 1792
Mask R-CNN 0.667 (0.624-0.708) 0.814 (0.782-0.847) 0.869 (0.844-0.894) 0.856 (0.829-0.882) 0.820 (0.785-0.854)
P value with 896 <0.001* <0.001* 0.37 <0.001*
RetinaNet 0.329 (0.290-0.368) 0.738 (0.700-0.775) 0.906 (0.883-0.928) 0.832 (0.800-0.865) 0.713 (0.674-0.751)
P value with 896 <0.001* <0.001* <0.001* <0.001*
Data are figures of merit (95% confidence interval). Statistical comparisons between a model trained with 896 and others were carried out to determine whether the model’s performances with different sizes of matrices were significant. * indicates a significant difference between 896
and other matrices, P value < 0.001
Result of classification model trained with 896, 1344, and 1792 had mean AUC with standard deviation with 0.0828±0.034, 0.870±0.006, 00.903±0.014, 0.896±0.019, 0.915±0.016 with five folds, respectively. Performances of models seemed to be increased as matrix size increased.
However, these performances showed to be saturated after matrix size of 896. This saturation of model performances and their performance grouping is shown in Table 10.
Table 10. Receiver operating curve comparisons of classification models trained with different size of input matrix for public dataset (CheXpert dataset)
256 448 896 1344 1792
1-fold 0.832±0.010 (<0.001)A 0.872±0.009 (0.39)B 0.882±0.008B 0.877±0.008 (0.67)B 0.921±0.007 (<0.001)C 2-fold 0.854±0.009 (<0.001)D 0.878±0.008 (0.02)D 0.904±0.007E 0.893±0.007 (0.31)E 0.906±0.007 (0.85)E 3-fold 0.769±0.011 (<0.001)F 0.871±0.009 (0.02)G 0.898±0.008H 0.878±0.008 (0.08)H 0.936±0.006 (<0.001)I 4-fold 0.834±0.010 (<0.001)J 0.867±0.009 (<0.001)J 0.907±0.007K 0.878±0.008 (0.01)L 0.893±0.008 (0.19)K 5-fold 0.848±0.009 (<0.001)L 0.861±0.009 (<0.001)L 0.921±0.007M 0.886±0.008 (<0.001)N 0.923±0.003 (0.83)M Average±SD 0.828±0.034 (<0.001) 0.870±0.006 (0.01) 0.903±0.013 0.882±0.006 (0.06) 0.915±0.015 (0.24)
Data are shown with area under the curve (AUC) ± standard error (SE) (P value with 896), SD: Standard Deviation
Statistical analysis of classification network with multi-scale matrix size and five-fold cross-validations. Each row represents 1st to 5th cross-
Discussion
Assessment of robustness of convolutional neural networks using chest X-ray
If we only consider the result of CNN network, we have two possibilities: (1) CNN is sensitive to label noise, (2) CNN itself is robust to label noise, but for some reason it seems sensitive to label noise in AMC and SNUBH dataset. To differentiate these two possibilities, we visually scored few hundred images from public datasets, namely NIH and CheXpert. Result of visual scoring showed that there were 20~30% label noise in public datasets, this can be the reason of enduring label noise of public datasets. The reason of label noise in public datasets is that they are acquired by natural language processing, thus abnormal CXRs which were reported as “no interval change” might be classified into “no finding” category. This can amplify label noise of public datasets.
However, there are several limitations in this study. First, compared to the high-quality datasets from referral hospitals, there are “no finding” category in public datasets. This “no finding”
category does not imply normal. “No finding” category is the complement of other disease categories, not implying absolute normal. However, in our dataset, “normal” category means absolute normal. That may have effect on performance of models.
Also, robustness of CheXNet, a 121-layered DenseNet does not imply the robustness of CNN architecture. This is only one example of CNN and there are other robust CNN models that are robust to label noise. The most famous network is ChoiceNet15, and there exist other networks that are robust to label noise.
Third, limitation of training dataset might have effect on robustness of CNN architecture. As mentioned above, large dataset might necessary condition for CNN to be robust to label noise16 Regardless of these drawbacks, the assertion that CNN is robust to label noise16should be reconsidered. The mentioned study had experimented on easy, simple dataset such as modified national institute of standards and technology (MNIST), which cannot guarantee universal robustness of CNN on real-world dataset.
In clinical setting, performance of computer-aided diagnosis (CAD) is extremely important.
When it comes to diseases such as lung cancer, which can change patients’ afterlife, or diseases such as tuberculosis, pneumonia, which leads to medication, accurate diagnosis and accurate treatment plan is important. Therefore, decreased CAD performance can lead to misdiagnosis of large number of patients as CAD is used over and over. Followed by our study, it needs to be emphasized that clean labels and accurate datasets are a necessary condition for developing clinically relevant CAD in medicine.
Assessment of effect of matrix size on convolutional neural network using chest X-ray This study shows performance of CNN model can vary according to matrix size. The best model performance seems to be around 896, which is near 1000. Many studies set their matrix size from study to study, from 22417to 102418, and we had shown that performances of studies can be biased.
In detection models, performance of the two models increased until matrix size of 896 and dropped performance as matrix size got bigger. The reason for this decrease can be interpreted as detection model is overwhelmed after its optimal matrix size. As matrix size gets bigger, in the detection network, it is hard for model to get ROI region, due to the increased size of image.
In contrast, as the matrix size gets smaller, it is hard for model to see exact lesion area due to the decreased size of image.
In classification models, the model performance seemed to be saturated after matrix size of 896. The reason for this phenomenon seemed to be increased size of lesion. Compared to detection models, in which had to grasp exact lesion area, classification models only change predict label from 0 (normal) to 1 (abnormal) when the lesion area is caught during inference stage. Therefore, the saturation of the model happens when it comes to bigger matrix size of 896.
Our study has several limitations. First, we only tested nodule class, due to the reason that nodule class are relatively easy to detect, compared to interstitial opacity or pleural effusion, which have subjective lesion margins. Second, number of the dataset is limited, and this may have effect performance of the models. Third, extra-validation for classification and detection is not performed. Fourth, CheXpert dataset have label noise up to 20~30%3, and according to the mentioned study3, this may cause decrease of model performance.
Nevertheless, our study showed performance of model can vary according to the size of input matrix, and matrix size of 896 had the highest performance based on different CNN models.
around 1000. Third is that despite it seems irrelevant, detailed training factors can change CNN-based model performance therefore training models with medical images should be extremely careful.
References
1 Krizhevsky, A., Sutskever, I. & Hinton, G. E. Imagenet classification with deep convolutional neural networks. Communications of the ACM60, 84-90 (2017).
2 Kim, M.et al.Deep learning in medical imaging. Neurospine16, 657 (2019).
3 Jang, R. et al.Assessment of the Robustness of Convolutional Neural Networks in Labeling Noise by Using Chest X-Ray Images From Multiple Centers. JMIR medical informatics8, e18089 (2020).
4 Kim, Y.-G. et al. Optimal matrix size of chest radiographs for computer-aided detection on lung nodule or mass with deep learning. European radiology(2020).
5 Wang, X.et al.in Proceedings of the IEEE conference on computer vision and pattern recognition. 2097-2106.
6 Irvin, J.et al.in Proceedings of the AAAI Conference on Artificial Intelligence. 590- 597.
7 Rajpurkar, P.et al. Chexnet: Radiologist-level pneumonia detection on chest x-rays with deep learning. arXiv preprint arXiv:1711.05225(2017).
8 Huang, G., Liu, Z., Van Der Maaten, L. & Weinberger, K. Q. in Proceedings of the IEEE conference on computer vision and pattern recognition. 4700-4708.
9 Deng, J.et al.in 2009 IEEE conference on computer vision and pattern recognition.
248-255 (Ieee).
10 Kingma, D. P. & Ba, J. Adam: A method for stochastic optimization. arXiv preprint arXiv:1412.6980(2014).
11 Hanley, J. A. & McNeil, B. J. The meaning and use of the area under a receiver operating characteristic (ROC) curve. Radiology143, 29-36 (1982).
12 He, K., Gkioxari, G., Dollár, P. & Girshick, R. in Proceedings of the IEEE international conference on computer vision. 2961-2969.
13 Lin, T.-Y., Goyal, P., Girshick, R., He, K. & Dollár, P. in Proceedings of the IEEE international conference on computer vision. 2980-2988.
14 Szegedy, C., Vanhoucke, V., Ioffe, S., Shlens, J. & Wojna, Z. in Proceedings of the IEEE conference on computer vision and pattern recognition. 2818-2826.
15 Choi, S., Hong, S., Lee, K. & Lim, S. Choicenet: Robust learning by revealing output correlations. (2018).
16 Rolnick, D., Veit, A., Belongie, S. & Shavit, N. Deep learning is robust to massive label noise. arXiv preprint arXiv:1705.10694(2017).
Korean Abstract
머신 러닝의 최신 패러다임인 딥러닝은 의료인공지능의 발전에 큰 비약을 가져왔다.오 늘날,많은 이미지를 기반으로 한 많은 연구들은 딥리닝 알고리즘에 기반하고 있다.이 러한 딥러닝 알고리즘 중에서도,합성곱 신경망(CNN)은 이미지나 비디오를 분석하는 데 있어서 주요한 도구가 되고 있다.
의학은 딥러닝 알고리즘을 적용하기에는 독특한 분야이다.의료 이미지들은 일상적으 로 보는portable network graphics (PNG)나joint points expert group (JPEG) 포맷과는 다른 digital imaging and communication in medicine (DICOM) 포맷을 가진다. PNG나JPEG 포
맷은8-비트 이미지로 구성이 되어 있지만, DICOM 포맷은8비트 혹은 그보다 높은12-
비트 혹은16-비트 포맷으로 구성이 되어 있다는 점에서 맥을 달리할 뿐 아니라 이미지 획득,처리,획득 프로토콜,대조도(contrast) 기작과 같은 점에서도 맥락을 달리한다.더 군다나, 일상적인 이미지들은 피사체가 화면 중앙이나 그 근처에 위치하는 반면,
DICOM에서의 관심영역은 어떤 곳이든 될 수 있다.예를 들어,폐 결절과 같은 경우에
는 흉부X선(CXR)상에서 폐의 상부,하부,중간 영역 어느 곳이나 생길 수 있다.또한, 폐 결절은 깨끗한 주변부,첨형 주변부,혹은 희미한 주변부와 같은 어떠한 특성도 가질 수 있다.이 논문에서는,이러한 문제들에 직면하는 의료인공지능을 어떻게 효율적으 로 학습시킬 것인지에 대해서 정답의 강건성, 이미지의 사이즈, computed tomography (CT)상에서의 질환 진행 예측이라는 측면에서 논의한다.
강건성 측면에서,인공지능 연구자들에게 정확하고 깨끗한 정답을 가진 데이터셋을 확 보하는 것은GIGO (Garbage in, garbage out)이라고 불리는 속담이 있을 정도로 상식적 이다.따라서,본 논문에서는 데이터의 정제 정도에 따라서 딥러닝 모델의 정확도가 어 떻게 변하는지를 살펴보았다.먼저, 7일 이내의 쌍이 존재하는CXR과CT이미지를 획 득하고,영상의학과 의사가 판독하여 질환을 정확히 내린 데이터셋을 확보하였다. CXR 이미지들이CT로 확인되었기 때문에,모든CXR들은 정확히 진단되었다고 할 수 있다.
정답의 정확도가 어떻게 영향을 미치는지 알아보기 위해서, 특정 확률로 레이블들을 고 의적으로 바꾸었다.이 특정 확률은 0%, 1%, 2%, 4%, 8%, 16%, 32%였고 정확도는area under the receiver operating characteristic (AUROC)를 측정하였다.이렇게 확보한 데이터
셋에서는 2%에서32%까지의 모든 확률들이0%의 정확도와 통계적으로 유의하게 차
이가 남을 보일 수 있었다.이는CNN이 정답 노이즈에 민감함을 보여준다는 결론을 내 릴 수 있었다.더 나아가서,공개 데이터에 대해서도 같은 실험을 하였다.공개 데이터
셋으로는national institute of health (NIH)와stanford의CheXpert 데이터셋이 쓰였는데, 이 데이터들에서는16%까지 통계적으로 유의한AUROC의 차이를 보이지 않았다.여 기서 두 가지 가능성이 존재하는데, (1) CNN은 정답 노이즈에 취약하다는 결론과, (2) CNN 자체는 정답 노이즈에 강건하지만 모종의 이유로 상기 데이터에 대해서 취약함의 두 가지 가능성을 제시할 수 있다.이 두 가능성을 감별하기 위해서,각 데이터에서 랜 덤하게 이미지를 선택한 다음10년 이상 경력의 영상의학과 의사가 직접 판독을 하는 과정을 수행하였다.결과는 공개 데이터는 약20~30%의 틀린 정답이 있다는 결론을 얻 을 수 있었다.따라서, (1)의 가능성이 옳다는 결론을 얻을 수 있었다.
의료인공지능 학습을 위한 이미지 크기 연구에서는, 딥러닝 기반의 컴퓨터 보조 진단
(CAD)이 폐결절과 폐종괴에 대해서 어떤 영향을 가지는지를 연구하였다.다양한 크기
의 이미지 사이즈(256,448, 896, 1344, 1792)에 대해서 검출 모델과 분류 모델의 성능을 평가하였다.
검출 모델의 성능 평가를 위해서는 두 가지 모델을 실험하였고,분류 모델에 대해서는 한 가지 모델을 사용하였다.검출 모델에 있어서,이미지 사이즈는 첫 번째 모델에서는 896과1344에서 최적의 성능을 보였고,두 번째 모델에서는896에서 최적의 성능을 보 였다. 따라서,이로부터1000픽셀 근방의 이미지 사이즈가 의료인공지능 모델을 학습 하는데 최적의 이미지 사이즈라는 것을 알 수 있었다.이는 대부분의 의료인공지능 모 델들이1000픽셀 근방에서 학습된다는 사실과 일맥상통한다.
요약하자면 본 논문에서는 의료인공지능 학습 전략에 있어서 모델 성능을 최대화할수 있는 두 가지 요인에 대해서 고찰하였다.첫 번째는 정답 노이즈에 관한 것으로 더 정확 한 데이터셋이 있으면 더 좋은 모델을 만들 수 있다는 결론을 얻을 수 있었다. 두 번째 는 이미지 사이즈인데, 1000픽셀 근방의 이미지 사이즈가 가장 좋은 성능을 보인다는 것을 확인할 수 있었다.