저작자표시-비영리-변경금지 2.0 대한민국 이용자는 아래의 조건을 따르는 경우에 한하여 자유롭게
l 이 저작물을 복제, 배포, 전송, 전시, 공연 및 방송할 수 있습니다. 다음과 같은 조건을 따라야 합니다:
l 귀하는, 이 저작물의 재이용이나 배포의 경우, 이 저작물에 적용된 이용허락조건 을 명확하게 나타내어야 합니다.
l 저작권자로부터 별도의 허가를 받으면 이러한 조건들은 적용되지 않습니다.
저작권법에 따른 이용자의 권리는 위의 내용에 의하여 영향을 받지 않습니다. 이것은 이용허락규약(Legal Code)을 이해하기 쉽게 요약한 것입니다.
Disclaimer
저작자표시. 귀하는 원저작자를 표시하여야 합니다.
비영리. 귀하는 이 저작물을 영리 목적으로 이용할 수 없습니다.
변경금지. 귀하는 이 저작물을 개작, 변형 또는 가공할 수 없습니다.
공학석사 학위논문
3D 프린트된 패턴 임베딩을 이용한 대동맥벽의 기계적 특성 모방
Mimicking mechanical properties of aorta tissue with pattern- embedding using 3d printing
울 산 대 학 교 대 학 원 의 과 학 과
권 재 영
[UCI]I804:48009-200000334488 [UCI]I804:48009-200000334488 [UCI]I804:48009-200000334488 [UCI]I804:48009-200000334488 [UCI]I804:48009-200000334488 [UCI]I804:48009-200000334488 [UCI]I804:48009-200000334488
3D 프린트된 패턴 임베딩을 이용한 대동맥벽의 기계적 특성 모방
지 도 교 수 김 남 국
이 논문을 공학석사 학위 논문으로 제출함
2020 년 08 월
울 산 대 학 교 대 학 원 의 과 학 과
권 재 영
감사의 글
고민이 많았던 석사과정이 어느새 끝나갑니다.부족한 공부를 채우고자 시작했지만, 여전히 부족함을 알게 된2년이었습니다.그 부족함을, 주변의 도움을 받아 이렇게 석 사학위 논문의 마침표를 찍을 수 있었습니다.
먼저 연구실 생활과 석사과정 동안 학문적 가르침과 융합연구의 필요성,방법,그리 고 무엇보다 연구자가 지녀야 할 자세를 지도해 주신 김남국 교수님께 감사드립니다.
여러모로 부족했던 저에게 믿음과 가르침을 주신 덕분에 성장할 수 있었습니다. 앞으 로도 더욱 정진하겠습니다.
바쁜 와중에도 심사위원장을 맡아 주시고 임상의의 관점에서 부족한 부분을 파악하 고 적절하게 지도해주신 김준범 교수님,다양한 시점에서 여러 의견을 주시고 응원해 주시며 심사를 맡아 주신 고범석 교수님께도 감사 인사를 드립니다.두 분의 조언이 논 문 완성에 큰 도움이 되었습니다.
그리고 연구실의 아버지처럼 든든한 서준범 교수님,항상 밝은 분위기로 이끌어 주 시는 이준구 교수님,항상 의지가 되는 우리 팀 홍다영 선생님,김태훈 선생님,권은서 선생님,옥준혁 선생님,김민경 선생님,문소진 선생님,그리고 공학자로서 많은 것을 알 려주신 애니메디 솔루션의 김국배 대표님,최승현 이사님,강원대 하호진 교수님 모두 감사의 말씀을 전합니다. 마지막으로 항상 아낌없는 응원과 함께 지켜봐 주시는 부모 님,감사합니다.
영문요약
Use of 3D printing technology has been well-established in the medical field. Based on digital imaging and communication in Medicine (DICOM), various applications such as patient customized guides, simulators, implants, surgical tools, and educational phantoms can be developed to reflect accurate anatomical structures. Compared to the existing practice of mass- production and supply of standard materials, 3D printing technology allows for small-scale manufacture and supply of personalized medical devices. Other advantages include communication between doctors and patients, process simplification, and reduction of operation time. However, 3D printing technology has several limitations, such as lack of diversity of materials, long output time, and lack of accuracy. In particular, the limitations of materials refer to the need for imitation of the anatomical structure, combined with the characteristics of the organization in the production of simulators and educational phantoms.
In this study, we tried to mimic the mechanical properties of aortic walls, by using composite materials and pattern embedding, in order to overcome the limitations 3D printing medical technology and to broaden the horizon of applications.
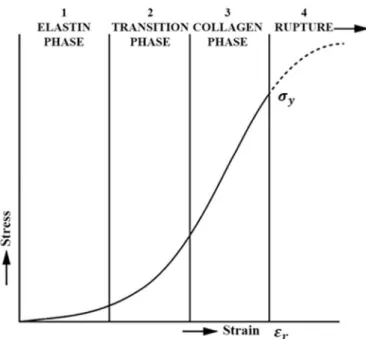
Arteries are cardiovascular blood vessels and they control the pressure and flow through their mechanical characteristics. In many studies, the mechanical behavior of arteries has been described in several parts: (1) In low deformation, the elastic plate supports the load, (2) the more extensive the deformation, the more the collagen fiber load is divided, (3) the collagen fiber load is supported in high deformation, and the rupture occurs when the collagen fiber load is exceeded the yield point.
Agilus of Objet500 connex3 equipment and Dragonskin30 silicone were selected as the basic materials, and VeroCyan of Objet500 connex3 equipment and TPU 94A of Ultimaker3 equipment were selected as the pattern materials. Tensile tests were performed in both basic and pattern materials. Based on tensile test results, one 2D anisotropic pattern (pattern A) and two orthotropic patterns (patterns B and C) were designed. These patterns were embedded into a rectangular box to design the specimen. Considering the difference in tensile strength and strain of the basic material, the Agilus-VeroCyan specimens were designed with a box size of 150 x 30 mm, and a thickness of 3 mm. The Dragonskin 30-TPU 94A specimen was designed with a box size of 115 x 25 mm and a thickness of 2.5 mm. The anisotropic pattern was
incorporated on the specimen by matching the tensile direction, the longitudinal axis, and the shortening. Orthotropic patterns were incorporated in specimens without field or shortcut distinction. Tensile tests were performed based on the designed specimens. All Agilus- VeroCyan specimens were produced in one go, while Dragonskin 30-TPU 94A specimen was produced by fixing the printed TPU 94A pattern in the middle of the mold, and molding silicon around it. Moreover, to examine the effect of the patterns, each pattern was produced with TPU 94A material for thickness as 0.7 and 1.4 mm, and a tensile test was performed. The mean and standard deviation were derived using polynomial fitting, which was unified to the fourth- order, with the R-square value being more than 0.9950. The tensile strength and fracture strain of the aorta, which are known to be average of the tensile strength and fracture strain, were compared with the fracture strain of the five specimens with embedded pattern. The fitted polynomial slope was obtained by referring to a previous study (2.0~3.0 MPa, 2.0~2.3 mm/mm), and also the coefficient of elasticity and the inflection point were obtained. Matlab R2015a was used for analysis of results and production of graphs.
The average tensile strength and standard deviation of Agilus were 1.00 ± 0.05MPa, for VeroCyan's were 34.08 ± 3.31 MPa, for Dragonskin 30 were 2.03 ± 0.17 MPa, and for TPU 94A were 36.71 ± 3.85 MPa. The mean and standard deviation of fracture strain by the material were 3.96 ± 0.12 mm/mm, 0.38 ± 0.08 mm/mm, 5.82 ± 0.46 mm/mm, 9.55 ± 1.25 mm/mm for Agilus, VeroCyan, Dragonskin 30, and TPU 94A respectively. The Dragonskin 30-TPU 94A combination met the criteria for fracture strain, but the tensile strength did not meet the standards. The Agilus-VeroCyan combination had lower fracture strain than the Dragonskin 30-TPU 94A combination for all examined patterns. Increasing the diameter of the pattern increased the tensile strength and stiffness, but the fracture strain decreased. The results of this study differed from the mechanical properties of the actual aorta, but rupture was considered a top priority when a synthetic aorta was considered for application to the human body. Since the focus was to use a synthetic aorta in the human body and not only as a research phantom, it was deemed necessary to increase the tensile strength.
Patterns with two inflection points and increased elastic modulus between them were defined as 0.7 mmAgilus-VeroCyan A-major, B-minor, and 1.4 mm Dragonskin 30-TPU 94A B-minor.
1.4 mm Dragonskin 30-TPU 94A B-minor satisfied the fracture strain standard, but the elastic
modulus did not change much. There was no pattern found to satisfy the tensile strength standard. In some patterns, there were no inflection points. The stress-strain curve and elastic modulus graph for TPU 94A confirmed that the mechanical properties of single materials did not change significantly, even when pattern changes were made. There were differences noticed in the tensile strength and strain for each pattern, but there was no significant difference observed in the graph shape. Except for the C orthotropic pattern, the standards for aorta’s mechanical characteristics were not satisfied. However, since the actual aorta shows a strain rate of about 3 ~ 8 % in the systolic phase, it would be possible to implement aortic behavior if the elastic modulus property was satisfied.
In this study, we proposed a method to imitate the mechanical characteristics of the aortic wall.
We used two materials with different physical properties and pattern embedding, instead of 3D printed materials of one nature. The tensile strength and strain of the aorta were imitated, and we saw the possibility of implementing a more realistic simulator phantom. Obtained results suggest potential of these materials to be able to imitate other types of human tissue.
To this end, further research is needed, on ensuring diversity of materials, redesigning patterns, and establishing and verifying tensile test methods for specimens with embedded pattern.
차 례
영문요약··· i
표 및 그림 차례··· v
Introduction··· 1
Materials and methods ··· 2
1. Base material tensile test··· 4
2. Patterns and specimens design··· 5
3. Pattern embedding specimen tensile test ··· 9
4. Evaluation··· 12
Results ··· 16
Discussion··· 31
Conclusion ··· 33
Reference··· 33
국문요약··· 38
표 및 그림 차례
Table 1. The detailed description of the pattern design. ··· 5 Table 2. Specimen dimensions for ASTM D638. ··· 6 Table 3. Specimen dimensions for ASTM D412. ··· 7 Table 4. Mean and standard deviation of R-square and RMSE in polynomial fitting of tensile
test of basic materials. ··· 15 Table 5. Mean and standard deviation of R-square and RMSE in polynomial fitting of tensile
test of pattern-embedding specimens. ··· 15 Table 6. Mean and standard deviation of R-square and RMSE in polynomial fitting of tensile
test of TPU 94A patterns. ··· 16 Table 7. Mean yield stress and strain at break with standard deviation, modulus of elasticity
and inflection points of each pattern design. ··· 17 Figure 1. Types of arteries and arterioles. Comparison of the walls of an elastic artery, a
muscular artery, and an arteriole. ··· 3 Figure 2. Typical stress-strain curve for a soft biological tissue in uniaxial tension at constant
elongation rate. ( ≥ 2.0 , ≥ 2.0 / )··· 3 Figure 3. Specimen dimensions for ASTM D638. ··· 6 Figure 4. Specimen dimensions for ASTM D412. ··· 7 Figure 5. 3D models of pattern-embedded specimens. (A) Pattern A, with major axis alignment.
(B) Pattern A, with minor axis alignment. (C) Pattern B, with major axis alignment.
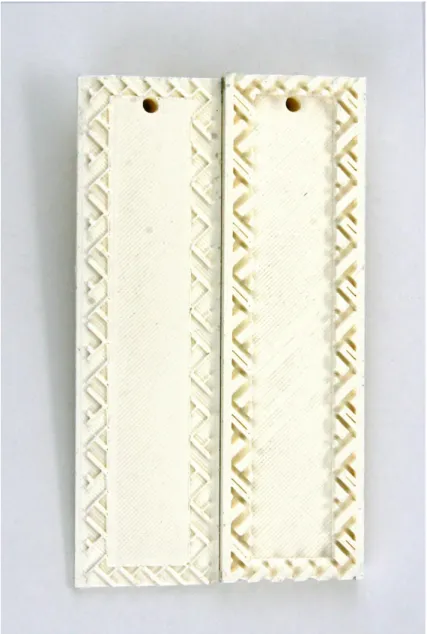
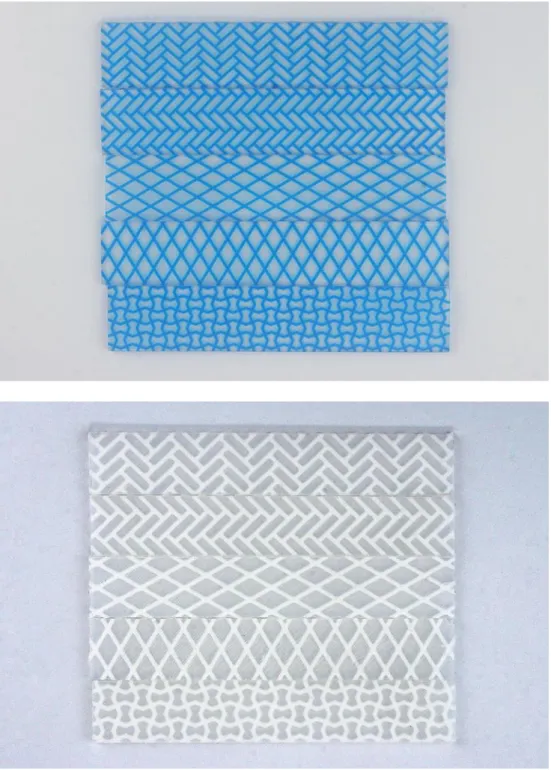
(D) Pattern B, with minor axis alignment. (E) Pattern C.··· 8 Figure 6. 3D printed specimen molder of pattern A, with major axis alignment.··· 10 Figure 7. Pattern-embedding specimens. (A) 3D printed pattern embedding specimens and (B)
silicon molded pattern embedding specimens. ··· 11 Figure 8. Components of stress in small volume. ··· 14 Figure 9. Typical stress-strain curve of carbon steel. (1) Ultimate strength (2) Yield strength
(3) Fracture (4) Strain hardening (5) Necking. ··· 14 Figure 10. Stress-strain curves of the basic materials. Mean stress-strain curve of (A) Agilus,
(B) VeroCyan, (C) Dragonskin 30, (D) TPU 94A, before yield.··· 18
Figure 11. Stress-strain curves of Agilus-VeroCyan specimens with 0.7 mm embedded pattern.
Mean stress-strain curve of (A) pattern A-major, (B) pattern A-minor, (C) pattern B- major, (D) pattern B-minor, (E) pattern C, before yield. ··· 19 Figure 12. Stress-strain curves of Dragonskin 30-TPU 94A specimens with 0.7 mm embedded
pattern. Mean stress-strain curve of (A) pattern A-major, (B) pattern A-minor, (C) pattern B-major, (D) pattern B-minor, (E) pattern C, before yield.··· 20 Figure 13. Stress-strain curves of Agilus-VeroCyan specimens with 1.4 mm embedded pattern.
Mean stress-strain curve of (A) pattern A-major, (B) pattern A-minor, (C) pattern B- major, (D) pattern B-minor, (E) pattern C, before yield. ··· 21 Figure 14. Stress-strain curves of Dragonskin 30-TPU 94A specimens with 1.4 mm embedded
pattern. Mean stress-strain curve of (A) pattern A-major, (B) pattern A-minor, (C) pattern B-major, (D) pattern B-minor, (E) pattern C, before yield.··· 22 Figure 15. Stress-strain curves of TPU 94A specimens with 0.7 mm pattern. Mean stress-strain
curve of (A) pattern A-major, (B) pattern A-minor, (C) pattern B-major, (D) pattern B-minor, (E) pattern C, before yield.··· 23 Figure 16. Stress-strain curves of TPU 94A specimens with 1.4 mm pattern. Mean stress-strain
curve of (A) pattern A-major, (B) pattern A-minor, (C) pattern B-major, (D) pattern B-minor, (E) pattern C, before yield.··· 24 Figure 17. Modulus of elasticity of Agilus-VeroCyan specimens with 0.7 mm embedded
pattern. (A) pattern A-major, (B) pattern A-minor, (C) pattern B-major, (D) pattern B- minor, (E) pattern C.··· 25 Figure 18. Modulus of elasticity of Dragonskin 30-TPU 94A specimens with 0.7 mm
embedded pattern. (A) pattern A-major, (B) pattern A-minor, (C) pattern B-major, (D) pattern B-minor, (E) pattern C.··· 26 Figure 19. Modulus of elasticity of Agilus-VeroCyan specimens with 1.4 mm embedded
pattern. (A) pattern A-major, (B) pattern A-minor, (C) pattern B-major, (D) pattern B- minor, (E) pattern C.··· 27 Figure 20. Modulus of elasticity of Dragonskin 30-TPU 94A specimens with 1.4 mm
embedded pattern. (A) pattern A-major, (B) pattern A-minor, (C) pattern B-major, (D) pattern B-minor, (E) pattern C.··· 28
Figure 21. Modulus of elasticity of TPU 94A specimens with 0.7 mm pattern. (A) pattern A- major, (B) pattern A-minor, (C) pattern B-major, (D) pattern B-minor, (E) pattern C.
··· 29 Figure 22. Modulus of elasticity of TPU 94A specimens with 1.4 mm pattern. (A) pattern A-
major, (B) pattern A-minor, (C) pattern B-major, (D) pattern B-minor, (E) pattern C.
··· 30
Introduction
Stereolithography apparatus method (SLA), the first recognized technology of 3D printing, was developed by Charles W. Hull in 1983 and patented in 1986. In 1989, the selective laser sintering method and fused deposition modeling method were patented by Carl R. Deckard and S. Scott Crump, respectively. 3D printing technology was introduced and used in the field alongside its development, and the industry's scope expanded significantly upon the expiration of most of the core patents in 2014.1-3There are various 3D printing methods. An SLA printer cures a resin using an ultraviolet laser, laminating it on a molding bed. The SLA method is as precise as the size of a laser dot, but it requires cleaning and post-printing curing. Similar to SLA, digital light processing (DLP) uses an Liquid Crystal Display (LCD) panel as a light source instead of a laser to cure the resin, and the output speed is fast since the cure one layer at a time. Selective laser sintering (SLS) is a method where powder (polymers, ceramics, or metals) is spread evenly on a bed and fused by laser to form a solid model. Since the powder supports the model, no supporter is separately generated. Fused deposition modeling (FDM) or fused filament fabrication (FFF) is a method where thermoplastics are melted and extruded through a hot nozzle. FDM and FFF are easy to use, with a simple apparatus, at low cost, and are widely applied due to the wide selection of materials. Furthermore, inkjet and polyjet methods, among others, have been developed.
3D printing technology started from a sample production and is now used in various fields such as aerospace, machinery, architecture, medical and fashion. Especially in the medical industry, it is applied diversely given its vast range, having printers and materials being developed to suit its specificity.4-6 The FDM method (most commonly used) is applied to surgical guides, implants, and scaffolds for cell culture using biocompatible materials.7-9A surgical guide is patient-specific, helping with surgery planning, surgery time, and minimal resection. Bio-printing technology is also being developed to printing materials to biocompatible silicone, collagen, or gelatin, or to stack bio-inks inside gelatin.6, 10For example, 3D printed titanium is used for implants such as hip joints and maxillas.11, 12In addition, 3D printing using materials with mechanical and chemical stability can produce customized surgical tools for doctors and surgeons.13, 14Since a reflection of a detailed anatomical structure is possible, as the model is produced based on medical images, 3D printing has also been
applied to the production of educational models, simulators and patient-specific phantoms.15-
17In particular, it is used for the development of medical imaging protocols and the verification of diagnostic methods, through flow experiments by outputting blood vessels or valve phantoms and creating an environment similar to the human body.18-20
However, the elasticity and elongation of the material may be insufficient when the functional movement and the load is large, such as the heart or the aorta. In this study, we identified the mechanical properties of several materials and attempted to mimic the mechanical properties of the aortic wall, using pattern design and 3D printing, in order to overcome material limitations and to implement a realistic simulation.
Materials and methods
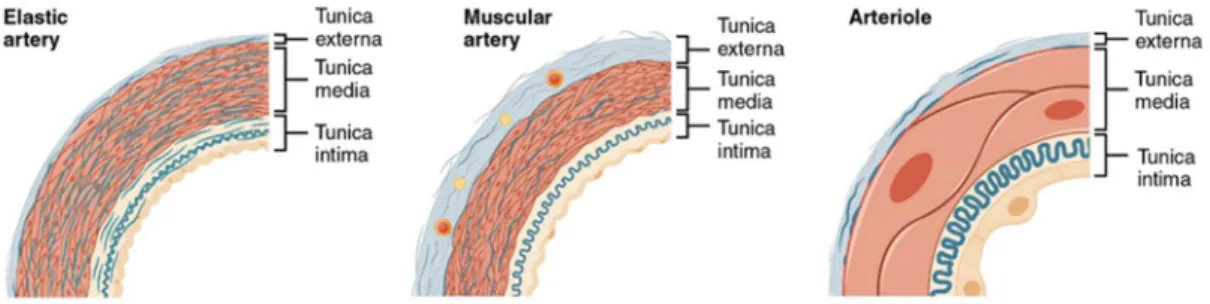
The aorta is divided into several parts according to well-known classification methods.21, 22 Anatomically, the aorta is divided into a thoracic aorta, extending from the heart to the diaphragm, and a ventral aorta from the diaphragm to the aortic bifurcation. Depending on the direction of blood flow, the aorta can be divided into an ascending aorta from the left ventricle to the aortic arch, and a descending aorta, which is the later part. The descending aorta includes the thoracic aorta and the abdominal aorta. The aorta serves as a regulator of the pressure and flow throughout the cardiovascular system, through its mechanical properties as well as the blood vessel functions. The aorta is largely classified into the adventitia, the media, and the intima, and consists of smooth muscle tissue, collagen fibers, and elastic lamina (Figure 1). In many studies, the mechanical behavior of arteries has been described through phases, as shown in Figure 2: (1) In low deformation, the elastic lamina supports the load, (2) the collagen fiber divides the load as the deformation increases, and (3) in high deformation, the collagen fiber supports the load and breaks when the yield point exceeds.23, 24 The tensile strength of normal arteries, defined in previous studies, was 2.0 to 3.0 MPa, and the strain at break was 2.0 to 2.5 mm/mm.
Figure 1. Types of arteries and arterioles. Comparison of the walls of an elastic artery, a muscular artery, and an arteriole.25
Figure 2. Typical stress-strain curve for a soft biological tissue in uniaxial tension at constant elongation rate.26 ( ≥ 2.0 , ≥ 2.0 / )
The crucial part towards mimicking the mechanical properties of arteries was to simulate the elastic plate and collagen fibers that distribute the load according to deformation change. In this study, the elastic plate and the collagen fiber were replaced by a 3D printed material with low hardness and high hardness respectively. In arterial tissue, collagen fibers are irregularly twisted and lined up with increasing strain in order to support the load. We tried to imitate this by using a pattern, such as a lattice shape, for the high hardness material. In several studies, the stress-strain curve of the arteries varied in slope (modulus of elasticity) within each part.23,
24, 27, 28Herein we evaluated whether the tensile test results of the pattern-embedded specimens reflect those characteristics and whether the tensile strength is within the range of the known artery's tensile strength.
1. Basic material tensile test
Research on the mechanical properties of 3D printed materials is ongoing. In other study, poly- lactic acid (PLA) specimens were produced at an angle using an entry-level printer, and the tensile test result returned values of 58 MPa at 0°, 64 and 54 MPa at 45° and 90°, respectively.29 An ABS tensile test study experimented with different thickness and printing directions, and found an optimum result of 30.6 MPa at 0.3 mm thickness in axial output.30Another study analyzed the effect of output angle and temperature using a medical TPU.31The optimized specimen in this study had a tensile strength of 46.7 MPa and a fracture strain of 702%.
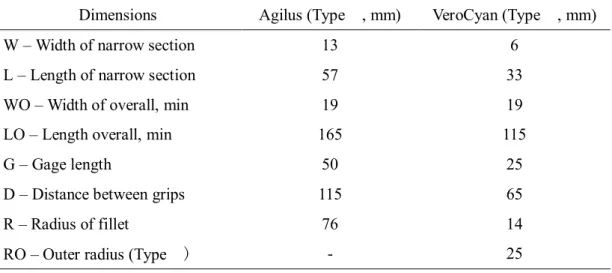
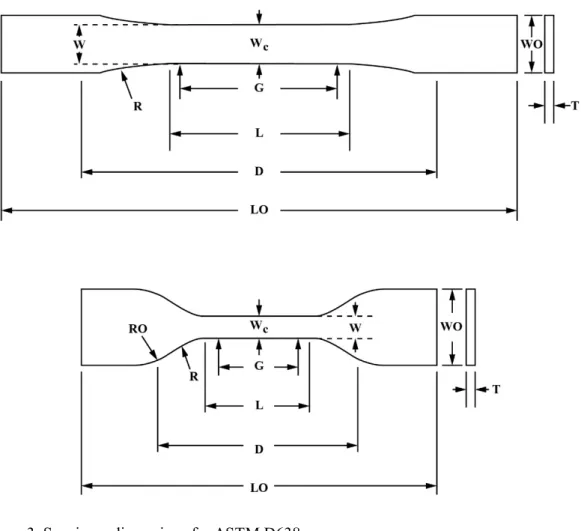
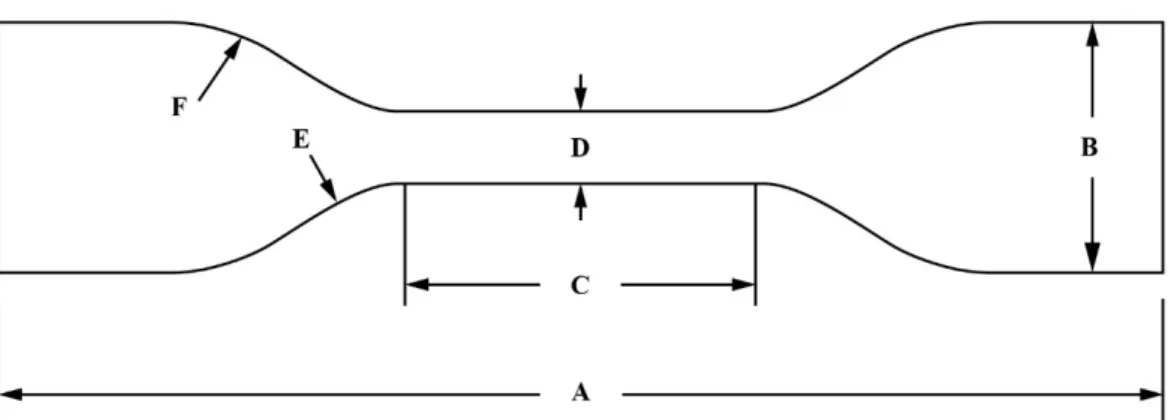
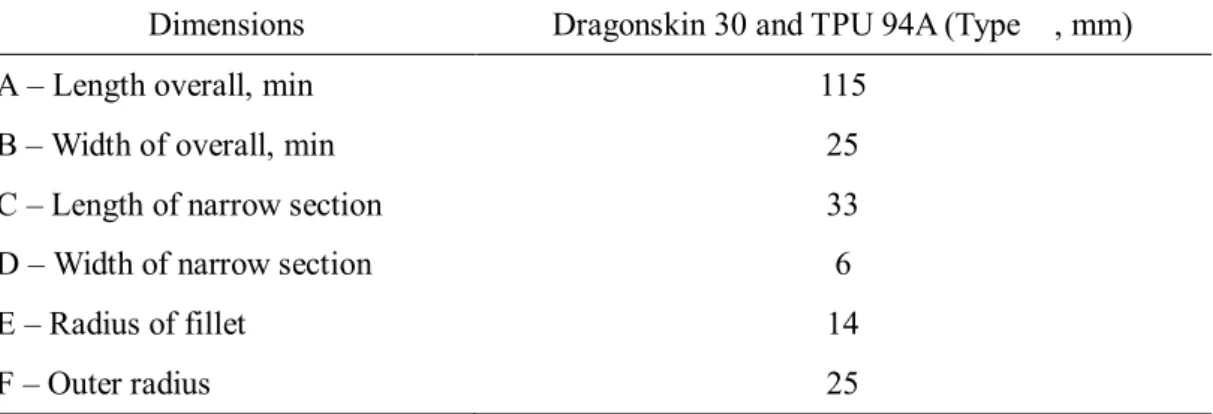
Herein, tensile testing of materials to be used was conducted, in order to design a suitable pattern and specimen. Agilus of Objet500 connex3 (Stratasys, Ltd. USA) and Dragonskin 30 silicone were selected as a basic material, and VeroCyan of Objet500 connex3 and TPU 94A of Ultimaker3 (Ultimaker B.V., Netherlands) were selected as pattern materials. Agilus and VeroCyan were capable of being printed simultaneously, Dragonskin was used as a vascular phantom, and TPU 94A was a flexible material capable of stable production using FDM.32, 33 Agilus and VeroCyan were tested according to ASTM D638 Standard Test Method for Tensile Properties of Plastics, with a specimen thickness of 3 mm. Dragonskin 30 and TPU 94A were tested according to ASTM D412 Standard Test Methods for Vulcanized Rubber and Thermoplastic Elastomers Tension, with a specimen thickness of 2.5 mm. The detailed values of the specimens are shown in Figure 3 and Table 2 for ASTM D638 and in Figure 4 and Table
3 for ASTM D412.
Tensile tests were carried out by pulling five specimens for each material at a rate of 50 mm/s.
Tensile tests were conducted using ST-1001 (SALT CO, Ltd. Korea) equipment, and results are shown as stress-strain curves.
2. Patterns and specimens design
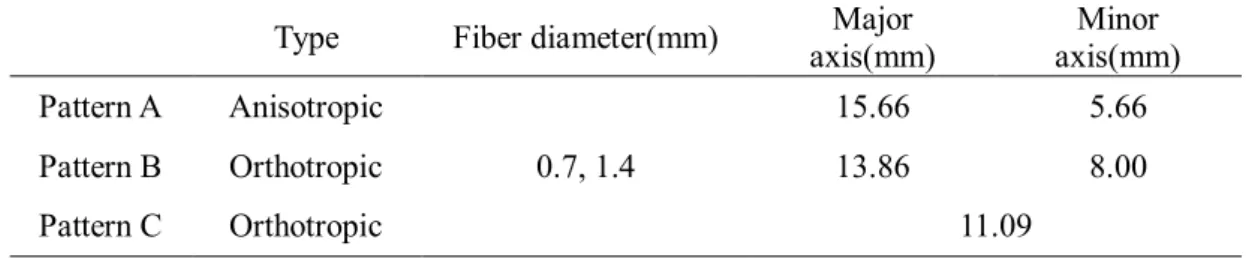
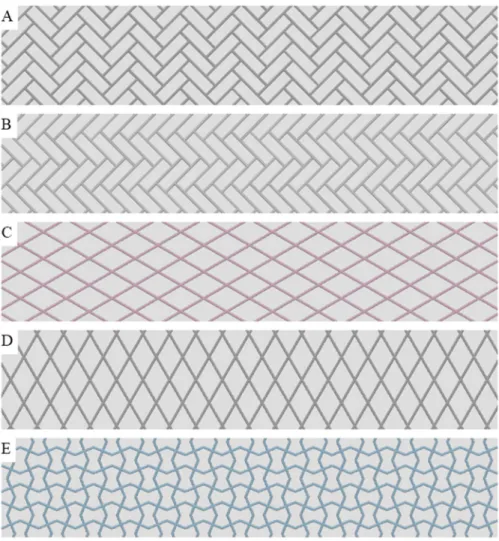
Based on the tensile test results of the basic material, one 2D anisotropic pattern (pattern A) and two orthotropic patterns (pattern B and C) were designed. The pattern fiber was designed using diameters of 0.7 mm and 1.4 mm, and the major axis length was within 15 mm. The minor axis length varied from pattern to pattern and was within 8 mm (Table 1). The specimen was designed by embedding the designed pattern inside a rectangular box. Anisotropic patterns were embedded in the specimen by matching the tensile direction, major axis, and minor axis respectively. Orthotropic patterns were planted in the specimen without distinction between major and minor axis (Figure 5). Considering the difference in tensile strength and strain of the basic material, the Agilus-VeroCyan specimens were designed with a box size of 150 x 30 mm and a thickness of 3 mm, and the Dragonskin 30-TPU 94A specimens were designed with a box size of 115 x 25 mm and a thickness of 2.5 mm.
Table 1. The detailed description of the pattern design.
Type Fiber diameter(mm) Major
axis(mm)
Minor axis(mm) Pattern A Anisotropic
0.7, 1.4
15.66 5.66
Pattern B Orthotropic 13.86 8.00
Pattern C Orthotropic 11.09
Figure 3. Specimen dimensions for ASTM D638.
Table 2. Specimen dimensions for ASTM D638.
Dimensions Agilus (Type , mm) VeroCyan (Type , mm)
W – Width of narrow section 13 6
L – Length of narrow section 57 33
WO – Width of overall, min 19 19
LO – Length overall, min 165 115
G – Gage length 50 25
D – Distance between grips 115 65
R – Radius of fillet 76 14
RO – Outer radius (Type ) - 25
Figure 4. Specimen dimensions for ASTM D412.
Table 3. Specimen dimensions for ASTM D412.
Dimensions Dragonskin 30 and TPU 94A (Type , mm)
A – Length overall, min 115
B – Width of overall, min 25
C – Length of narrow section 33
D – Width of narrow section 6
E – Radius of fillet 14
F – Outer radius 25
Figure 5. 3D models of pattern-embedded specimens. (A) Pattern A, with major axis alignment.
(B) Pattern A, with minor axis alignment. (C) Pattern B, with major axis alignment. (D) Pattern B, with minor axis alignment. (E) Pattern C.
3. Pattern embedding specimen tensile test
The designed specimens were 3D printed and molded, and a tensile test was performed. With the Objet500 connex3 capable of multi-material printing, Agilus (box) and VeroCyan (pattern) were printed simultaneously. The print direction was perpendicular to the tensile direction, and all specimens were produced in the same direction. Five Agilus-VeroCyan specimens were printed for each pattern. The TPU 94A pattern was printed by the Ultimaker3 for the Dragonskin 30-TPU 94A specimen. The mold was designed to center the pattern in the Dragonskin 30 silicone molding. Molders of all patterns were printed by the Ultimaker 3 using PLA (Figure 6). Parts A and B of the Dragonskin 30 were placed in a syringe, and air bubbles were removed from the vacuum chamber. After placing the pattern on the mold and sealing it, the Dragonskin 30 silicone was filled using a two-component silicone gun. Then it was cured for one day, at room temperature. Similarly, five Dragonskin 30-TPU 94A specimens were produced. The Agilus-VeroCyan and the Dragonskin 30-TPU 94A specimens are shown in Figure 7.
To examine the pattern's effect, a pattern was printed on the TPU 94A, and a tensile test was performed. Five TPU 94A pattern specimens were printed for each examined pattern (five patterns) and thickness (two examined values, 0.7 mm, 1.4 mm) using Ultimaker3. Each specimen was pulled at a speed of 50 mm/s, and a tensile test was performed using an ST-1001 apparatus, with results shown as a stress-strain curve.
Figure 6. 3D printed specimen molder of pattern A, with major axis alignment.
Figure 7. Pattern-embedding specimens. (A) 3D printed pattern embedding specimens and (B) silicon molded pattern embedding specimens.
4. Evaluation
In mechanical engineering it is essential to define material properties. Towards this goal, specimens of different specifications are defined according to material characteristics, and through tests such as tensile, compression, and bending. The measured values (stress and strain) lead to a stress-strain curve, which is carefully analyzed. The stress, also called measure of force intensity, is generated inside the object by the force applied from the outside. Depending on how the force acts on the object, it can be divided into surface or body force, with stress corresponding to surface force. An example of a body force is weight due to gravity. The stress ( ) can be defined as the surface force per unit area acting on the micro area inside the object, as shown in Equation (1):
∆ →lim
∆
∆ = (1)
where is the force acting inside the object, is the area inside the object, and vectors represent both. When the moment becomes 0 for the micro area, it can be expressed as Equation (2), and this is called the Cauchy stress principle.
∆ →lim
∆
∆ = 0 (2)
Equations (1) and (2) consider only one face of the object, and for accurate calculation, it is necessary to obtain the micro area surrounding the microvolume. As shown in Figure 8, all stress vectors acting on a micro-volume defined by a cube can be expressed by nine components, and are generally represented by a matrix called a stress tensor ( ), as shown in Equation (3).
= (3)
When the moment equilibrium is achieved as shown in Equation (2) in Eulerian coordinates, can be expressed as shown in Equation (4), and this is called the Cauchy stress tensor.
= (4)
Strain is the geometric deformation of an object caused by stress and is expressed as shown in Equation (5):
= (5)
where is the amount of deformation (usually in the longitudinal direction), and is the original length of the object.
Figure 9 shows the stress-strain curve of a standard structural steel. The linear section up to the point before the second tensile strength point is called “elastic section” and the slope is called “the modulus of elasticity (E)”. After yielding, plastic deformation occurs without stress change in a certain section, then the material hardens, and when degeneration occurs, stress increases nonlinearly. After passing the ultimate strength, the material is destroyed. By calculating the area under the stress-strain curve, the amount of work (energy) in the material can be defined.
In this study, the tensile strength of the basic materials (Agilus, VeroCyan, Dragonskin 30, and TPU 94A) and the tensile test results of the specimens with pattern embedded were analyzed.
Since the time axis was not the same in the tensile test result data for each test, the average and standard deviation values were obtained after polynomial fitting. The order of the polynomial fitting was unified in the fourth order, and the average and standard deviation of R-square and root-mean-square error (RMSE) of each tensile test fitting are shown in Tables 4, 5, and 6.
Among the five tensile test results for each pattern-embedded specimen, the average of tensile strength and fracture strain was compared with the known aortic tensile strength and fracture strain value (2.0~3.0 MPa, 2.0~2.3 mm/mm, defined elsewhere). Referring to the previous study, the slope of the fitted polynomial was obtained to find the elastic modulus and the inflection point.24Matlab R2015a was used to analyze result and produce graphs.
Figure 8. Components of stress in small volume34.
Figure 9. Typical stress-strain curve of carbon steel. (1) Ultimate strength (2) Yield strength (3) Fracture (4) Strain hardening (5) Necking35.
Table 4. Mean and standard deviation of R-square and RMSE in polynomial fitting of tensile test of basic materials.
Materials R-square RMSE
Agilus 0.9999 ± 0 0.0127 ± 0.0008
VeroCyan 0.9957 ± 0.0008 0.0019 ± 0.0002
Dragonskin 30 0.9999 ± 0.0001 0.0044 ± 0.0031
TPU 94A 0.9962 ± 0.0007 0.5998 ± 0.1136
Table 5. Mean and standard deviation of R-square and RMSE in polynomial fitting of tensile test of pattern-embedding specimens.
Materials Diameter
(mm) Pattern type R-square RMSE
Agilus- VeroCyan
0.7
A major 0.9996 ± 0.0004 0.0034 ± 0.0021 A minor 0.9947 ± 0.0034 0.0094 ± 0.0030 B major 0.9984 ± 0.0021 0.0075 ± 0.0047 B minor 0.9988 ± 0.0005 0.0064 ± 0.0012
C 0.9998 ± 0.0001 0.0023 ± 0.0006
Dragonskin 30- TPU 94A
A major 0.9997 ± 0.0004 0.0049 ± 0.0013
A minor 0.9999 ± 0 0.0035 ± 0.0004
B major 0.9995 ± 0.0004 0.0082 ± 0.0029 B minor 0.9996 ± 0.0004 0.0062 ± 0.0028
C 0.9995 ± 0.0002 0.0075 ± 0.0020
Agilus- VeroCyan
1.4
A major 0.9999 ± 0.0001 0.0034 ± 0.0013 A minor 0.9998 ± 0.0001 0.0043 ± 0.0003 B major 0.9998 ± 0.0002 0.0101 ± 0.0059 B minor 0.9993 ± 0.0011 0.0034 ± 0.0035
C 0.9998 ± 0.0002 0.0094 ± 0.0023
Dragonskin 30- TPU 94A
A major 0.9995 ± 0.0002 0.0105 ± 0.0030 A minor 0.9998 ± 0.0002 0.0049 ± 0.0022 B major 0.9998 ± 0.0001 0.0060 ± 0.0014 B minor 0.9990 ± 0.0007 0.0101 ± 0.0045
C 0.9986 ± 0.0010 0.0178 ± 0.0059
Table 6. Mean and standard deviation of R-square and RMSE in polynomial fitting of tensile test of TPU 94A patterns.
Diameter
(mm) Pattern type R-square RMSE
0.7
A major 0.9983 ± 0.0004 0.0476 ± 0.0001
A minor 0.9994 ± 0.0001 0.0216 ± 0.0048
B major 0.9974 ± 0.0004 0.0661 ± 0.0018
B minor 0.9992 ± 0.0001 0.0281 ± 0.0010
C 0.9986 ± 0.0002 0.0613 ± 0.0032
1.4
A major 0.9987 ± 0.0001 0.0373 ± 0.0011
A minor 0.9999 ± 0 0.0084 ± 0.0005
B major 0.9983 ± 0.0001 0.0631 ± 0.0036
B minor 0.9969 ± 0.0004 0.0556 ± 0.0048
C 0.9978 ± 0.0003 0.0799 ± 0.0051
Results
The average tensile strength and standard deviation of Agilus, VeroCyan, Dragonskin 30, and TPU 94A were 1.00 ± 0.05 MPa, 34.08 ± 3.31 MPa, 2.03 ± 0.17 MPa, and 36.71 ± 3.85 MPa, respectively. The average strains and standard deviations for each material were 3.96 ± 0.12 mm/mm, 0.38 ± 0.08 mm/mm, 5.82 ± 0.46 mm/mm, and 9.55 ± 1.25 mm/mm, for Agilus, VeroCyan, Dragonskin 30, and TPU 94A respectively. The stress-strain curves these four materials are shown in Figure 10.
The stress-strain curves of Agilus-VeroCyan specimens and Dragonskin 30-TPU 94A, specimens with a pattern diameter of 0.7 mm for each pattern, are shown in Figures 11 and 12, respectively. The stress-strain curves of Agilus-VeroCyan specimens and Dragonskin 30-TPU 94A specimens, with a pattern diameter of 1.4 mm for each pattern, are shown in Figures 13 and 14, respectively. The stress-strain curves of TPU 94A for each pattern are shown in Figures 15 and 16. The average tensile strength, strain, elastic modulus, and inflection point of all specimens, for each pattern, are summarized in Table 7. The elastic modulus graphs for each tensile test are shown in Figures 17, 18, 19, 20, 21, and 22.
Table 7. Mean yield stress and strain at break, with standard deviation, modulus of elasticity and inflection points of each pattern design.
Materials Diameter
(mm) Pattern type Mean yield stress (MPa)
Strain at break (mm/mm)
Modulus of elasticity
(MPa) Inflection point (mm/mm)
Min Max
Agilus-VeroCyan
0.7
A major 0.64 ± 0.03 0.83 ± 0.52 0.73 1.33 0.13, 0.49
A minor 0.50 ± 0.01 1.29 ± 0.04 0.14 0.78 0.08, 0.84
B major 0.79 ± 0.05 0.60 ± 0.22 0.19 4.23 0.05, 0.31
B minor 0.59 ± 0.01 1.50 ± 0.05 0.25 0.57 0.29, 0.85
C 0.63 ± 0.04 0.76 ± 0.16 2.63 3.87 -
Dragonskin 30-TPU 94A
A major 1.40 ± 0.09 4.20 ± 0.45 0.18 0.39 -
A minor 1.27 ± 0.10 3.78 ± 0.26 0.18 0.35 -
B major 1.45 ± 0.11 3.85 ± 0.38 0.18 0.52 -
B minor 1.29 ± 0.08 3.04 ± 0.30 0.20 0.33 1.61
C 1.03 ± 0.06 3.17 ± 0.31 0.22 0.56 1.22, 1.97
Agilus-VeroCyan
1.4
A major 1.19 ± 0.07 0.50 ± 0.10 2.51 3.74 0.01
A minor 1.09 ± 0.07 0.39 ± 0.08 2.98 10.14 0.16
B major 2.88 ± 0.18 0.32 ± 0.06 6.14 13.86 0.06
B minor 0.62 ± 0.02 0.74 ± 0.05 0.75 2.06 -
C 2.15 ± 0.12 0.27 ± 0.03 8.03 23.12 0.02
Dragonskin 30-TPU 94A
A major 1.54 ± 0.12 2.70 ± 0.34 0.38 0.89 0.25, 1.96
A minor 1.40 ± 0.06 2.90 ± 0.23 0.36 0.81 -
B major 1.85 ± 0.08 2.58 ± 0.12 0.28 2.22 1.40, 1.72
B minor 1.09 ± 0.10 2.49 ± 0.22 0.34 0.55 0.11, 1.41
C 2.15 ± 0.15 3.18 ± 0.05 0.09 2.15 1.43, 2.28
Figure 10. Stress-strain curves of the basic materials. Mean stress-strain curve of (A) Agilus, (B) VeroCyan, (C) Dragonskin 30, (D) TPU 94A, before yield.
Figure 11. Stress-strain curves of Agilus-VeroCyan specimens with 0.7 mm embedded pattern.
Mean stress-strain curve of (A) pattern A-major, (B) pattern A-minor, (C) pattern B-major, (D) pattern B-minor, (E) pattern C, before yield.
Figure 12. Stress-strain curves of Dragonskin 30-TPU 94A specimens with 0.7 mm embedded pattern. Mean stress-strain curve of (A) pattern A-major, (B) pattern A-minor, (C) pattern B- major, (D) pattern B-minor, (E) pattern C, before yield.
Figure 13. Stress-strain curves of Agilus-VeroCyan specimens with 1.4 mm embedded pattern.
Mean stress-strain curve of (A) pattern A-major, (B) pattern A-minor, (C) pattern B-major, (D) pattern B-minor, (E) pattern C, before yield.
Figure 14. Stress-strain curves of Dragonskin 30-TPU 94A specimens with 1.4 mm embedded pattern. Mean stress-strain curve of (A) pattern A-major, (B) pattern A-minor, (C) pattern B- major, (D) pattern B-minor, (E) pattern C, before yield.
Figure 15. Stress-strain curves of TPU 94A specimens with 0.7 mm pattern. Mean stress-strain curve of (A) pattern A-major, (B) pattern A-minor, (C) pattern B-major, (D) pattern B-minor, (E) pattern C, before yield.
Figure 16. Stress-strain curves of TPU 94A specimens with 1.4 mm pattern. Mean stress-strain curve of (A) pattern A-major, (B) pattern A-minor, (C) pattern B-major, (D) pattern B-minor, (E) pattern C, before yield.
Figure 17. Modulus of elasticity of Agilus-VeroCyan specimens with 0.7 mm embedded pattern. (A) pattern A-major, (B) pattern A-minor, (C) pattern B-major, (D) pattern B-minor, (E) pattern C.
Figure 18. Modulus of elasticity of Dragonskin 30-TPU 94A specimens with 0.7 mm embedded pattern. (A) pattern A-major, (B) pattern A-minor, (C) pattern B-major, (D) pattern B-minor, (E) pattern C.
Figure 19. Modulus of elasticity of Agilus-VeroCyan specimens with 1.4 mm embedded pattern. (A) pattern A-major, (B) pattern A-minor, (C) pattern B-major, (D) pattern B-minor, (E) pattern C.
Figure 20. Modulus of elasticity of Dragonskin 30-TPU 94A specimens with 1.4 mm embedded pattern. (A) pattern A-major, (B) pattern A-minor, (C) pattern B-major, (D) pattern B-minor, (E) pattern C.
Figure 21. Modulus of elasticity of TPU 94A specimens with 0.7 mm pattern. (A) pattern A- major, (B) pattern A-minor, (C) pattern B-major, (D) pattern B-minor, (E) pattern C.
Figure 22. Modulus of elasticity of TPU 94A specimens with 1.4 mm pattern. (A) pattern A- major, (B) pattern A-minor, (C) pattern B-major, (D) pattern B-minor, (E) pattern C.
Discussion
In this study, the tensile strength, strain at break, and modulus of elasticity of the combined specimens of Agilus-VeroCyan and Dragonskin 30-TPU 94A with embedded pattern were compared to the mechanical properties of the aortic wall.
The specimen of Dragonskin 30-TPU 94A combination, met the standard set for strain at break, but had insufficient tensile strength. The specimen of Agilus-VeroCyan combination had lower strain at break than the Dragonskin 30-TPU 94A combination for all examined patterns.
Increasing the diameter of the pattern increases the tensile strength and the stiffness, but reduces the strain at break. Results obtained herein differed from the actual aorta with regards to the mechanical properties. However, rupture was considered a top priority when these materials were considered for applications in the human body, so increased tensile strength was considered sufficient.
The modulus of elasticity between two inflection points showed an increasing pattern from the 0.7 mm thick Agilus-VeroCyan A-major specimen, to the same B-minor specimen, followed by the 1.4 mm thick Dragonskin 30-TPU 94A B-minor specimen. Although none of these patterns met the tensile strength criterion, the 1.4 mm Dragonskin 30-TPU 94A B-minor met the strain at break criterion, but the elastic modulus change was not significant. In some patterns there were no inflection points. It was presumed that the difference in elastic modulus across the basic materials is small, or one side's influence is too significant. The stress-strain curve and elastic modulus graph of TPU 94A, confirmed that the mechanical properties of a single material did not change significantly, even upon a pattern change. Although there was a difference for tensile strength and strain measured for each pattern, there was no significant difference in graph shape. Although the criteria for mechanical properties were satisfied for the C pattern, since the actual aorta has a strain rate of about 3 to 8% in the systole, it is possible to realize aortic behavior if only the elastic modulus properties are satisfied.36, 37
In another study, an effort to emulate the mechanical properties of human tissues was done, by planting TangoPlus as a basic material, with VeroBlackPlus as an embedded pattern in sinusoidal and double helix form.38, 39Although the inherent difference in mechanical behavior between the soft tissue and the polymer could be narrowed, polymer did not show a wide range of application, unlike human tissue under complex load. Herein, we tried to overcome this
limitation by combining two-dimensional patterns with two different materials. In particular, we confirmed the possibility of realizing the difference in tensile strength between the circumferential direction and the longitudinal direction in aortic tissue as a pattern.
The mechanical properties of TangoPlus, a flexible 3D printer material, were shown to be better than polydimethylsiloxane (PDMS), commonly applied to vascular phantoms, by comparing the two materials through a uniaxial tensile test.17 Another study showed that TangoPlus was a suitable material for an aneurysm phantom model, through confirming its ability to swell by changing the internal pressure of a descending aorta printed with it.16Both Agilus and Dragonskin 30 (materials examined in our study) showed higher tensile strength and strain at break than TangoPlus (Figure 10). TPU 90A had the best tensile strength and strain at break among the examined materials, but the hardness and stiffness were too high to allow an aorta to be constructed solely from one of these materials. The results of the TPU 94A pattern tensile test met the criteria for the aortic mechanical properties, however, a membrane would be required in order to contain the fluid, for this material to be used as a phantom. Gore-Tex, which is widely used for artificial vascular grafts, had different mechanical properties from the aorta. It showed a tensile strength of 14.03 ± 0.72 MPa at a strain of 27.8% and an elastic modulus of 31.61 ± 4.76 MPa.40, 41Although it is not likely to rupture in the human body and is used because of its high biocompatibility, Gore-Tex is not suitable for real aorta phantom simulations.
Despite the positive results obtained, there were some limitations to this study. Firstly, since the specimens with embedded pattern had a pattern inserted, it was impossible to perform the tensile test according to the existing tensile test specimen specifications exactly. The process followed the ASTM D638 and D412 standards, except from the construction of the specimen with embedded pattern. In order to obtain a more accurate correlation between the material and the pattern, design and verification of the test method suitable for the specimen with embedded pattern should be preceded. Furthermore, since the actual aorta is cylindrical, the tensile test results of plate-shaped specimens were only approximations of the cylindrical mechanical properties.
Although the criterion for tensile strength and strain at break of the aorta could be met, there were differences in the characteristics of tensile strength and modulus of elasticity depending
on the strain. Since there is only one pattern that satisfies the criteria, it is necessary to find a material with a different combination of materials or different properties. In the case of imitation of other tissues, research is needed to develop new patterns that can match the mechanical behavior of particular tissues. Last but not least, the flow phantom or artificial aorta is expected to be subjected to repeated loads, depending on the heart rate, so a study of to the fatigue limit is necessary.
Conclusion
In this study, we proposed a method to imitate the mechanical characteristics of the aortic wall, using two materials with different physical properties and embedded pattern instead of single 3D printing materials. We managed to imitate the tensile strength and strain of the aorta, and we identified the possibility of implementing a more realistic simulator phantom. There is potential to be applied to other human tissue imitations. To this end, further research is needed, especially towards securing diversity of materials and redesigning patterns, as well as establishing and verifying tensile test methods for specimens with embedded pattern.
References
1. Hull CW, inventors; 3D Systems, Inc., assignee. Apparatus for making three- dimensional objects by stereolithography US patent 04575330. 08.08, 1986.
2. Deckard CR, Beaman JJ, inventors; Board Of Regents, The University Of Texas System, assignee. Selective laser sintering with assisted powder handling US patent 5053090. 10.01, 1991.
3. Crump SS, inventors; Steven Scott Crump, Stratasys, Inc., assignee. Apparatus and method for creating three-dimensional objects. US patent 5344298. 06.09, 1992.
4. Rengier F, Mehndiratta A, von Tengg-Kobligk H, et al. 3D printing based on imaging data: review of medical applications. International journal of computer assisted radiology and surgery. 2010;5(4):335-341.
5. Kim GB, Lee S, Kim H, et al. Three-dimensional printing: basic principles and applications in medicine and radiology. Korean journal of radiology. 2016;17(2):182- 197.
6. Kyle S, Jessop ZM, Al-Sabah A, Whitaker IS. ‘Printability' of Candidate Biomaterials for Extrusion Based 3D Printing: State-of-the-Art. Advanced Healthcare Materials.
2017/08/01 2017;6(16):1700264.
7. Ma J, Lin L, Zuo Y, et al. Modification of 3D printed PCL scaffolds by PVAc and HA to enhance cytocompatibility and osteogenesis. RSC Advances. 01/01 2019;9:5338- 5346.
8. Kang S, Kwon J, Ahn CJ, et al. Generation of customized orbital implant templates using 3-dimensional printing for orbital wall reconstruction. Eye. 2018/08/28 2018.
9. Honigmann P, Sharma N, Okolo B, Popp U, Msallem B, Thieringer FM. Patient- Specific Surgical Implants Made of 3D Printed PEEK: Material, Technology, and Scope of Surgical Application. Biomed Res Int. 2018:8.
10. Murphy SV, Atala A. 3D bioprinting of tissues and organs. Nat Biotechnol. 2014;32.
11. Dekker TJ, Steele JR, Federer AE, Hamid KS, Adams SB. Use of Patient-Specific 3D- Printed Titanium Implants for Complex Foot and Ankle Limb Salvage, Deformity Correction, and Arthrodesis Procedures. Foot & Ankle International. 2018/08/01 2018;39(8):916-921.
12. Park E-K, Lim J-Y, Yun I-S, et al. Cranioplasty Enhanced by Three-Dimensional Printing: Custom-Made Three-Dimensional-Printed Titanium Implants for Skull Defects. Journal of Craniofacial Surgery. 2016;27(4).
13. George M, Aroom KR, Hawes HG, Gill BS, Love J. 3D Printed Surgical Instruments:
The Design and Fabrication Process. World Journal of Surgery. 2017/01/01 2017;41(1):314-319.
14. Rankin TM, Giovinco NA, Cucher DJ, Watts G, Hurwitz B, Armstrong DG. Three- dimensional printing surgical instruments: are we there yet? Journal of Surgical Research. 2014/06/15/ 2014;189(2):193-197.
15. Burfeindt MJ, Colgan TJ, Mays RO, et al. MRI-Derived 3-D-Printed Breast Phantom for Microwave Breast Imaging Validation. IEEE Antennas and Wireless Propagation Letters. 2012;11:1610-1613.
16. Biglino G, Verschueren P, Zegels R, Taylor AM, Schievano S. Rapid prototyping compliant arterial phantoms for in-vitro studies and device testing. Journal of
Cardiovascular Magnetic Resonance. 2013/01/16 2013;15(1):2.
17. Cloonan AJ, Shahmirzadi D, Li RX, Doyle BJ, Konofagou EE, McGloughlin TM. 3D- Printed Tissue-Mimicking Phantoms for Medical Imaging and Computational Validation Applications. 3D Printing and Additive Manufacturing. 2014/03/01 2014;1(1):14-23.
18. Vukicevic M, Mosadegh B, Min JK, Little SH. Cardiac 3D Printing and its Future Directions. JACC: Cardiovascular Imaging. 2017/02/01/ 2017;10(2):171-184.
19. Maragiannis D, Jackson Matthew S, Igo Stephen R, et al. Replicating Patient-Specific Severe Aortic Valve Stenosis With Functional 3D Modeling. Circulation:
Cardiovascular Imaging. 2015/10/01 2015;8(10):e003626.
20. Medero R, García-Rodríguez S, François CJ, Roldán-Alzate A. Patient-specific in vitro models for hemodynamic analysis of congenital heart disease – Additive manufacturing approach. Journal of Biomechanics. 2017/03/21/ 2017;54:111-116.
21. Hole JW, Koos K. Human Anatomy. second edition ed: Wm. C. Brown; 1994.
22. De Graaf V. Human Anatomy. fifth edition ed: McGraw-Hill; 1998.
23. Sokolis DP, Kefaloyannis EM, Kouloukoussa M, Marinos E, Boudoulas H, Karayannacos PE. A structural basis for the aortic stress–strain relation in uniaxial tension. Journal of Biomechanics. 2006/01/01/ 2006;39(9):1651-1662.
24. García-Herrera CM, Atienza JM, Rojo FJ, et al. Mechanical behaviour and rupture of normal and pathological human ascending aortic wall. Medical & Biological Engineering & Computing. 2012/06/01 2012;50(6):559-566.
25. Birritta G. Effects of Pathologic Aortic Velocity Profiles on Coronary Arteries Hemodynamics: Ingegneria Biomedica, Politecnico di Torino; 2018.
26. Sauren AAHJ, van Hout MC, van Steenhoven AA, Veldpaus FE, Janssen JD. The mechanical properties of porcine aortic valve tissues. Journal of Biomechanics.
1983/01/01/ 1983;16(5):327-337.
27. Sequential Enzymolysis of Human Aorta and Resultant Stress-Strain Behavior.
Biomaterials, Medical Devices, and Artificial Organs. 1977/01/01 1977;5(2):121-145.
28. Claes E, Atienza JM, Guinea GV, et al. Mechanical properties of human coronary arteries. Paper presented at: 2010 Annual International Conference of the IEEE
Engineering in Medicine and Biology; 31 Aug.-4 Sept. 2010, 2010.
29. Letcher T, Waytashek M. Material Property Testing of 3D-Printed Specimen in PLA on an Entry-Level 3D Printer. 2014.
30. Dwiyati ST, Kholil A, Riyadi R, Putra SE. Influence of layer thickness and 3D printing direction on tensile properties of ABS material. Journal of Physics: Conference Series.
2019/12 2019;1402:066014.
31. Xiao J, Gao Y. The manufacture of 3D printing of medical grade TPU. Progress in Additive Manufacturing. 2017/09/01 2017;2(3):117-123.
32. O'Reilly MK, Reese S, Herlihy T, et al. Fabrication and assessment of 3D printed anatomical models of the lower limb for anatomical teaching and femoral vessel access training in medicine. Anatomical Sciences Education. 2016/01/01 2016;9(1):71-79.
33. McKinley S, Garg A, Sen S, et al. A single-use haptic palpation probe for locating subcutaneous blood vessels in robot-assisted minimally invasive surgery. Paper presented at: 2015 IEEE International Conference on Automation Science and Engineering (CASE); 24-28 Aug. 2015, 2015.
34. Sanpaz. Components stress tensor cartesian. wikipedia. Available at:
https://upload.wikimedia.org/wikipedia/commons/thumb/b/b3/Components_stress_te nsor_cartesian.svg/1024px-Components_stress_tensor_cartesian.svg.png. Accessed 12 March, 2009.
35. Toiyabe. Stress vs. Strain curve for structural steel. Available at:
https://upload.wikimedia.org/wikipedia/commons/0/00/Stress_v_strain_A36_2.png.
Accessed 7 December, 2005.
36. DART A, SILAGY C, DEWAR E, JENNINGS G, McNEIL J. Aortic distensibility and left ventricular structure and function in isolated systolic hypertension. European Heart Journal. 1993;14(11):1465-1470.
37. de Heer LM, Budde RPJ, Mali WPTM, de Vos AM, van Herwerden LA, Kluin J.
Aortic root dimension changes during systole and diastole: evaluation with ECG-gated multidetector row computed tomography. Int J Cardiovasc Imaging. 2011;27(8):1195- 1204.
38. Wang K, Zhao Y, Chang Y-H, et al. Controlling the mechanical behavior of dual- material 3D printed meta-materials for patient-specific tissue-mimicking phantoms.
Materials & Design. 11/01 2015;90.
39. Wang K, Wu C, Qian Z, Zhang C, Wang B, Vannan MA. Dual-material 3D printed metamaterials with tunable mechanical properties for patient-specific tissue- mimicking phantoms. Additive Manufacturing. 2016/10/01/ 2016;12:31-37.
40. Isaka M, Nishibe T, Okuda Y, et al. Experimental study on stability of a high-porosity expanded polytetrafluoroethylene graft in dogs. Annals of thoracic and cardiovascular surgery : official journal of the Association of Thoracic and Cardiovascular Surgeons of Asia. 03/01 2006;12:37-41.
41. Mun CH, Jung Y, Kim S-H, et al. Three-Dimensional Electrospun Poly(Lactide-Co-ɛ- Caprolactone) for Small-Diameter Vascular Grafts. Tissue engineering Part A. 04/01 2012;18:1608-1616.
국문요약
3D 프린팅 기술은 의료 전반에 걸쳐 사용이 확대되고 있다. 의료용 디지털 영상(Digital Imaging and Communications in Medicine, DICOM)을 기반으로 정확한 해부학적 구조를 반영하여 환자 맞춤형 가이드, 시뮬레이터, 보형물, 수술도구, 교육용 팬텀 등 다양한 어 플리케이션이 개발되고 있다. 정해진 규격으로 대량 생산되어 공급되는 기존의 방식 대 비, 3D 프린팅 기술은 개인 맞춤형,소량 생산을 기반으로 의료기기를 제조, 공급하게 되며 의사와 환자 간 의사소통이나 공정 간소화, 수술 시간 단축 등에 이점이 있다. 하
지만3D 프린팅 기술은 재료나 소재의 다양성, 긴 출력 시간, 정확성 등 여러 한계점을
가지고 있다. 특히 시뮬레이터나 교육용 팬텀 제작에 있어 해부학적 구조를 조직의 특 성화 함께 모방하기에는 재료의 한계점이 뚜렷하다. 본 연구에서는3D프린팅 의료기 술의 재료의 한계를 극복하며 적용의 지평을 넓히기 위해서 복합 재료와 패턴 임베딩 을 통해 대동맥벽의 기계적 특성을 모방하고자 하였다.
동맥은 혈관의 기능만이 아니라 기계적 특성을 통해 심혈관 전체의 압력과 흐름을 조 절하는 역할을 한다. 많은 연구에서 동맥의 기계적 거동을 다음과 같이 여러 부분으로 나누어 설명했다. (1)낮은 변형에서 탄력판이 하중을 지지하고 (2)변형이 커질수록 콜 라겐 섬유가 하중을 나누어 받다가, (3)높은 변형에서 콜라겐 섬유가 하중을 지지하고 항복점을 넘어서면 파열이 일어난다.
Objet500 connex3 장비의 Agilus 와 Dragonskin 30 실리콘이 기본 재료로, Objet500 connex3 장비의VeroCyan과Ultimaker3 장비의TPU 94A가 패턴 재료로 선택되었고 각 각 인장시험이 수행되었다. 이 데이터를 토대로 2D anisotropic 패턴 1 개(pattern A), orthotropic 패턴 2개(pattern B and C)가 설계되었다. 설계된 패턴을 박스 내부에 심어
(embedding) 시편이 설계되었고 기본 재료의 인장 강도와 변형률 차이를 고려하여
Agilus-VeroCyan 시편의 박스 크기는150 x 30 mm, 두께는3 mm이며, Dragonskin 30- TPU 94A 시편의 박스 크기는115 x 25 mm, 두께는2.5 mm로 설계되었다. Anisotropic 패 턴은 인장 방향과 장축, 단축을 각각 일치시켜 시편에 심어졌다. Orthotropic 패턴은 장, 단축 구분 없이 시편에 심어졌다. 설계된 시편을 토대로 인장시험이 수행되었다.
모든Agilus-VeroCyan 시편은 한 번에 출력되었고Dragonskin 30-TPU 94A 시편은 출력
된TPU 94A 패턴을 몰더 가운데 고정시키고 실리콘 몰딩하여 제작되었다. 그리고 패턴
의 영향을 확인하기 위해TPU 94A를 재료로 두께마다 각 패턴이 출력되어 인장시험이 수행되었다. 인장시험 결과에서 다항식 피팅 후 평균과 표준 편차가 도출되었다. 다항
식 피팅의 차수는 4차로 통일시켰고R-square의 전체 평균 및 표준 편차는 0.9988 ±
0.0011 이었다. 패턴 임베딩 시편5 개의 인장시험 결과 중 인장강도, 파단 변형률의 평
균이 알려진 대동맥의 인장강도와 파단 변형률과 비교되었다. (2.0~3.0 MPa, 2.0 ~2.3 mm/mm) 앞선 연구를 참고하여 피팅된 다항식의 기울기를 구하여 탄성계수를 구하고 변곡점을 찾았다. 결과 분석 및 그래프 작성에는Matlab R2015a가 사용되었다.
Agilus의 평균 인장강도 및 표준편차는1.00 ± 0.05 MPa, VeroCyan의 평균 인장강도 및 표준편차는34.08 ± 3.31 MPa, Dragonskin 30과TPU 94A은 각각2.03 ± 0.17 MPa, 36.71
± 3.85 MPa 였다. 그리고 재료 별 파단 변형률 평균과 표준편차는Agilus, VeroCyan, Dragonskin 30, TPU 94A 순서대로 각각3.96 ± 0.12 mm/mm, 0.38 ± 0.08 mm/mm, 5.82 ± 0.46 mm/mm, 9.55 ± 1.25 mm/mm였다. Dragonskin 30-TPU 94A 조합은 파단 변형률이 기준을 만족했지만 인장강도가 다소 모자랐다. Agilus-VeroCyan 조합은 모든 패턴에서 Dragonskin 30-TPU 94A 조합보다 파단 변형률이 낮았다. 인장강도의 경우 패턴의 직경 을 증가시키면 함께 증가하지만 파단 변형률이 감소하며 강성이 증가했다. 실제 대동 맥의 기계적 특성과 다소 다르지만 인체에 적용할 때는 파열되지 않는 것이 최우선으 로 고려된다.연구용 팬텀이 아닌 인체 삽입을 목적으로 할 경우에는 인장강도를 증가 시키는 것으로 충분하다.
변곡점이 두 개이면서 그 간에 탄성계수가 증가하는 패턴은0.7 mm Agilus-VeroCyan A- major, B-minor, 1.4 mm Dragonskin 30-TPU 94A B-minor였다. 이 중 인장강도 기준을 만 족하는 패턴은 없었고1.4 mm Dragonskin 30-TPU 94A B-minor 이 파단 변형률 기준을 만족했지만 탄성계수 변화량이 크지는 않았다. 일부 패턴에서는 변곡점이 없었다. TPU
94A의stress-strain curve와 탄성계수 그래프에서 단일재료의 기계적 특성은 패턴 변화
를 주어도 크게 바뀌지 않는 것이 확인 가능했다. 패턴마다 인장강도나 변형률에 차이 는 보였지만 그래프 형태에는 큰 차이를 보이지 않았다. C 패턴을 제외하면 기계적 특 성의 기준을 만족하지 못했지만, 실제 대동맥이 수축기에서 약3 ~ 8 %의 변형률을 갖 기 때문에 탄성계수 특성만 만족시키면 대동맥 거동 구현이 가능할 것이다.
본 연구에서는 단일3D 프린팅 재료 대신, 다른 물성을 지닌 두 재료와 패턴 임베딩을 이용하여 대동맥벽의 기계적 특성을 모방하는 방법을 제시했다. 대동맥의 인장강도와 변형률을 모사할 수 있었으며 보다 사실적인 시뮬레이터 팬텀 구현 가능성을 확인했다.
다른 인체조직 모방에도 적용할 수 있는 잠재력이 있으며, 이를 위해서는 재료의 다양 성 확보와 패턴 재설계, 패턴 임베딩 시편의 인장시험 방법 정립 및 검증 등의 추가 연
구가 필요하다.