한국황해-동북해, 지구화학적 근사, 퇴적기원, 기여정량. 황해와 북동중국해의 S2S(Source-to-Sink) 퇴적물 정량화.
Introduction
However, several studies have suggested that the marine sediments (especially the central and southeastern coastal areas of the Yellow Sea) consist of a mixture of Korean (KR) and Chinese river sediments (e.g. Yang et al., 2003a) Lim et al and references therein. This proposal has created a new paradigm in the study of sediment origin in the Yellow Sea and highlights its importance.
Quantification reconstruction of Holocene sediment source variations
Research background
Furthermore, recent findings reveal more complicated source origins, as can be seen from the central Yellow Sea region (e.g. Zhao et al. Applying the preliminary work of Lim et al. 2006), we propose an approach alternative to YECS Sediment source quantification based on the advanced Al-Mg regression model, with the aim of increasing the effectiveness of its application.
Materials and methods
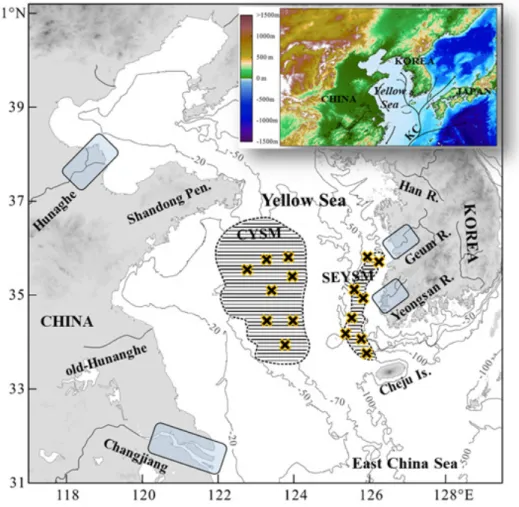
The age of YSDP102 sediments was determined from a well-constructed chronostratigraphic framework for the SEYSM deposit; Several stratigraphic studies, along with the age data from the accelerator mass spectrometer 14C, also revealed that the YSDP102 deposit accumulated over 7.0–3.5 ka (e.g., Park et al., 2000; Lee et al., 2014) , with a sedimentation rate of 14.9 years. mm/yr. Meanwhile, age models of two short cores (E619 and YS21) collected near the YSDP102 drilling site were reconstructed based on an average sedimentation rate (3.9 mm/yr, Park et al., 2000), measured using the total 210Pb activities of the centers in this area.
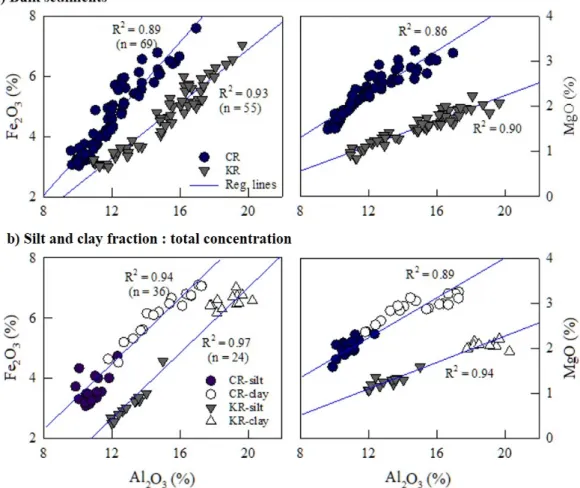
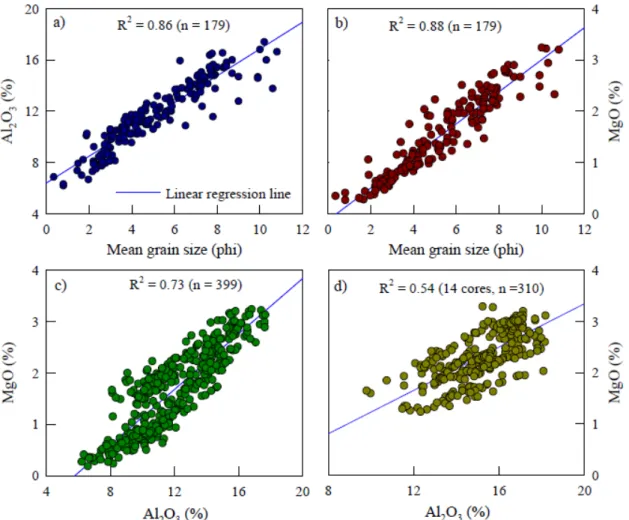
Al-Mg regression analysis for sediment fingerprinting and source apportionment
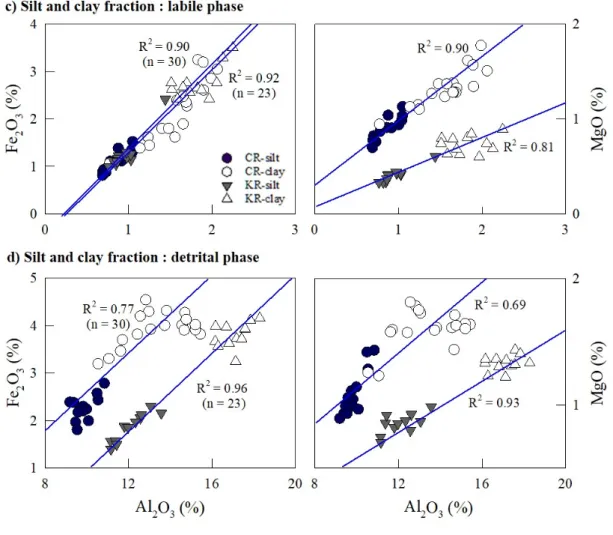
The alkaline earth elements (Mg, Ba and Sr) have also been proposed as a potential proxy for the origin of sand sediments in the YECSs (Kim et al., 1999). Specifically, for this analysis, the value of the (x, y) coordinate of the intersection of the two regression lines was transformed to the origin (0, 0), since the two lines were not parallel (Fig. 4a, see Lim et al. ., 2006 for more details);
Contemporary spatial sediment source-to-sink quantification
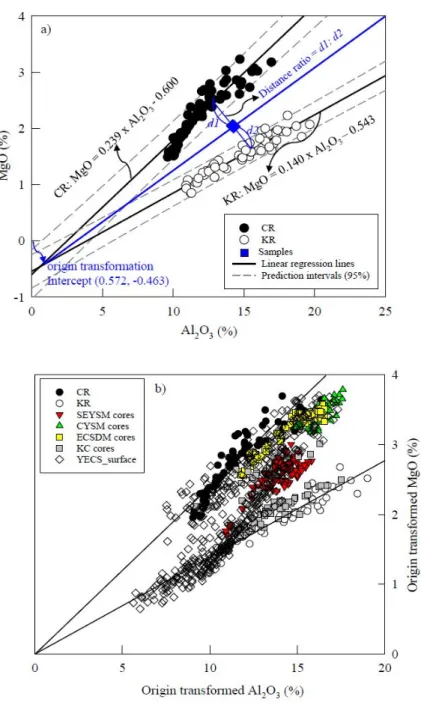
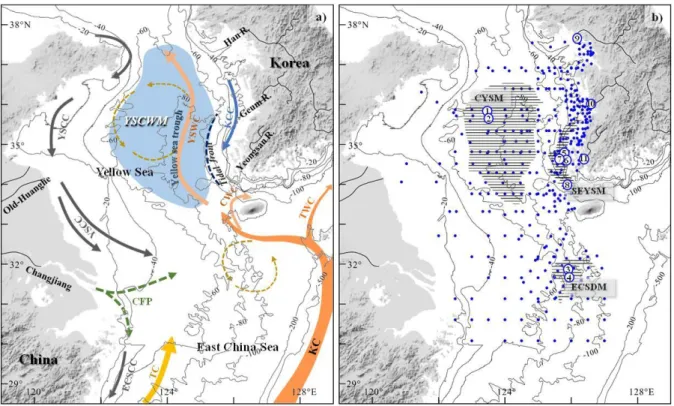
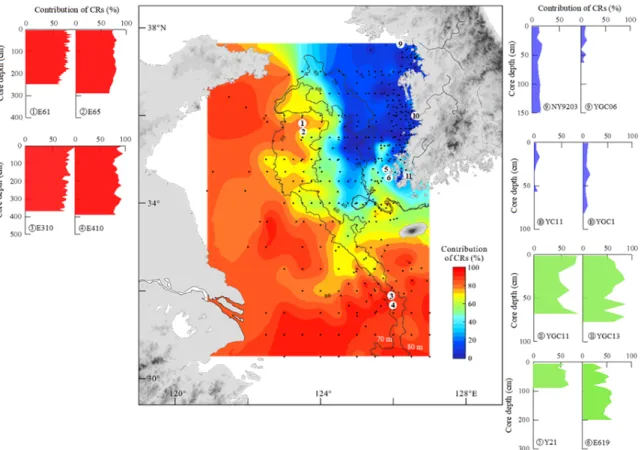
Note the sharp drop in the CR contribution at about 124°E, indicating a limit to the CR sediment transports to the eastern part of the Yellow Sea. In this regard, the dominance of the CR source in the southeastern Yellow Sea Mud (SEYSM) deposit along the southwestern Korean coasts, with its sharp contrast to the adjacent region, is noteworthy (Fig. 5). Our estimates clearly show a significant supply of the CR sediments (∼50%) to the southwestern Korean coastal region.
Cross-sectional distributions of the CR source contribution in the middle (cross-section1) and southern part (cross-section 2) of the Yellow Sea, and the northern East China Sea (cross-section 3). This means that additional sediment supplies to the SEYSM deposit still account for half of the total budget ton/yr) to be further explained. In particular, the additional sediment supply can be obtained from quantitative estimates of the CR sediment contribution to the Korean coastal mud deposit; the CR sediment contribution to the SEYSM is estimated on average to be ~50% (Vygeton/yr), which in effect compensates for the gap in the total sediment budget.
Oceanographic-climatic forcings on the Holocene sediment source variations
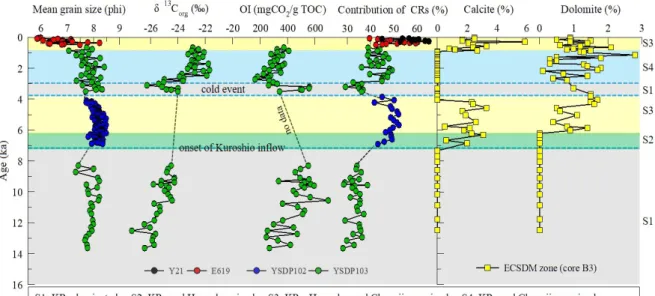
Downcore variations of average grain size, carbon isotope ratio (δ13Corg), oxygen index (OI) and quantitative contribution of the CRs in the SEYSM deposit over the last 15 kyr and comparison with records of calcite-dolomite content (Hu et al., 2014) in The ECSDM repository. A sudden and very distinct increase in the CR source contribution since ∼7 ka may be induced by an intrusion of the YSWC into the study area, resulting in a significant CR sediment supply to the Korean coastal zone. What also becomes clear is that this event corresponds to the time that initiates a supply of fine-grained Changjiang sediments to the northern ECS by the southwestern YSCC in winter and/or the northeastern Changjiang dilute water (CDW) in summer (Yang et al., 1992; Zhang, 1999; Lie et al., 2003; Liu et al., 2007; Yuan et al., 2008; Zhang et al., 2019) as well as a transport of
These perspectives further justify the late Holocene neoglacial cold event (i.e., minimum Pulleniatina event, ~5–3 ka) documented in the marginal seas of the northwest Pacific (e.g., ECS and Okinawa Trough, Kim and Lim , 2014 and references therein; Lim et al., 2017; Xu et al., 2019), led by the suppression of the Kuroshio system (Jian et al., 2000; Xiang et al., 2007). During this interval, the high aeolian dust flux in the YECS indicates another climate response, such as an intensification of the East Asian winter monsoon (Lim et al., 2005; Lim and Matsumoto, 2008). This assumption gains further support from a recent finding that offshore erosion in the paleo-Huanghe Delta produces more than 790 Mt/yr of sediment, and almost half of the sediment load is transported from southeast to south of Cheju Island in the ECS. northern (Zhou et. al., 2014).
Conclusions
Meanwhile, the later period (after ~1 ka) is an interesting case; the maximum contribution of the CR source to the SEYSM and ECSDM deposits with a sudden increase in the Huanghe sediment supply (Fig. 7) is synchronous with intensive human interventions around the Changjiang and Huanghe basins. Notably, the correlation of Mg with Al exhibits different linear regression trends for the KR and CR sediment groups, enabling source zones to be more clearly differentiated in the YECS. This approach involves effective normalization of bulk content to account for grain-size differences in sediment geochemistry, which would enable clearer sediment source discrimination in the YECS.
Quantitative estimates have shown that the proportion of CR sediments in the SEYSM ranges from 30 to 40% and that of KR sediments can be as high as 50%. In terms of its application to historical sedimentary deposits of the YECS sediments over the past 15 kyr, our fingerprint-derived provenance changes show a clear sedimentation trend over the course of the Holocene, characterized by a large increase in CR contribution since then. Subsequently, the strong spatiotemporal coherence in the YECS sediment source quantifications validates our approach, potentially benefiting from more robust constraints on sediment source-to-well studies in a variety of contexts and applications.
REE fractionation and sediment source quantificaition
Fractionation distribution characteristics of REE partitioning
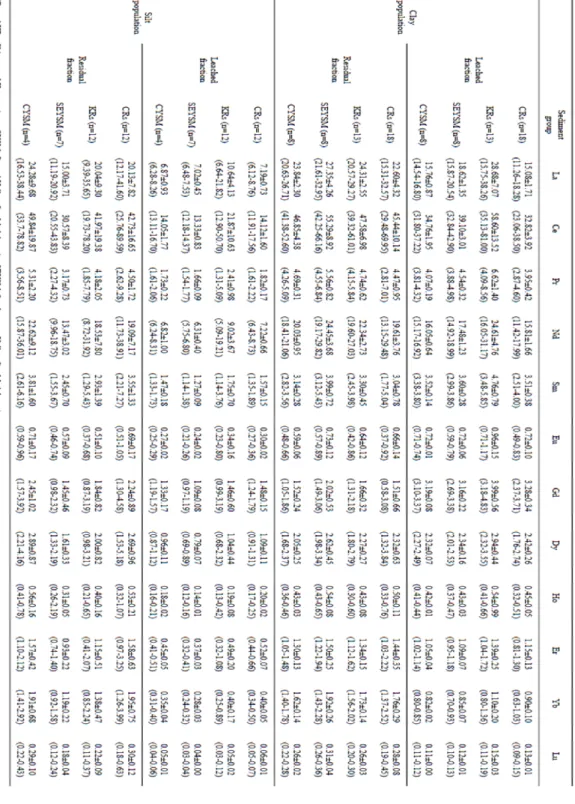
Acid-leachable REEs were slightly higher in the KR sediments and in the clay population. Such a prominent mid-REE enrichment signature in the leached fraction of CR and KR sediments may be associated with Fe-oxide minerals (e.g., Fe oxyhydroxide, ferrihydrite, lepidocrocite, and goethite) with minor fractions of apatite and carbonate (Palmer, 1895; Yang et al., 2002; Song and Choi, 2009; Zhang and Gao, 2015). Additionally, light SREE values in the leached fractions of the silt and clay populations varied systematically among the sediment groups in this study; values were highest in KR sediments, followed by SEYSM, CYSM and CR sediments (Figure 2).
In the remaining fraction of the clay population, fractionation distribution patterns of the SREEs are characterized by slight enrichment of light and medium REEs (La to Dy), except for Gd with the lowest value, and Yb and Lu with the highest values (Fig. 2) . The light and medium SREE enrichments in the remaining fractions were much higher in the KR sediments than in the CR sediments, which may be due to the difference in bulk mineralogical compositions of source rocks of the KR (mostly granites) and CR sediments (In the total fraction of both the silt and clay populations, general SREE fractionation distribution patterns were similar to (although flatter than) that of the leached fraction (Fig. 2).
New source discrimination model using REE fractionation distribution
This was due to dilution caused by the significant amount of the leached fraction (Table 1). As a result, the slope value for SREECR-n fractionation distribution pattern may be a more effective proxy to distinguish CR sediments from CR sediments in the Yellow Sea. Meanwhile, the slope values for CYSM and SEYSM sediments in the SREECR-n fractionation distribution fell between those of CR and KR sediments.
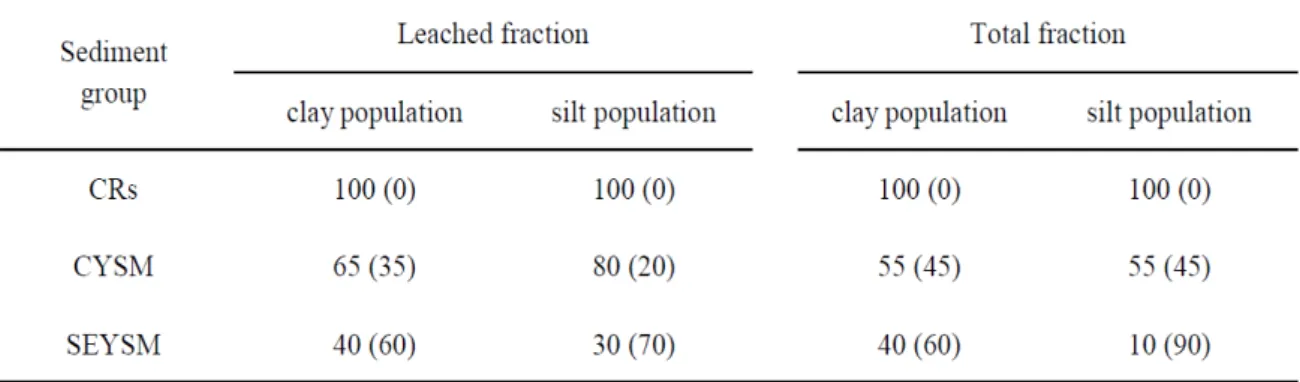
All relative mixing ratios of CR and KR sediments in the CYSM and SEYSM deposits are presented in Table 2. The CR contribution to CYSM was lower in the total fractions (55% in both the silt and clay populations) than in the leached fraction (80) % and 65% in silt and clay populations respectively), probably due to the small difference in distribution patterns of the residual fraction (Fig. 4). Especially in the leached fraction, CR contributions to CYSM were higher in the silt fraction (80%) than in the clay (65%), but the contributions to SEYSM were slightly higher in the clay (40%) than the silt fraction (30%) .
![Figure 3. Fractionation distribution patterns of CR-normalized SREEs (SREE CR-n , [SREE/SREE CR ]) values for the clay (a) and silt (b) populations of KRs and shelf mud sediments](https://thumb-ap.123doks.com/thumbv2/123dokinfo/10432824.0/49.892.135.750.223.815/figure-fractionation-distribution-patterns-normalized-srees-populations-sediments.webp)
Conclusions
Quantitative contribution of CRs to the shelf mud deposits (SEYSM and CYSM) based on a new two-end-member REE mixing model presented in this study.
Summary
Sediment origin discrimination in the Yellow Sea and Northern East China Sea (YECS) has long been a topic of interest, but its quantification is still inconclusive. Our quantitative source estimates clearly show a significant supply of Chinese River (CR) sediments (~50%) to the southwestern Korean coastal area, and Korean River (KR) sediments (30-40%) to the Central Mud Deposit Yellow Sea. , ensuring a good balance between the sediment supply and the budget of the shelf deposit. Of particular note is an abrupt decrease in CR contributions around 124°E, indicating that the CR sediments do not directly reach the eastern part of the Yellow Sea, blocked by a strong physical boundary.
Quantitatively distinguishing the sediment sources of several unique Yellow Sea silt deposits has received considerable attention because they are active sediment depocenters that can elucidate fluvial sediment dispersal patterns and marine depositional systems. In particular, the acid-leached phase of the clay fraction may be a better material for the quantitative evaluation of river contributions in the Yellow Sea. Our results clarify the discrepancy between mud budget and fluvial discharge, especially in Korean coastal mud deposits, as well as the explanation of the source of mud deposits on the Yellow Sea shelves, which have been debated since the 1980s.
Discrimination of sediment provenance in the Yellow Sea: Secondary grain size effect and REE proxy. Geochemistry of alkaline earth elements (Mg, Ca, Sr, Ba) in the surface sediments of the Yellow Sea. Dynamic analysis of the mud belt formation in the Bohai, Yellow and East China Seas.
Development of late Quaternary mud deposits and recent sediment budget in the southeastern Yellow Sea. Interannual variation of the southern boundary in the cold water on the floor of the Yellow Sea and its causes. On the source and genesis of the mud in the central area of the southern Yellow Sea.
Appendix