2017 Utility Energy Efficiency Scorecard
Grace Relf, Brendon Baatz, and Seth Nowak June 2017
Report U1707
© American Council for an Energy-Efficient Economy 529 14th Street NW, Suite 600, Washington, DC 20045 Phone: (202) 507-4000 • Twitter: @ACEEEDC
Facebook.com/myACEEE • aceee.org
Contents
About the Authors ... iv
Acknowledgments ... v
Executive Summary ... vi
Introduction ... 1
Methodology ... 1
Selection of Utilities ... 1
Metrics and Scoring ... 4
Data Collection ... 6
Data Limitations ... 7
Overall Scoring Results ... 8
Category 1. Energy Efficiency Program Performance ... 13
Incremental Savings: Net Savings as a Percentage of Retail Sales ... 16
Spending as a Percentage of Total Revenue ... 18
Peak Demand Reduction as a Percentage of Total Peak Demand ... 20
Net Lifetime Savings as a Percentage of Total Sales ... 22
2015 Energy Savings Target Achievement ... 25
Category 2. Energy Efficiency Programs... 27
Program Diversity ... 29
Emerging Program Areas ... 32
Pilot Programs ... 35
Low-Income Programs ... 37
Advanced Metering Infrastructure ... 41
Utility Customer Data Access ... 43
Electric Vehicles ... 45
Category 3. Targets, Business Models, and Evaluation ... 46
2015 Energy Savings Targets ... 49
Future Savings Targets ... 51
Residential Rates: Customer Charges ... 54
Residential Rates: Time-of-Use Pricing ... 56
Utility Business Model ... 58
Evaluation, Measurement, and Verification... 60
Areas for Future Research ... 62
Cost-Effectiveness Results ... 62
Cumulative Energy Savings ... 62
Distribution System Efficiency ... 62
Electric Vehicles ... 63
Energy Efficiency in Resource Planning ... 63
Hard-to-Reach Sectors ... 63
Research and Development ... 64
Conclusion ... 64
References ... 65
Appendix A. Data Sources ... 68
Utility Regulatory Filings ... 68
Planning Documents ... 73
Personal Communications ... 77
Websites and Other Documents ... 79
Appendix B. Savings and Spending Data ... 82
Appendix C. Program Diversity Data ... 88
Appendix D. Emerging Areas Data ... 92
Appendix E. Pilot Programs ... 95 Appendix F. Electric Vehicle Data ... 97 Appendix G. Evaluation, Measurement, and Verification Data ... 99
About the Authors
Grace Relf conducts research and analysis on utility-sector energy efficiency policies.
Specifically, she focuses on programs and initiatives such as rate design and utility resource planning. Prior to joining ACEEE, Grace worked at Karbone Inc. as an energy and
environmental markets analyst and broker, focusing on carbon, emissions, and biofuel credit markets. Grace earned a master of public administration in environmental science and policy from Columbia University in 2015. She also holds an honors bachelor of science with distinction in energy and environmental policy and an honors bachelor of arts in French from the University of Delaware.
Brendon Baatz is the senior manager of the utilities program at ACEEE. Brendon’s research focuses on utility regulation, energy markets, utility resource planning, and utility-sector efficiency programs. Prior to joining ACEEE, Brendon worked for the Federal Energy Regulatory Commission, Maryland Public Service Commission, and Indiana Office of Utility Consumer Counselor. Brendon holds a master of public affairs in policy analysis from Indiana University and a bachelor of science in political science from Arizona State University.
Seth Nowak conducts analysis and writes about energy efficiency programs and policies in the electric and natural gas utility sector. Focus areas of his research include exemplary programs; best practices; and program evaluation, measurement, and verification. Seth earned a master of business administration from the Wisconsin School of Business and a master of public affairs from the La Follette School of Public Affairs at the University of Wisconsin.
Acknowledgments
The authors are grateful to all the individuals and organizations that contributed to the development of the 2017 Utility Energy Efficiency Scorecard. Over the course of nearly a year, we have benefited from the time and insights of many individuals, only some of whom we are able to list here. We are particularly grateful to the representatives of the utilities and program administrators scored in the report who helped with data collection and
clarifications.
This project was funded with internal ACEEE resources and a grant from the JPB Foundation.
Thanks also to the numerous ACEEE staff members who acted as project advisers and reviewed and commented on drafts: Steven Nadel, Neal Elliott, Naomi Baum, Maggie Molina, Therese Langer, Jennifer Amann, Annie Gilleo, Dave Ribiero, Dan York, Sara Hayes, Martin Kushler, Lauren Ross, Meegan Kelly, Siddiq Kahn, and Weston Berg. Thanks to the ACEEE staff who supported the production of the report and the related
communications, especially Wendy Koch, Patrick Kiker, Eric Schwass, and Maxine
Chikumbo. We are grateful to Fred Grossberg for developmental editing and managing the editorial process, and to Elise Marton, Sean O’Brien, and Roxanna Usher for copy editing.
In addition to the individuals who responded to our requests for data, we are also grateful to the many experts and stakeholders who reviewed our methodology and the draft report, or who in other ways contributed their expertise. External review and support do not imply affiliation or endorsement. In alphabetical order by organization, we would like to thank:
Brian Billing (AEP Ohio), Ken Woolcutt (Ameren Illinois), Tom Thompson (Ameren Missouri), Roger Krouse and Jim Wontor (Arizona Public Service), Dan Bakal (Ceres), Rebecca McNish (Commonwealth Edison), Hilary Forster (Consortium for Energy
Efficiency), Dian Grueneich (Dian Grueneich Consulting), Steve Baab and Miriam Goldberg (DNV GL), Michael Hubbard (Dominion), Daniel Maddox (Duke Energy), Dan Adler and Oliver Tully (Energy Foundation), Andy Hudson (Energy Trust of Oregon), Andrew Owens and Keith Wood (Entergy), Gentiana Darragjati, Erin Engstrom, and Christopher Plecs (Eversource Energy), Joe Zuschak and Eren Demiray (FirstEnergy), Molly Lunn (Illinois Department of Commerce and Economic Opportunity), Joe Loper (Itron), Natalie Mims and Lisa Schwartz (Lawrence Berkeley National Laboratory), David Jacot (Los Angeles
Department of Water and Power), Will Baker and Julia Friedman (Midwest Energy Efficiency Alliance), Melanie Coen (National Grid Massachusetts), Lara Ettenson (Natural Resources Defense Council), Mike Winka (New Jersey Board of Public Utilities), Samantha Caputo, Jim O’Reilly, and Elizabeth Titus (Northeast Energy Efficiency Partnerships), Charlie Grist (Northwest Power and Conservation Council), Allyson Burns and Jennifer Meissner (NYSERDA), Michael Stockard (Oncor Electric Delivery), Dan Elliott (Oregon Housing and Community Services), Chris Kato and Luke Nickerman (Pacific Gas and Electric), Peter Cleff (PPL Electric Utilities), Kenneth Esser (Public Service Electric & Gas), Richard Sedano (Regulatory Assistance Project), Jane Peters and Joe Van Clock (Research into Action), Rachel Gold (Rocky Mountain Institute), Nathan Morey (Salt River Project), Sheryl Shelton (South Carolina Gas & Electric), Mandy Mahoney (Southeast Energy Efficiency Alliance), Matthew Horowitz (Southern California Edison), Howard Geller (Southwest Energy Efficiency Partnership), Danielle Byrnett, Michael Li, and Johanna Zetterberg (US Department of Energy), and Brian Lambert and Missie Muth (We Energies).
Executive Summary
Energy efficiency plays a critical role in meeting the needs of electric customers throughout the United States. It is a low-cost, low-risk resource option that delivers high levels of customer satisfaction. Electric utilities play a critical role in delivering energy efficiency programs to customers. The 2017 Utility Energy Efficiency Scorecard ranks the 51 largest US electric utilities on utility-sector energy efficiency programs and policies in 2015. We developed metrics reflecting how utilities are performing in a range of utility-sector energy efficiency areas. The report covers 18 metrics and allocates 50 total possible points across three categories:
1. Energy efficiency program performance: 25 points 2. Program diversity and emerging areas: 15 points 3. Energy efficiency–related regulatory issues: 10 points
The 51 utilities presented in the Scorecard operate within various state and regulatory environments, which are strong drivers of high performance in utility-sector energy efficiency. In this context, the utilities face constraints in decision making as regulated entities. Our ranking assesses energy efficiency programs, policies, and performance within the framework of these state and regulatory environments. Utilities have opportunities to deliver energy efficiency savings to customers in every state and regulatory context.
S
CORESEversource Massachusetts (Eversource MA) and National Grid Massachusetts (NG MA) earned the most points overall with 45.5 out of 50. These top two performers excelled in all three categories and were nearly 10 points ahead of the next utility (Pacific Gas & Electric).
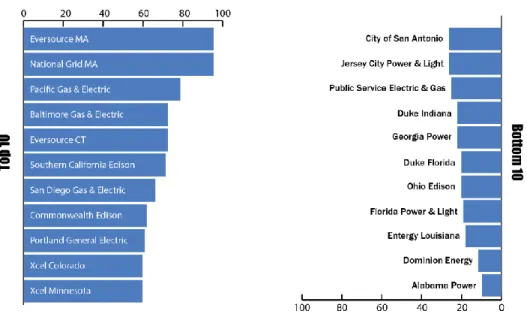
The top 10 utilities in the Scorecard come from 8 states, including 3 utilities from California, 2 from Massachusetts, and one each from Maryland, Connecticut, Illinois, Oregon, Colorado, and Minnesota. Figure ES1 shows the top and bottom 10 utilities in the report and the percentage of total available points they earned.
Figure ES1. Top and bottom 10 utilities and percentage of available points earned
On average, the group of 51 utilities earned 20.4 points, or just under 41% of the available 50. This indicates potential for growth in many areas of energy efficiency performance across the utility sector.
R
EGIONALR
ESULTSRegionally, utilities in the Northeast and West earned the highest average number of points.
Table ES1 shows how utilities in each region performed, on average, as well as the percentage of available points earned by the top and bottom utilities.1
Table ES1. Utility performance by region
Region Number of utilities
Total average %
of points achieved
% of points earned by
highest- ranked utility
% of points earned by
lowest- ranked
utility Top three utilities in the region (% of available points)
Mid-Atlantic 7 33% 69% 11% Baltimore Gas & Electric (69%), PPL (39%), PECO (37%)
Midwest 13 42% 59% 19% Commonwealth Edison (59%), Xcel MN
(57%), Ameren IL (53%)
Northeast 6 62% 91% 35% Eversource MA (91%), National Grid MA
(91%), Eversource CT (69%)
Southeast 10 25% 44% 9% Entergy AR (44%), Duke SC (35%), Duke
NC (34%)
Southwest 7 33% 48% 25% Arizona Public Service (48%), Salt River Project (44%), Centerpoint (30%)
West 8 57% 75% 42% Pacific Gas & Electric (75%), Southern
California Edison (68%), San Diego Gas
& Electric (63%)
C
ATEGORY1 R
ESULTSCategory 1 scores utilities on quantitative savings and spending performance by utilities in 2015. This is the most heavily weighted category, with half of the total possible points. We focused on quantitative metrics including
Net energy savings
Program spending
Peak demand reductions
Lifetime savings
Achievement of energy savings goals
1 The Mid-Atlantic includes utilities in MD, NJ, PA, and VA. The Midwest includes utilities in IA, IL, IN, MI, MN, MO, OH, OK, and WI. The Northeast includes utilities in CT, MA, and NY. The Southeast includes utilities in AL, AR, FL, GA, LA, NC, and SC. The Southwest includes utilities in AZ, NV, and TX. The West includes utilities in CA, CO, OR, UT, and WA.
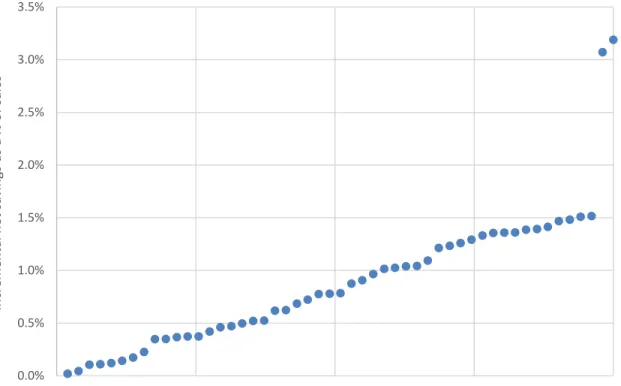
Net energy savings as a percentage of sales is the largest point metric in the Scorecard, with 8 available points (16% of total points). The two Massachusetts utilities received full points for this metric by achieving more than 3% incremental annual savings. Figure ES2 shows the distribution of utility savings as a percentage of sales.
Figure ES2. Distribution of incremental net savings as a % of retail sales in 2015. Each dot represents a utility’s 2015 performance.
As these results show, two utilities had savings higher than 3% of sales and another two had savings that surpassed 1.5% of sales. Twenty-two utilities had savings higher than 1% of sales in 2015. The average for all 51 utilities is 0.89%, and the median is similar at 0.78%.
The next metric, energy efficiency spending measured as a percentage of revenue, accounts for 14% of total points. The Massachusetts utilities outperformed the others in this metric as well, with program spending reaching more than 10% of utility revenue. The program spending of the next two utilities was more than 5.5% of utility revenue; on average, the figure was 2.7%.
C
ATEGORY2 R
ESULTSCategory 2 awards up to 15 points for several metrics related to program offerings:
Diversity of programs
Emerging programs
Pilot programs
Low-income offerings
Advanced metering penetration
Utility data access
Electric vehicles
0.0%
0.5%
1.0%
1.5%
2.0%
2.5%
3.0%
3.5%
Incremental net savings as a % of sales
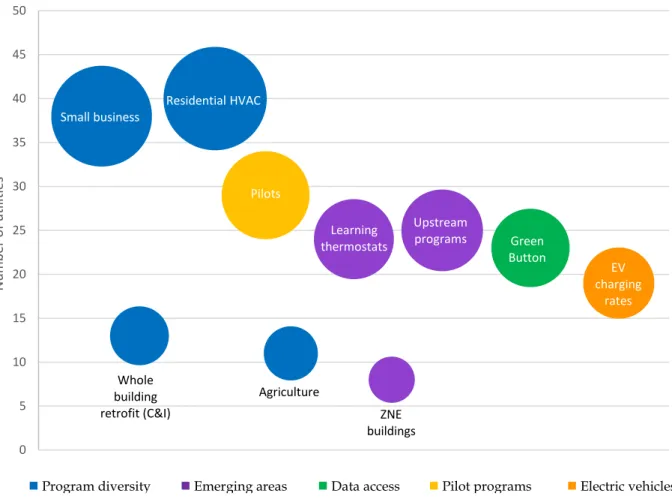
This category evaluates utility performance in areas that are critical to effective program delivery. The top 10 utilities in this category include 3 from California, where there is a strong emphasis on implementation of emerging program areas by utilities. This category revealed some of the most common programs and technologies being used in the utility sector in 2015. Figure ES3 shows the number of utilities implementing a selection of different programs and technologies from Category 2. The different colors of bubbles correspond to different metrics in the report. Some were much more common than others, such as residential heating, ventilation, and air-conditioning (HVAC) programs, offered by 40 utilities, while others were much less common, such as zero net energy (ZNE) building programs, offered by only eight utilities.
Figure ES3. Number of utilities implementing selected Category 2 programs in 2015
Program diversity and emerging areas are the most heavily weighted metrics in Category 2, with a combined total of 7 available points. Five utilities earned full points for program diversity, with 20 or more offerings. The most common programs include residential HVAC and industrial custom programs; among the least common are electric water heating
(residential) and agricultural programs (commercial and industrial).
Eight utilities offered eight or more of the selected emerging areas in 2015, thereby earning full points for the metric. Half of the utilities implemented upstream energy efficiency programs, while only two pursued residential geotargeting. Twenty-nine utilities offered one or more pilot program. Of these, the most common were behavior programs relying on
Small business
Whole building retrofit (C&I)
Residential HVAC
Agriculture
Learning thermostats
ZNE buildings
Upstream
programs Green Button Pilots
EV charging
rates
0 5 10 15 20 25 30 35 40 45 50
Number of utilities
Data access
Program diversity Emerging areas Pilot programs Electric vehicles
home energy reports. Five utilities earned full points for their low-income energy efficiency programs. These included two utilities from coastal states (CT and MA) and three from noncoastal states (OH, OK, and TX).
C
ATEGORY3 R
ESULTSCategory 3 scores utilities on several regulatory policies that promote energy efficiency. The metrics in this category rank utilities based on
Energy savings targets
Residential rate design
Utility business model approaches
Program evaluation practices
The policies and practices assessed in Category 3 create economic incentives for utilities to implement energy efficiency and strongly influence realized energy and demand savings.
Although the policies are ultimately approved by regulators, utilities have strong influence based on what they propose and support.
The Massachusetts utilities performed well in this category, primarily due to strong state policies and a supportive regulatory environment for energy efficiency. On average, utilities earned less than half of the total available points in Category 3, demonstrating weak
regulatory policy support for energy efficiency programs.
Establishing strong savings targets is critical to improving savings performance. The two Massachusetts utilities earned top points for energy savings targets in 2015 and beyond.
Both had 2015 energy savings targets of over 2.5% of retail sales, more than a full percentage point above the next-highest utilities. Forty-five of the 51 utilities had established energy savings targets for 2015. On average, utilities set targets of 0.77% of retail sales. While our data show that utilities are generally meeting established targets, results also indicate that higher savings are likely possible for many utilities.
Electric rate design is important because it can provide customers with price signals to conserve electricity and engage in energy efficiency programs. Utilities can improve price signals by keeping customer charges low and offering time-of-use rates. Our review of residential rate design shows an average residential customer charge of $8.65 per month and low participation in time-of-use rates.
Policies such as financial performance incentives and revenue decoupling can lead to greater savings levels and can help to counteract revenue lost from reduced energy sales.
Thirty-two of the 51 utilities we reviewed are eligible to earn financial performance
incentives, and 16 have full revenue decoupling. Only 11 have both revenue decoupling and performance incentives in place; seven of those utilities are in the top 10 overall.
E
FFECTIVES
TATEP
OLICIESThe results highlight the importance of strong state policies and regulatory support for high performance in utility-sector efficiency programs. Nine of the top 10 utilities in this report
are located in states that also break the top 10 in ACEEE’s 2016 State Energy Efficiency
Scorecard. The other two are in states within the top 15 in the State Scorecard. Policies in these states―such as energy efficiency resource standards (EERS) and financial opportunities for utilities to maintain and increase revenues while delivering efficiency―are important in driving performance.
C
ONCLUSIONAll the utilities in the top 10 show a clear commitment to energy efficiency, with high energy savings achievement and leadership across a breadth of programs and metrics. This commitment indicates the importance of this resource to utilities and the benefits it provides to customers. Eversource Massachusetts and National Grid Massachusetts excelled in the Scorecard, both earning more than 90% of the available points. These two utilities are especially strong in quantitative energy efficiency program performance as well as energy savings targets. These strengths, along with full scores in Category 3, indicate both a commitment to efficiency and the presence of solid state and regulatory support.
The metrics evaluated in the Scorecard provide information to utilities, regulators, and others on how to realize the many benefits of efficiency for businesses, customers, and
communities.The report adds transparency to utility-sector energy efficiency data and highlights areas where data availability can improve. It also provides a baseline for utilities to assess performance and gain insights into trends that will strengthen program efforts. A utility shows its commitment to energy efficiency through the quantitative performance assessed in the Scorecard and by including efficiency in future planning through pilot programs, implementation of emerging areas and technologies, and setting strong targets.
Introduction
Energy efficiency produces substantial benefits for the electric utility system. By reducing energy consumption, utilities can delay or avoid the need to build new infrastructure like power plants and distribution assets. Utilities can also reduce the need for higher-cost electricity from other sources such as natural gas. Reducing energy consumption can
decrease harmful air pollutants associated with fossil fuel generation, and utilities can lower wholesale prices for electricity. These benefits reduce costs for all utility customers. Energy efficiency can also boost economic growth and create jobs.
Utility-sector efficiency programs play a key role in eliminating energy waste and have grown in recent years. From 2006 to 2015, annual utility spending on electric efficiency increased from $1.6 billion to $6.3 billion (Berg et al. 2016). Efficiency programs are also reducing the need for other generation sources and making up an increasing share of resources to meet customer demand. In 2015, energy efficiency represented 18% of
electricity resources nationally, making it the third-largest resource behind natural gas and coal (Molina, Kiker, and Nowak 2016).
ACEEE’s 2017 Utility Energy Efficiency Scorecard focuses on 18 areas of interest related to utility-sector energy efficiency efforts. Previous studies have made important contributions to ranking utility performance, among them the Ceres report, Benchmarking Utility Clean Energy Deployment: 2016, which examines three metrics related to energy efficiency and renewable energy (Mullen and Bakal 2016). The Scorecard builds on previous research with a more comprehensive analysis of achievements in the utility sector, focused primarily on end use energy efficiency. Each metric relies on primary data to assess a critical aspect of utility- sector energy efficiency. We highlight the successes of leading utilities in various areas of program implementation and innovation, and we point out areas for improvement.
Methodology
In this section, we provide information on the selection of the utilities and scoring metrics contained in the report. We also outline our approach to data collection, including
limitations to the data we used.
S
ELECTION OFU
TILITIESWe focused on the United States’ 51 largest electric utilities by retail sales volume.2 They represent various regions, ownership types, and program administrator models. This set of utilities accounts for 54% of 2015 electricity sales and covers 31 states (EIA 2016b). We used 2014 retail sales data published by the US Department of Energy’s Energy Information Administration (EIA) to determine which utilities to include because 2015 sales data had not yet been finalized at the time of utility selection (EIA 2016d). EIA data used throughout the rest of the report are from 2015.
2 Two of these utilities (Eversource Energy and PG&E) are represented on ACEEE’s board of directors, and about 20 others have been ACEEE conference sponsors, research funders, or Ally Program members over the past two years. All 51 utilities had the opportunity to review the draft findings. None contributed to the report’s funding.
The final list of utilities includes investor-owned (IOU), municipal, and state and other public utilities such as Long Island Power Authority.3 We focused on state jurisdictional utilities rather than parent or holding companies. For example, we included Georgia Power and Alabama Power as two separate utilities instead of focusing on their parent, Southern Company. We included both Duke Energy subsidiaries in North Carolina (Duke Energy Carolinas and Progress Energy) as separate utilities, as each individually ranked among the 51 largest utilities. While local power companies often offer energy efficiency programs under Tennessee Valley Authority’s Energy Rights Solutions programs, we did not include Tennessee Valley Authority in this report because it is a wholesale supplier and none of its wholesale power customers fall within the 51 largest utilities.
A few states use a third-party program administration model to deliver energy efficiency programs to retail customers. For utilities in those states, we worked with both the utility and the program administrators to appropriately allocate savings, spending, and other program data from within a utility’s territory, regardless of who administered the program.
These administrators include Focus on Energy in Wisconsin, Energy Trust of Oregon, New York State Energy Research and Development Authority (NYSERDA), and other state- or third party–run programs.4 It is important to note that it can be difficult for third-party administrators to allocate data to specific utility territories, as programs are often run with a statewide orientation.
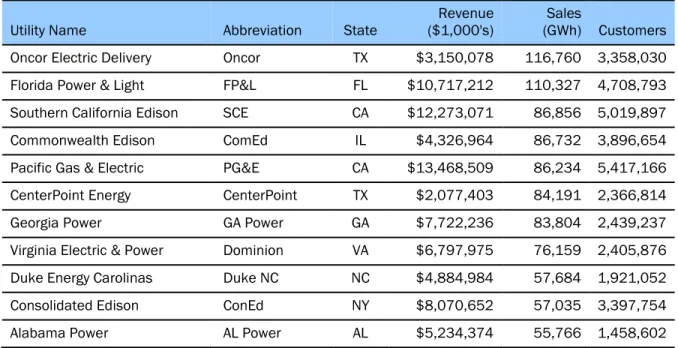
Table 1 lists the utilities included in this report sorted by sales and shows 2015 data on revenues, sales, and customers. Sales include both bundled and unbundled sales.
Table 1. Utilities included in this report
Utility Name Abbreviation State Revenue
($1,000's) Sales
(GWh) Customers Oncor Electric Delivery Oncor TX $3,150,078 116,760 3,358,030 Florida Power & Light FP&L FL $10,717,212 110,327 4,708,793 Southern California Edison SCE CA $12,273,071 86,856 5,019,897 Commonwealth Edison ComEd IL $4,326,964 86,732 3,896,654 Pacific Gas & Electric PG&E CA $13,468,509 86,234 5,417,166 CenterPoint Energy CenterPoint TX $2,077,403 84,191 2,366,814 Georgia Power GA Power GA $7,722,236 83,804 2,439,237 Virginia Electric & Power Dominion VA $6,797,975 76,159 2,405,876 Duke Energy Carolinas Duke NC NC $4,884,984 57,684 1,921,052 Consolidated Edison ConEd NY $8,070,652 57,035 3,397,754 Alabama Power AL Power AL $5,234,374 55,766 1,458,602
3 We did not include retail power marketers or utilities that do not operate a retail distribution system.
4 Utilities with portfolios that are fully or partially administered by the state or third parties include Ameren IL, BGE, ComEd, ConEd, JCP&L, LADWP, LIPA, NG NY, PG&E, PGE, PSE&G, SCE, SDG&E, and We Energies.
Utility Name Abbreviation State Revenue
($1,000's) Sales
(GWh) Customers Entergy Louisiana & Entergy
Gulf States Entergy LA LA $3,742,810 54,567 1,063,479
DTE Electric DTE MI $4,582,756 46,809 2,159,088
Ohio Power AEP OH OH $2,757,998 43,416 1,464,068
Public Service Electric & Gas PSE&G NJ $3,987,334 41,724 2,214,633 Duke Energy Florida Duke FL FL $4,442,866 38,553 1,721,849
PECO Energy PECO PA $2,181,591 38,067 1,601,669
Progress Energy Progress NC NC $3,437,850 37,217 1,303,473 PPL Electric Utilities PPL PA $1,803,316 36,981 1,418,528 Consumers Energy Consumers MI $4,031,759 36,930 1,797,237 Ameren Illinois Ameren IL IL $1,481,672 36,063 1,221,987 Ameren Missouri Ameren MO MO $3,209,918 35,876 1,203,538 Niagara Mohawk Power
(National Grid New York) NG NY NY $2,258,324 34,437 1,647,838 Northern States Power Xcel MN MN $2,971,034 30,311 1,259,609 Baltimore Gas & Electric BGE MD $2,223,154 30,304 1,257,765 Public Service Co. of Colorado Xcel CO CO $2,737,509 28,700 1,423,796 Arizona Public Service APS AZ $3,286,013 27,950 1,177,494 Duke Energy Indiana Duke IN IN $2,450,991 27,821 804,322 Salt River Project SRP AZ $2,753,072 27,699 1,014,022
AEP Texas Central AEP TC TX $973,740 25,064 822,666
Ohio Edison OH Edison OH $1,270,928 24,292 1,037,216 PacifiCorp PacifiCorp UT UT $2,065,533 24,158 856,756 Oklahoma Gas & Electric OG&E OK $1,810,576 24,065 754,057 Wisconsin Electric Power We Energies WI $2,837,810 23,702 1,108,864 Los Angeles Department of
Water & Power LADWP CA $3,506,166 23,336 1,413,211 Eversource Massachusetts Eversource MA MA $2,574,788 22,920 1,458,286 Puget Sound Energy PSE WA $2,073,085 22,523 1,103,627 South Carolina Electric & Gas SCE&G SC $2,477,906 22,173 694,834
Nevada Power NPC NV $2,336,098 22,073 887,964
Eversource Connecticut Eversource CT CT $2,615,259 22,071 1,232,614 City of San Antonio, TX CPS TX $2,057,559 21,513 776,840 Duke Energy Carolinas Duke SC SC $1,731,611 21,259 563,007
Utility Name Abbreviation State Revenue
($1,000's) Sales
(GWh) Customers Entergy Arkansas Entergy AR AR $1,820,796 21,160 704,170 Jersey Central Power & Light JCP&L NJ $1,709,504 21,062 1,106,242 MidAmerican Energy MidAm IA IA $1,424,541 20,922 662,798 Massachusetts Electric
(National Grid Massachusetts) NG MA MA $2,407,140 20,886 1,307,820
Duke Energy Ohio Duke OH OH $966,303 20,144 701,129
West Penn Power Company West Penn PA $928,899 20,049 721,791 Long Island Power Authority LIPA NY $3,449,588 19,925 1,119,104 San Diego Gas & Electric SDG&E CA $3,619,762 19,919 1,421,831 Portland General Electric PGE OR $1,736,431 19,382 848,526 Revenue, sales, and customer data from 2015 EIA Form 861 (EIA 2016d). All utilities are IOUs except CPS, LADWP, LIPA, and SRP.
M
ETRICS ANDS
CORINGThe metrics in this report reflect the current utility energy efficiency landscape and cover customer-funded programs and initiatives as well as other areas of utility focus that relate more broadly to energy efficiency, such as electric vehicles and customer rates. The metrics allow for flexibility in how utilities can achieve points, as both their physical and political environments vary greatly, and what is effective in one territory may not be in another.
Utilities operate in a diverse landscape of regulatory and state policies that strongly
influence planning, administration, and implementation of energy efficiency programs. Our metrics attempt to evaluate utility performance regardless of state or local policies.5
However we do recognize that electric utilities are regulated entities and often act only with regulatory approval. Our scoring represents what is happening within a utility service territory, and many actions are the result of complex legislative and regulatory processes.
We developed a set of 18 metrics that allocate a total of 50 points across three categories:
1. Quantitative energy efficiency savings and spending performance: 25 points 2. Program diversity and emerging areas: 15 points
3. Energy efficiency–related regulatory issues: 10 points
These categories recognize the importance not only of current-year performance but also of utility innovation, long-term planning, and policies that are critical to the continued success of energy efficiency programs.
We allocate 50% of the points to Category 1, energy efficiency program performance; 30% to Category 2, energy efficiency programs; and the remaining 20% to Category 3, policy issues including targets, utility business model, and evaluation. Point values for each set of metrics
5 ACEEE’s State Energy Efficiency Scorecard provides more information on state energy efficiency policies.
and each individual metric indicate their approximate relative importance in energy efficiency achievement for utilities. However when allocating points we also took into account the quality and availability of data. Table 2 lists each metric included in the report and its point value.
Table 2. Metrics and scoring
Metric Description Points
available % of total Category 1. Energy efficiency program performance 25 50%
Net incremental energy
savings Net incremental energy savings as % of total
sales 8 16%
Spending Total energy efficiency spending as % of revenue
(includes performance incentives) 7 14%
Peak demand reduction % of total peak demand reduction from energy efficiency (not demand response) on utility
annual peak 4 8%
Net lifetime energy savings Net lifetime electricity savings from measures
installed in 2015 as % of total retail sales 4 8%
Savings target achievement % of 2015 MWh savings target achieved 2 4%
Category 2. Energy efficiency programs 15 30%
Program diversity Implementation of various residential,
commercial, and industrial programs 3.5 7%
Emerging program areas Inclusion of specific measures or programs 3.5 7%
Pilot programs Existence of pilot programs 1 2%
Low-income program implementation
Spending, savings, and program
comprehensiveness for residential low-income programs
3 6%
Advanced metering % of meters installed in 2015 that are smart
meters (AMI) 1 2%
Data access Implementation of benchmarking services and
Green Button 1 2%
Electric vehicles Promotion of electric vehicles through education
and rates encouraging off-peak charging 2 4%
Metric Description Points
available % of total Category 3. Targets, utility business model, and evaluation 10 20%
Energy savings target 2015 net incremental energy savings target as
% of 2015 sales 2 4%
Future energy savings targets 2016–2018 net incremental energy savings
targets as % of 2015 sales 2 4%
Customer charges Level of residential customer charge as part of
primary rate option 1 2%
Time-of-use rates Existence of an optional time-of-use rate for
residential customers 1 2%
Utility business model Presence of full revenue decoupling and
performance incentives in 2015 2 4%
Evaluation, measurement, and
verification Independence of EM&V; calculation of net
savings 2 4%
Maximum points available 50
D
ATAC
OLLECTIONEach of the 18 metrics relies heavily on primary data. Appendix A lists our sources for these data. We asked utilities for annual reports, program plans, evaluations, and other sources including docket numbers and web links. We used evaluated data whenever possible. We relied on publicly available information but also worked closely with utility representatives who were willing to participate. We followed up with personal communications with utility representatives to clarify data or to fill gaps where we were unable to find data. We
extracted data and program information largely based on 2015 regulatory filings and 2015–
2018 planning documents, as well as additional filings on utility or public utility
commission websites as necessary. For utilities that do not operate on the calendar year, we used data from the 2014–2015 program year.6
We also relied on publicly available data collected from EIA Form 861, FERC Form 1, active utility tariffs, and third-party websites such as ENERGY STAR® and utility energy efficiency evaluator group websites. We used publicly available data and information collected from other ACEEE research to cross-check data provided in utility filings. We used 2015 EIA Form 861 energy efficiency data for utilities that did not respond to requests for information and for which we were unable to find regulatory filings.
In tallying sales, revenue, and customer counts for each utility, we included customers who are eligible to opt out of energy efficiency programs. This accounts for the negative impact of opt-out provisions that allow large customers to avoid participating in utility energy efficiency programs. Including opt-out customers increases the denominator of several
6 For SRP we used program year 2015–2016 data, which include eight months of 2015.
metrics, although some utilities exclude opt-out customers from these figures in their own internal calculations.
We adjusted some data to normalize results for scoring purposes. For utilities in states relying on third-party program administrators, we used publicly available data as well as allocators to assign performance within a utility’s territory. We confirmed these data with utility and program administrator staff. In all tables in this report, blank cells indicate that no data were found.
D
ATAL
IMITATIONSWe encountered several issues related to data. Some utilities do not publicly disclose detailed information on energy efficiency programs and performance. Annual energy efficiency reports are not typically available on utility websites and are sometimes difficult to locate through public utility commission websites. Additionally, annual reports are sometimes broken into many documents without a summary, making data difficult to extract and interpret.
Utilities do not report data consistently and may include or exclude certain types of
programs from their reporting. For example, some utilities include third-party programs as part of their own portfolio, while others report these programs separately. Utilities may also report data from certain programs separately on the basis of utility commission reporting standards and requirements. Utilities sometimes include demand response and renewable energy programs within efficiency portfolios. We do not include any spending or savings data related to demand response and renewable energy in any metrics in this report.
The level of detail in annual reports also varies widely across utilities. Many include
extensive descriptions of programs, while others list program names without descriptions or provide only summary data. These variations make it difficult to consistently interpret and analyze program and emerging technology offerings. Similarly, definitions of energy efficiency-related terms vary widely across utilities. This makes comparison of utility performance challenging for many metrics, such as cost-effectiveness testing, research and development programs, and low-income programs.
Reported levels of savings for utilities are also inconsistent. For example, it is often unclear in annual reports and filings whether utilities report savings at the meter or at the generator.
The difference between the two values is energy losses on the transmission and distribution system. Avoiding energy losses reduces the need for additional electricity and represents a large amount of energy savings. Many utilities also do not provide loss factors or program- or portfolio-level net-to-gross ratios.
We adjusted energy and demand savings as well as savings targets to net savings at the generator to account for additional savings from avoided line losses. For this adjustment we applied an average loss factor to savings figures that were not already reported at the generator level. In cases where utility-specific loss factors were unavailable, we used 6%, which is the average of EIA’s estimated US transmission and distribution losses for 2005–
2015 (EIA 2017). If we were unable to determine the reporting level for a utility’s savings data (generator versus meter), we assumed generator level in order to be conservative. We
also applied loss factors to the EIA total retail sales and total peak demand data, as they are reported at the meter level.
Another inconsistency is that some utilities report net savings while other report gross savings, and it is often unclear which value they are reporting. Net savings are energy savings attributable to energy efficiency programs. These may implicitly or explicitly
include the effects of factors such as free ridership, participant and nonparticipant spillover, and induced market effects (for a discussion of these effects, see Violette and Rathbun 2014).
We adjusted gross savings to net in cases where utilities reported gross. While it is not an exact comparison because states and utilities measure net savings differently, using net savings allows for more direct comparison of utility program achievement. Some utilities do not report net savings or net-to-gross ratios (NTGRs). For these utilities we applied a net-to- gross adjustment of 81.7%.7 If we were unable to determine whether savings were reported as net or gross, we assumed gross in order to be conservative. Appendix B provides more detail on reporting levels, line loss factors, and NTGRs.
Overall Scoring Results
Our review of the largest 51 utilities demonstrates wide variation in energy efficiency programs, actions, and other areas. When reviewing the results of performance in the three categories of energy efficiency, it is important to consider the operational constraints of these companies. Our scoring is an assessment of energy efficiency programs, policies, and performance within the context of state and regulatory environments.
All 51 utilities are regulated entities, meaning much of their behavior is constrained. For example, electric utilities will not undertake capital projects, including energy efficiency programs, without an opportunity to recover associated costs. Not only are these utilities’
actions often driven by regulatory decisions, but they are also guided by state policies.
These decisions and policies can sometimes hinder utility action on energy efficiency but can also drive greater performance, as has been shown to be the case with EERS policies.8
Table 3 shows the scores for each utility for all three categories of metrics, shaded by quintile.
7 This is the adjustment used in the ACEEE 2016 State Energy Efficiency Scorecard (Berg et al. 2016). It is the median NTGR calculated from states that reported both net and gross savings for the State Scorecard. See Berg et al. for more detail on this approach.
8 See Molina and Kushler 2015.
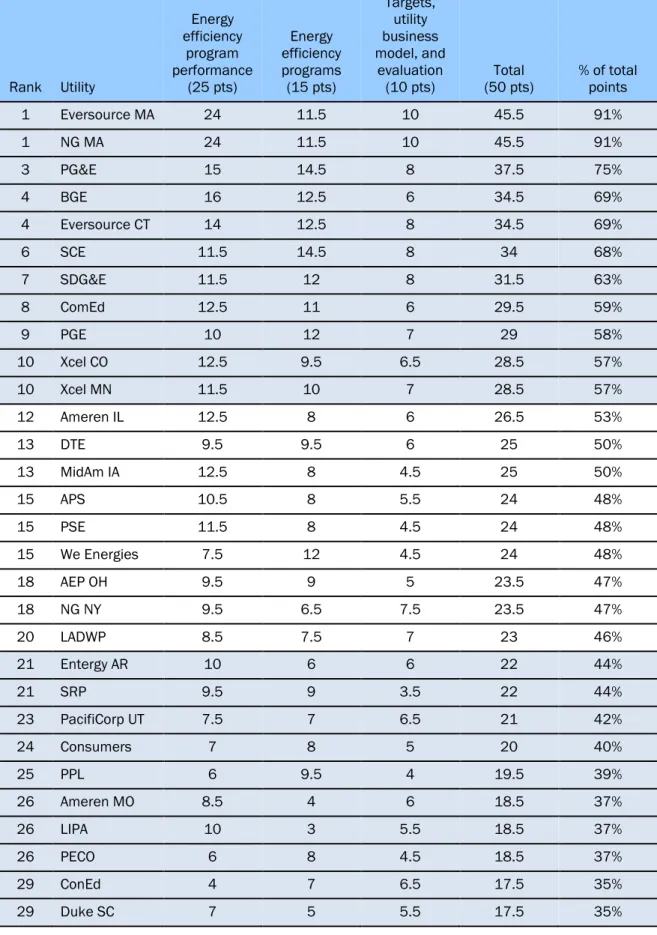
Table 3. Scores for all three categories of metrics
Rank Utility
Energy efficiency
program performance
(25 pts)
Energy efficiency programs (15 pts)
Targets, utility business model, and
evaluation
(10 pts) Total
(50 pts) % of total points
1 Eversource MA 24 11.5 10 45.5 91%
1 NG MA 24 11.5 10 45.5 91%
3 PG&E 15 14.5 8 37.5 75%
4 BGE 16 12.5 6 34.5 69%
4 Eversource CT 14 12.5 8 34.5 69%
6 SCE 11.5 14.5 8 34 68%
7 SDG&E 11.5 12 8 31.5 63%
8 ComEd 12.5 11 6 29.5 59%
9 PGE 10 12 7 29 58%
10 Xcel CO 12.5 9.5 6.5 28.5 57%
10 Xcel MN 11.5 10 7 28.5 57%
12 Ameren IL 12.5 8 6 26.5 53%
13 DTE 9.5 9.5 6 25 50%
13 MidAm IA 12.5 8 4.5 25 50%
15 APS 10.5 8 5.5 24 48%
15 PSE 11.5 8 4.5 24 48%
15 We Energies 7.5 12 4.5 24 48%
18 AEP OH 9.5 9 5 23.5 47%
18 NG NY 9.5 6.5 7.5 23.5 47%
20 LADWP 8.5 7.5 7 23 46%
21 Entergy AR 10 6 6 22 44%
21 SRP 9.5 9 3.5 22 44%
23 PacifiCorp UT 7.5 7 6.5 21 42%
24 Consumers 7 8 5 20 40%
25 PPL 6 9.5 4 19.5 39%
26 Ameren MO 8.5 4 6 18.5 37%
26 LIPA 10 3 5.5 18.5 37%
26 PECO 6 8 4.5 18.5 37%
29 ConEd 4 7 6.5 17.5 35%
29 Duke SC 7 5 5.5 17.5 35%
Rank Utility
Energy efficiency
program performance
(25 pts)
Energy efficiency programs (15 pts)
Targets, utility business model, and
evaluation
(10 pts) Total
(50 pts) % of total points
31 Duke NC 6.5 6.5 4 17 34%
32 Duke OH 6 6 4 16 32%
33 CenterPoint 3.5 7.5 4 15 30%
34 OG&E 3.5 8 3 14.5 29%
35 AEP TC 4.5 6.5 3 14 28%
35 NPC 6 5 3 14 28%
35 Progress NC 6 3.5 4.5 14 28%
35 West Penn 4 6 4 14 28%
39 Oncor 2.5 6.5 4 13 26%
39 SCE&G 4 4.5 4.5 13 26%
41 CPS 4.5 6.5 1.5 12.5 25%
41 JCP&L 4 5.5 3 12.5 25%
41 PSE&G 4 6.5 2 12.5 25%
44 Duke IN 2.5 3.5 4.5 10.5 21%
44 GA Power 3 5 2.5 10.5 21%
46 Duke FL 5 3 1.5 9.5 19%
46 OH Edison 2.5 4 3 9.5 19%
48 FP&L 4 3.5 1.5 9 18%
49 Entergy LA 1 5 2.5 8.5 17%
50 Dominion 0.5 2.5 2.5 5.5 11%
51 AL Power 0 3.5 1 4.5 9%
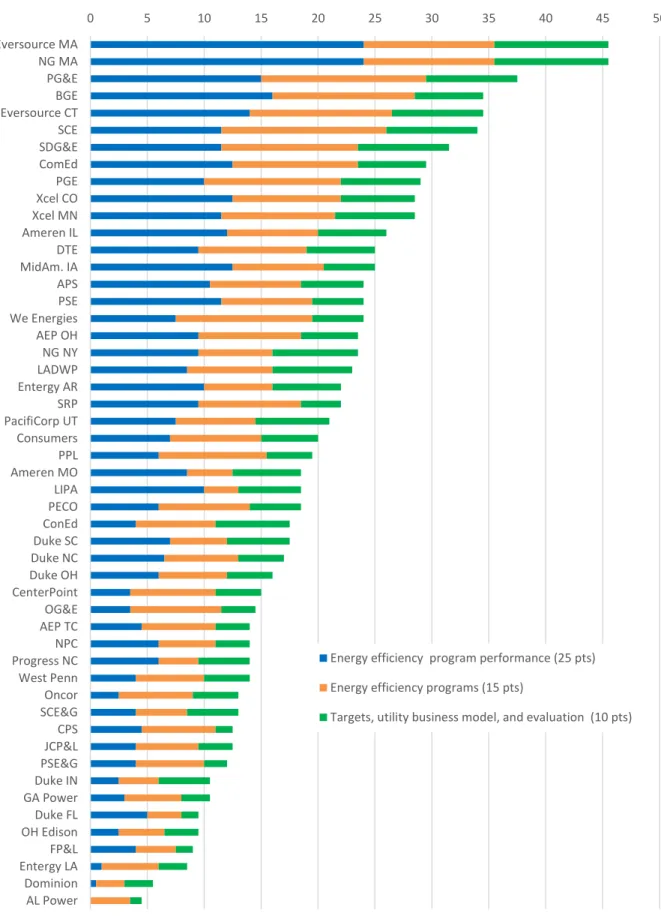
Figure 1 breaks down each utility’s scores for all three categories of metrics.
Figure 1. Scores by category
0 5 10 15 20 25 30 35 40 45 50
Eversource MA NG MA PG&E BGE Eversource CT SCE SDG&E ComEd PGE Xcel CO Xcel MN Ameren IL DTE MidAm. IA APS PSE We Energies AEP OH NG NY LADWP Entergy AR SRP PacifiCorp UT Consumers PPL Ameren MO LIPA PECO ConEd Duke SC Duke NC Duke OH CenterPoint OG&E AEP TC NPC Progress NC West Penn Oncor SCE&G CPS JCP&L PSE&G Duke IN GA Power Duke FL OH Edison FP&L Entergy LA Dominion AL Power
Energy efficiency program performance (25 pts) Energy efficiency programs (15 pts)
Targets, utility business model, and evaluation (10 pts)
On average, the 51 utilities earned 20.4 points, or 40.8%, out of the available 50. The median was slightly lower at 18.5. Two pairs of utilities in the top 10 come from the same parent companies (Eversource and Xcel Energy). The top 10 come from 8 states, including 3 utilities from California. In contrast, 5 of the bottom 10 utilities are in the southeastern United States.
The standings indicate that company commitment to energy efficiency and regional pressure to perform may be important to high efficiency achievement.
Eversource Massachusetts (Eversource MA) and National Grid Massachusetts (NG MA) earned the most points overall with 45.5 out of 50. These top two performers excelled in all three categories and were nearly 10 points in front of the next utility (Pacific Gas & Electric).
Even the top 10 utilities show a wide range of points achieved, with Eversource MA and NG MA earning 91% of possible points and 10th-place Xcel CO and Xcel MN each earning 57%.
This indicates there is opportunity for improvement even among the top performers.
The top two utilities are especially strong in the Category 1 quantitative program
performance metrics, as well as in those that assess energy savings targets. The high level of achievement in these categories reflects the strong regulatory support and the state policy goal of reaching high levels of savings. These utilities also scored full points in Category 3, indicating that policies put in place to facilitate energy efficiency are important to
achievement.
Regionally, there is wide variation in scores. The Northeast was the highest-scoring region, with 62% of available points earned on average, while the Southeast earned an average of only 25% of the points. Table 4 shows how utilities in each region performed, the percentage of possible points earned by the top and bottom utilities, and the three top-scoring utilities in each region.9
Table 4. Utility performance by region
Region Number of utilities
Total average %
of points achieved
% of points earned by
highest- ranked utility
% of points earned by
lowest- ranked
utility Top three utilities in the region (% of available points)
Mid-Atlantic 7 33% 69% 11% Baltimore Gas & Electric (69%), PPL (39%), PECO (37%)
Midwest 13 42% 59% 19% Commonwealth Edison (59%), Xcel MN
(57%), Ameren IL (53%)
Northeast 6 62% 91% 35% Eversource MA (91%), National Grid MA
(91%), Eversource CT (69%)
Southeast 10 25% 44% 9% Entergy AR (44%), Duke SC (35%), Duke
NC (34%)
9 The Mid-Atlantic includes utilities in MD, NJ, PA, and VA. The Midwest includes utilities in IA, IL, IN, MI, MN, MO, OH, OK, and WI. The Northeast includes utilities in CT, MA, and NY. The Southeast includes utilities in AL, AR, FL, GA, LA, NC, and SC. The Southwest includes utilities in AZ, NV, and TX. The West includes utilities in CA, CO, OR, UT, and WA.
Region Number of utilities
Total average %
of points achieved
% of points earned by
highest- ranked utility
% of points earned by
lowest- ranked
utility Top three utilities in the region (% of available points)
Southwest 7 33% 48% 25% Arizona Public Service (48%), Salt River Project (44%), Centerpoint (30%)
West 8 57% 75% 42% Pacific Gas & Electric (75%), Southern
California Edison (68%), San Diego Gas
& Electric (63%)
All of the metrics in The 2017 Utility Energy Efficiency Scorecard are important to building a well-balanced, effective, and forward-thinking energy efficiency portfolio. This report offers a baseline to assess utility performance and provides insights into trends that will help inform portfolio design and delivery in the future. The benefits of efficiency for utilities and their customers are numerous, as evidenced by the group of utilities leading the way in this report. For utilities that are just getting started or continuing to develop their portfolios, this report can provide information on what elements are important to include.
Category 1. Energy Efficiency Program Performance
In Category 1 we review several key areas of utility-sector energy efficiency program performance: incremental energy savings, program spending, peak demand reduction, lifetime savings, and progress toward energy savings targets.
Table 4. Category 1 scores by metric
Utility
Incremental savings
(8 pts) Spending (7 pts)
Peak demand reduction
(4 pts)
Lifetime energy savings (4 pts)
Progress toward 2015 goal
(2 pts) Total (25 pts)
% of Category 1
points
Eversource MA 8 7 4 4 1 24 96%
NG MA 8 7 4 4 1 24 96%
BGE 3.5 5.5 4 1 2 16 64%
PG&E 4 3 2.5 3.5 2 15 60%
Eversource CT 4 5.5 2 1.5 1 14 56%
ComEd 3.5 4.5 1.5 2 1 12.5 50%
MidAm IA 3.5 4 2.5 1.5 1 12.5 50%
Xcel CO 4 3 2 2.5 1 12.5 50%
Ameren IL 2 4.5 4 1 1 12.5 50%
PSE 3 4.5 2 1 1 11.5 46%
SCE 3.5 2.5 2 1.5 2 11.5 46%
SDG&E 3.5 3 2 1.5 1.5 11.5 46%
Utility
Incremental savings
(8 pts) Spending (7 pts)
Peak demand reduction
(4 pts)
Lifetime energy savings (4 pts)
Progress toward 2015 goal
(2 pts) Total (25 pts)
% of Category 1
points
Xcel MN 3.5 3.5 2 1.5 1 11.5 46%
APS 4 2 2 1.5 1 10.5 42%
Entergy AR 3 3 1.5 1.5 1 10 40%
LIPA 3.5 2 2 1.5 1 10 40%
PGE 3.5 4 0 2 0.5 10 40%
AEP OH 3 2 1.5 1.5 1.5 9.5 38%
DTE 3.5 2 1.5 1.5 1 9.5 38%
NG NY 3.5 3 2 1 0 9.5 38%
SRP 4 1 2.5 1 1 9.5 38%
Ameren MO 3 1.5 1 1.5 1.5 8.5 34%
LADWP 3 2 1 2 0.5 8.5 34%
PacifiCorp UT 2.5 2.5 1 1 0.5 7.5 30%
We Energies 2.5 1.5 1 1 1.5 7.5 30%
Consumers 2 2 1 1.5 0.5 7 28%
Duke SC 2 1.5 1 0.5 2 7 28%
Duke NC 2 1 1 0.5 2 6.5 26%
Duke OH 2 3 0.5 0.5 0 6 24%
NPC 2 1 1.5 0.5 1 6 24%
PECO 1.5 3.5 0.5 0.5 0 6 24%
PPL 1.5 3 0 0.5 1 6 24%
Progress NC