저작자표시-비영리-변경금지 2.0 대한민국 이용자는 아래의 조건을 따르는 경우에 한하여 자유롭게
l 이 저작물을 복제, 배포, 전송, 전시, 공연 및 방송할 수 있습니다. 다음과 같은 조건을 따라야 합니다:
l 귀하는, 이 저작물의 재이용이나 배포의 경우, 이 저작물에 적용된 이용허락조건 을 명확하게 나타내어야 합니다.
l 저작권자로부터 별도의 허가를 받으면 이러한 조건들은 적용되지 않습니다.
저작권법에 따른 이용자의 권리는 위의 내용에 의하여 영향을 받지 않습니다. 이것은 이용허락규약(Legal Code)을 이해하기 쉽게 요약한 것입니다.
Disclaimer
저작자표시. 귀하는 원저작자를 표시하여야 합니다.
비영리. 귀하는 이 저작물을 영리 목적으로 이용할 수 없습니다.
변경금지. 귀하는 이 저작물을 개작, 변형 또는 가공할 수 없습니다.
Master's Thesis
Analysis of aerosol properties at recent (2015-2018) high concentration events
Yesol Cha
Department of Urban and Environmental Engineering (Disaster Management Engineering)
Graduate School of UNIST
2020
Analysis of aerosol properties at recent (2015-2018) high concentration events
Yesol Cha
Department of Urban and Environmental Engineering (Disaster Management Engineering)
Graduate School of UNIST
I
Abstract
This research has been done to find out unique physical, chemical, and optical characteristics of aerosols in the case of high PM concentration events over the East Asian region, especially in Korea and China, by using various observations measured during recent four years. To analyze those characteristics of aerosols as high concentration events occur, various measurement data are used, like ambient surface air monitoring data (for physical properties) from national network in both Korea and China, Intensive Monitoring Data (for chemical properties), AERONET, GOCI satellite (for optical properties), and meteorological data during recent years (2015 – 2018).
It is found that concentrations of PM2.5 in China has rapidly decreased because of stringent air pollution control policies by the Chinese government, “Air Pollution Prevention and Control Action Plan”. However, in Korea, the PM2.5 concentrations of HCD (high concentration days) and the outliers of PM2.5 concentrations shows increasing trend by the year. In particular, in Ulsan, where is the representative industrial city, high concentrations of PM2.5 are shown during summer because a significant amount of VOCs emitted from the petrochemical industry will be converted into secondary aerosols through photochemical formation with strong solar insolation. By using statistical significant test, we found that the synoptic condition in winter season is important for long-range transport at Seoul metropolitan region, while as for Ulsan at the bay area, the local circulation is important in summer. In the case of chemical property, 𝑁𝑂3− is dominant in winter season at megacities (Seoul, Beijing) due to a large amount of NOx emitted from numerous mobile sources and 𝑁𝑂3− is well formed in low temperature. 𝑆𝑂42− is actively produced in industrial areas (Ulsan) where emit a large amount of 𝑆𝑂2 and VOCs, and these components form 𝑆𝑂42− through active photochemical reactions with strong solar energy during summer. In Beijing, the highest OC concentration during autumn and winter is mainly due to the intensive emission of OC from coal combustion for residential winter heating. The optical characteristics are analyzed by using ground based remote sensing data and satellite image. It is obvious that the aerosols caused by natural sources were dominant in section of coarse mode, and those secondary aerosols formed through chemical reaction with anthropogenic emission were in fine mode.
This study provides with observational evidences to confirm that each different region has different physical, chemical and optical characteristics of aerosol with different time period. The comprehensive results analyzed from this study and integrated methodologies suggested in this study might be useful to make better in-depth understanding of the relations between various aerosol properties in certain region and period.
Key words : Aerosol, High concentration events, Physical/Chemical/Optical Properties of aerosols, East Asia
II
Contents
I. Introduction ··· 1
II. Data and Analysis ··· 5
2.1. Target period and area ··· 5
2.2. Data ··· 6
2.3. Analysis ··· 7
III. Results
3.1. Yearly and Seasonal trend of PM2.5 in Korea ··· 9
3.2. Yearly and Seasonal trend of PM2.5 in China ··· 16
3.3. Weight of “High concentration” ··· 19
3.4. Monthly trends of PM2.5 in Korea and China ··· 20
3.5. High Concentration Events in Korea ··· 24
3.6. Statistically Significant Test ··· 26
3.7. Chemical Composition rates during HCD ··· 30
3.8. Optical properties during HCD ··· 32
IV. Summary and Concluding Remarks ··· 34
V. References ··· 36
III
List of Figures
Figure 1.1 Relative number of internet search as a proxy of public interest for PM10 in Korea (maximum value = 100) (Yeo et al., 2019).
Figure 1.2 Three types of aerosol properties.
Figure 1.3 Temporal resolution and spatial coverage used for analysis of high concentration events.
Figure 1.4 Goal of this study.
Figure 2.1 Location of target area. The red star marks the target cities in this study.
Figure 2.2 The algorithm of statistically significant test for comparative analysis.
Figure 3.1 Trends of annual mean PM10 and PM2.5 concentration in Seoul (Yeo et al., 2019).
Figure 3.2 Yearly mean of PM2.5 concentration during 2015-2018. Red bar represent PM2.5
concentration in Seoul and Blue bar represent PM2.5 concentration in Ulsan.
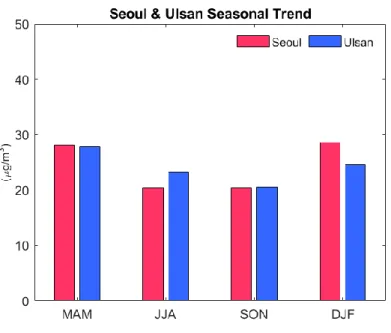
Figure 3.3 Seasonal mean of PM2.5 concentration during 2015- 2018. Red bar represent PM2.5
concentration in Seoul and Blue bar represent PM2.5 concentration in Ulsan.
Figure 3.4 box plotting used in this study.
Figure 3.5 yearly mean of the concentration of PM2.5 in Seoul. Diamonds represent the mean, red line represents the median, red crosses represent outliers.
Figure 3.6 yearly mean of the concentration of PM2.5 in Ulsan. Diamonds represent the mean, red line represents the median, red crosses represent outliers.
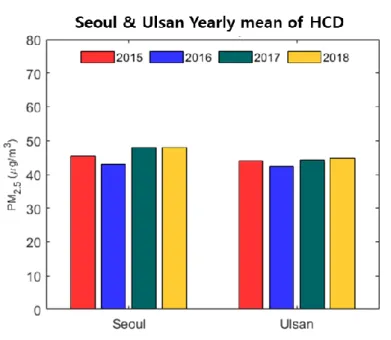
Figure 3.7 Yearly mean of High Concentration Days in Seoul and Ulsan from 2015 to 2018.
Figure 3.8 Seasonal and Yearly mean PM2.5 concentration in Seoul Figure 3.9 Seasonal and Yearly mean PM2.5 concentration in Ulsan.
Figure 3.10 Daily mean time-series of PM2.5 concentration in Seoul (top) and Ulsan (bottom).
Figure 3.11 Yearly mean of PM2.5 concentration during 2015-2018 in China.
IV
Figure 3.12 Seasonal mean of PM2.5 concentration during 2015-2018 in China.
Figure 3.13 yearly mean of the concentration of PM2.5 in Beijing (Top left), Shanghai (Top right), Qingdao (bottom left), and Dalian (bottom right).
Figure 3.14 Daily mean time-series of PM2.5 concentration in Beijing, Shanghai, Qingdao and Dalian from 2015 to 2019 November.
Figure 3.15 Result of (Mean – Median) of previous box plots in Seoul, Ulsan and Beijing.
Figure 3.16 The location of Beijing, Dalian, and Seoul.
Figure 3.17 Box plot of monthly mean of the concentration of PM2.5 in Beijing, Dalian, and Seoul using daily mean data.
Figure 3.18 Box plot of monthly mean of the concentration of PM2.5 in Qingdao, Shanghai, and Ulsan using daily mean data
Figure 3.19 Compares the mean of meteorological factors for entire period of winter (Blue) and for high concentration days of winter (Red) in Seoul (Left) and Ulsan (Right).
Figure 3.20 Compares the mean of meteorological factors for entire period of summer (Blue) and for high concentration days of summer (Red) in Seoul (Left) and Ulsan (Right).
Figure 3.21 Compares the mean of gas component for entire period (Blue) and for high concentration days (Red) in Seoul (Left) and Ulsan (Right) by seasons.
Figure 3.22 Pie chart of averaged chemical composition rate during high concentration days in Seoul, Ulsan, and Beijing by season.
Figure 3.23 The volume size distribution of aerosol which divided into three groups (Black –Normal, Red – Bad, Blue - Clear) by seasons and regions.
Figure 3.24 The spatial distribution of averaged AOD from GOCI satellite by seasons (left – averaged value of all period, right – averaged value of high concentration days in Seoul).
V
List of Tables
Table 1.1 Changes in Korea’s Aerosol Forecast standard (Change in 2018.03.27)
Table 2.1 Information of the data in Korea.
Table 2.2 Information of the data in China.
Table 2.3 Criteria of dividing data into three groups. National standard of Korea and China.
Table 3.1 The number of High Concentration Events in Korea by region and year.
Table 3.2 The number and duration days of High Concentration Events in Seoul by season.
Table 3.3 The number and duration days of High Concentration Events in Ulsan by season.
Table 3.4 Results of statistically significant test for meteorological factors in Seoul and Ulsan.
Table 3.5 Results of statistically significant test for gas components in Seoul, Ulsan, and Beijing.
Table 3.6 Results of statistically significant test for chemical composition in Seoul, Ulsan, and Beijing.
1
Chapter 1
Introduction
The aerosol has become one of the environmental issues in East Asia region because East Asia is the region of the most intense human activities in the world and experiencing high concentrations of various air pollutions with high emission amounts from anthropogenic fossil fuel combustion, biomass burning, dust storms, and biogenic emissions. Also, complex weather conditions in the West Pacific region contribute to several different reasons, which can cause the chemical/physical/dynamical formation of air pollutants in this region (Ding et al., 2017).
Notably, in South Korea, public awareness of aerosol is getting increased recently; even the high concentration condition of aerosol has been recognized as a social problem beyond environmental issues.
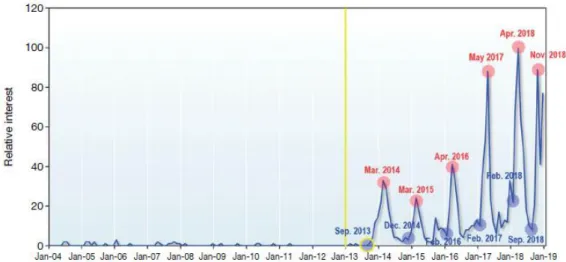
Figure 1.1 Relative number of internet search as a proxy of public interest for PM10 in Korea (maximum value = 100) (Yeo et al., 2019).
Figure 1.1 shows the relative intensity of media-searching for 'fine particle' from 2004 to 2019, with the highest as the value of 100. In this result, we can find that aerosol issues began to be a critical social problem, and public awareness has kept increasing year by year since 2013 (Yeo et al., 2019). For considering this public concerns, the Korean government, Ministry of Environment, strengthened the national air quality forecasting criteria, so that the current threshold value of “Bad” for PM2.5 change to over 35 µg/𝑚3 from over 50 µg/𝑚3 which is threshold before the year of 2018 (Table 1.1). The particular act on fine particle was enacted, and the high concentration of aerosol was designated legally as a national social disaster from the year of 2019.
2
Table 1.1 Changes in Korea’s Aerosol Forecast standard (Change in 2018.03.27)
It is shown in Figure 1.2 that we can identify three types of properties for aerosol. The first one is a physical property, which would be size distribution, mass concentration, shape, and number density of the particle. The second is a chemical property, which could be chemical composition (i. e., inorganic species, OC, EC, dust, soot, and toxic metals), including hygroscopicity of the aerosol (Boucher et al., 2015). The last is optical property (i. e., aerosol optical depth (AOD), fine mode fraction (FMF), and Å ngström exponents (Å )) which can be computed quantitatively as the intensity of extinction, scattering and absorption using Mie theory (van de Hulst, 1982; Huff-man, 1998).
Figure 1.2 Three types of aerosol properties.
While the forecasting and national standard of aerosol are mainly focusing on mass concentration, there are lots of needs to consider chemical and optical properties beyond physical properties for assessing source apportionment, the effectiveness of mitigation policy, and the risk of health. Many developed countries have enhanced the mitigation action of air pollutants to figure out their big/small air quality with ambitious national goals. However, the socio-economic effects of those counter- measures against severe air quality are something another for public consent and acceptance of those policies. It is essential for resolving this point to assess source attribution of different source sectors and
3
regions to a high concentration of fine particles by using not only physical property but also chemical and optical property.
In the previous study for the relationship between chemical composition and size distribution of aerosols, the concentration level of 𝑆𝑂42− and 𝑁𝐻4+ which used to be emitted from anthropogenic sources were high in fine mode aerosol, and 𝑁𝑎+ from natural sources has high concentrations in the coarse mode aerosol (Park et al., 2019). Atmospheric/chemical reaction, removal process, and different metrological conditions should also be studied using various types of observational properties in order to avoid unnecessary side-effects in case of implementation of new policies, regulations, and technical development for better air quality (Pöschl et al., 2005). For example, (𝑁𝐻4)2𝑆𝑂4 and 𝑁𝐻4𝑁𝑂3 as two leading scattering aerosols, their contribution increase 38.4 to 45.5 times during a high concentration period compared to the clear case (Park et al., 2015). The complicated relationship between chemical aging and meteorological conditions can be checked out in the previous study (Im et al., 2018). Optical information of aerosols from satellite, i. e., Å ngström exponents produced by GOCI, can help distinguish between fine mode aerosols (chemical species) and coarse mode aerosols (natural dust) (Kim et al., 2017).
Therefore, physical, chemical, and optical properties are essential and critical information for a comprehensive understanding of aerosols.
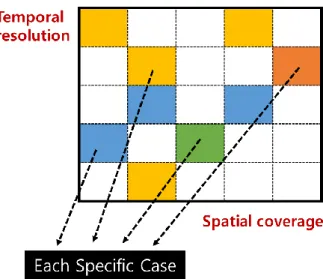
In this study, we try to understand the spatial and temporal characteristics of aerosols as valuable information for identifying hot spot and timing, where and when high concentration events occur (Fig.
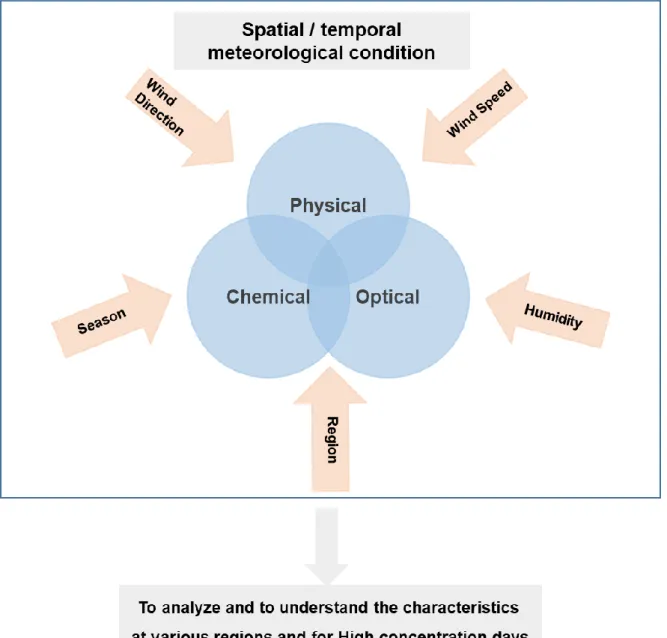
1.3). Also, the physical, chemical and optical properties of aerosols are analyzed in an integrated and comprehensive manner (Fig. 1.4). So, this study aims to analyze the spatial and temporal characteristics of aerosols and to understand the physical, chemical, and optical properties of aerosols with various meteorological conditions.
Figure 1.3 Temporal resolution and spatial coverage used for analysis of high concentration events.
4
Figure 1.4 Goal of this study.
5
Chapter 2
Data and Analysis
2.1 Target period and area
Aerosol observational data for three types of properties (Physical, Chemical, and Optical properties) were collected over the last four years (2015-2018).
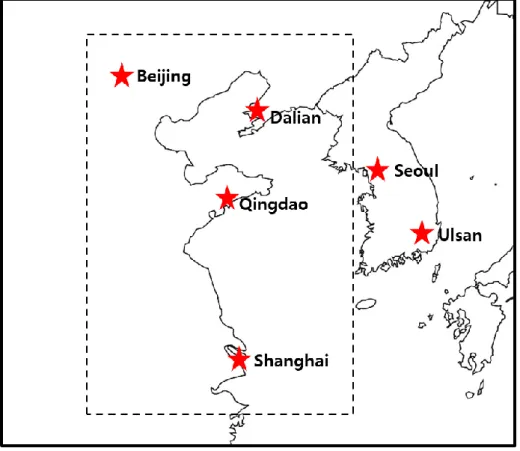
The location of the target area of this study is shown in Figure 2.1. Seoul is a super-megacity in Korea and located in the downwind region from China, where a high concentration of aerosol can be affected not only by domestic sources but also foreign with various meteorological conditions. Ulsan is the most representative industrial city in Korea, and the industrial complexes are gathered near the residential area. Beijing is the capital city of China, similar to Seoul city, Korea. In this region (BTH; Beijing- Tianjin-Hebei area), powerful Clean Air Action had been implemented during the past five years (2013- 2017). Dalian, Qingdao, and Shanghai cities are highly populated urban areas located close to Korea.
Figure 2.1 Location of target area. The red star marks the target cities in this study.
6
2.2 Data
The information about five types of data used for this study in Seoul and Ulsan is shown in Table 2.1.
Hourly averaged surface concentrations of SO2, CO, O3, NO2, PM2.5, and PM10 are analyzed for physical and chemical property of aerosols. These data observed in 42 and 38 measuring stations in Seoul and Ulsan, respectively, are spatially averaged into a representative value for each region.
Chemical composition of aerosols can be provided from two NIER intensive monitoring site (Seoul and Ulsan) as concentrations of 𝑆𝑂42−, 𝑁𝑂3−, 𝑁𝐻4+, OC, EC, 𝐶𝑙−, 𝑁𝑎+, 𝐾+, 𝑀𝑔2+, 𝐶𝑎2+. With these data, we can identify chemical characteristics of emission sources of two different cities, highly populated super-megacity and petrochemical industrialized city (Yu et al., 2018).
Table 2.1 Information of the data in Korea.
For optical properties, AERONET data and GOCI satellite data were used in this study. AERONET data observed for past 4 years (2015.01.01 ~ 2018.12.31) at Yonsei University and Seoul National University station are averaged for Seoul city and those observed during a special field campaign (KORUS-AQ; 2016.03.01 ~ 2017.01.31) for Ulsan city. The level 1.5 of aerosol optical depth (AOD) at 550nm, fine mode fraction (FMF), Å ngström exponents (Å ) are used for in-depth analysis. Also, aerosol volume size distributions were retrieved by the combination of AOD measurements at 440, 675, 870, and 1020nm and almucantar sky radiance inversion algorithm (Kim et al., 2006). GOCI satellite data, AOD (550nm) and FMF, were used for wide spatial distribution and coverage of aerosol in East Asia region. In this study, meteorological variables, temperature, precipitation, wind speed, wind direction, relative humidity, and visibility, were used for considering the weather conditions.
7
Table 2.2 Information of the data in China.
Table 2.2 shows ambient surface concentration of gaseous and aerosols, chemical composition of PM2.5 and optical information from ground-based remote sensing and satellite in China.
Surface concentration of SO2, CO, O3, NO2, PM2.5, and PM10 averaged hourly are measured at 12, 10, 10, and 9 stations in Beijing, Shanghai, Qingdao, and Dalian, respectively. Also, we tried to identify chemical composition (𝑆𝑂42−, 𝑁𝑂3−, 𝑁𝐻4+, OC, EC, 𝐶𝑙−, 𝑁𝑎+, 𝐾+, 𝑀𝑔2+, 𝐶𝑎2+) of PM2.5 by analyzing the filters collected at Beijing intensive monitoring site for a year (2018). The AERONET data in Beijing and GOCI satellite data were used for the optical properties of aerosols.
2.3 Analysis
In this study, High Concentration Day (HCD) is defined as the daily averaged concentration of PM2.5
exceeding the standard of the atmospheric environment (35µg/𝑚3) and High Concentration Events (HCE) as a high concentration day being shown for three days in a row, or five days in a row, or longer than seven days. The comparative analysis is conducted by comparing daily, monthly and yearly mean values to specific criteria such as high concentration days or high concentration events.
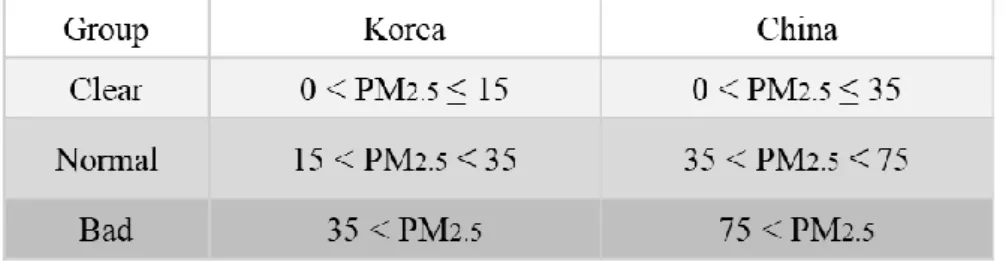
Daily averaged PM2.5 concentrations are divided into three groups based on the Korean and Chinese national PM2.5 standard and Chinese national ambient air quality standard, and then the characteristics of PM2.5 at each region and season has been analyzed (Table 2.3).
8
Table 2.3 Criteria of dividing data into three groups. National standard of Korea and China.
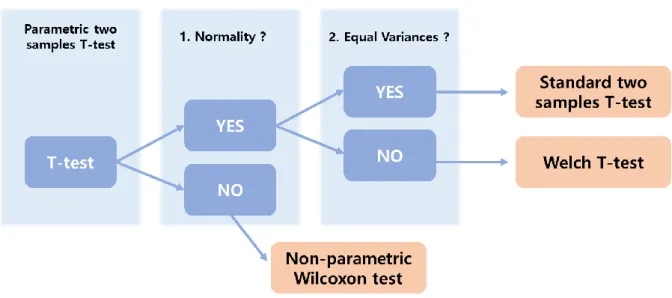
For the comparative analysis, the statistically significant test is conducted for each meteorological, chemical, optical variable. With this statistical test, we can find out if there is a statistically significant difference between averaged values between all periods and high concentration days. In case that the result of the p-value is smaller than 0.05, the significant difference supposed to exist between averaged value for high concentration days compared to for all periods. We adopt a Non-parametric Wilcoxon test when the distribution of the differences between the two samples cannot be assumed to be normally distributed, otherwise the Welch t-test is performed (Fig. 2.2).
Figure 2.2 The algorithm of statistically significant test for comparative analysis.
9
Chapter 3
Results
3.1 Yearly and Seasonal trend of PM2.5 in Korea
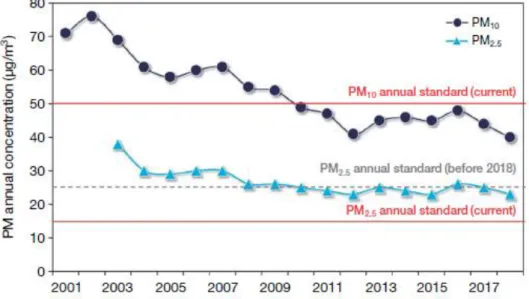
According to Yeo et al. (2019), PM2.5 concentration in Seoul exceeded the newly announced annual average air quality standard of 15µg/𝑚3 during 2003 – 2018. However, PM2.5 concentrations are continuously decreasing since 2003 and close to 25µg/𝑚3 which value were effective until 2019 as annual environment standard (Fig. 3.1).
Figure 3.1 Trends of annual mean PM10 and PM2.5 concentration in Seoul (Yeo et al., 2019).
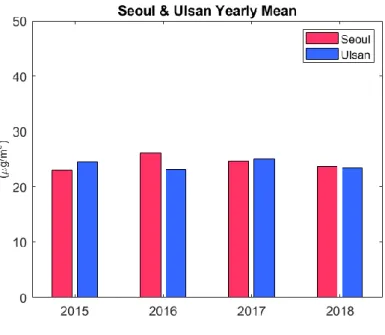
Figure 3.2 shows the annual mean of PM2.5 for recent 4 years (2015- 2018) in Seoul and Ulsan. It is not shown that there is a significant change in the concentration during that period. In Seoul, the concentrations of PM2.5 slightly keep decreasing after 2016, while the concentrations of PM2.5 are repeating increase and decrease in Ulsan. The seasonal variation of PM2.5 concentration of Seoul are not the same as Ulsan (Fig. 3.3). In both Seoul and Ulsan, the concentration of PM2.5 is high in spring (MAM) and winter (DJF). Notably, in Ulsan, the concentration of PM2.5 in summer (JJA) is significantly higher than that of Seoul. Ulsan is the most industrialized city of South Korea, so that high concentration of PM2.5 in summer in Ulsan is possibly caused by the result of second production. In particular, a significant amount of volatile organic compounds (VOCs) emitted from petrochemical complexes will be converted into organic particles through photochemical reactions in the atmosphere (Choi et al., 2018).
10
Figure 3.2 Yearly mean of PM2.5 concentration during 2015-2018. Red bar represent PM2.5
concentration in Seoul and Blue bar represent PM2.5 concentration in Ulsan.
Figure 3.3 Seasonal mean of PM2.5 concentration during 2015- 2018. Red bar represent PM2.5
concentration in Seoul and Blue bar represent PM2.5 concentration in Ulsan.
11
The annual mean PM2.5 concentration change in Seoul and Ulsan through box plotting (Fig. 3.4) using daily mean data is shown in figure 3.5 and figure 3.6. Mean and median have no significant change during the four years both in Seoul and Ulsan, as mentioned before. However, if the focus on the outliers and maximum value, which are illustrated in figure 3.4, the outliers and maximum value of Seoul are increasing, it implies that the concentration of PM2.5 at high concentration days has been increased. In Ulsan, the maximum value was highest in 2018, and the number of outliers and the values are smaller than that of Seoul.
Figure 3.4 box plotting used in this study.
Figure 3.5 yearly mean of the concentration of PM2.5 in Seoul. Diamonds represent the mean, red line represents the median, red crosses represent outliers.
12
Figure 3.6 yearly mean of the concentration of PM2.5 in Ulsan. Diamonds represent the mean, red line represents the median, red crosses represent outliers.
Figure 3.7 Yearly mean of High Concentration Days in Seoul and Ulsan from 2015 to 2018.
13
Figure 3.7 shows the increasing trend of PM2.5 concentrations of HCD both in Seoul and Ulsan for recent 4 years. The result of HCD case is a little bit different from that of the annual mean for the entire period (2015-2018), that is, the high concentrations of PM2.5 are still seen at 2017 – 2018 in case of HCD, while the annual concentration of PM2.5 in Seoul is highest in 2016 and decreasing after 2016.
From Figure 3.8, we can find seasonal changes in HCD in Seoul. In the case of Seoul, seasonal and yearly changes of HCD in spring and winter are similar to overall annual trends, which suggests that Seoul is more affected by the high concentration of PM2.5 in spring and winter rather than in other seasons. In the previous study (lee et al., 2018), the frequency high concentration days occurred in Seoul is in order of January, March, and December. For Ulsan city, it seems that high concentration in Ulsan is affected by summer than other seasons (Fig.3.9).
Figure 3.8 Seasonal and Yearly mean PM2.5 concentration in Seoul
Figure 3.9 Seasonal and Yearly mean PM2.5 concentration in Ulsan.
14
Figure 3.10 shows the daily mean time-series of PM2.5 concentration at Seoul and Ulsan, in which a gray dashed line represents the threshold value for "Bad" as same as the national PM2.5 forecasting standard (35µg/𝑚3). The high concentration peaks in winter and spring were observed especially in 2018 compared to other years and the concentration went up to almost 100µg/𝑚3 for several days. The frequency of high concentration days and increased concentrations in Ulsan during summer from 2016 were shown so that the concentrations of PM2.5 during summer were similar to those of PM2.5 in winter and spring.
15
Figure 3.10 Daily mean time-series of PM2.5 concentration in Seoul (top) and Ulsan (bottom).
16
3.2 Yearly and Seasonal trend of PM2.5 in China
According to Zheng et al. (2017), PM2.5 concentrations at the Beijing-Tianjin-Hebei (BTH) region, the Yangtze River Delta (YRD) region, and the Pearl River Delta (PRD) region decreased 25%, 20%, and 15% respectively in 2017 compared to 2013. It seems that the efforts of Chinese government to improve air quality and protect public health, i. e., “5-year Air Pollution Prevention and Control Action Plan”, resulted in those huge decrease of PM2.5 concentrations.
Figure 3.11 shows the annual mean of PM2.5 for recent four years (2015-2018) in Beijing, Shanghai, Qingdao, and Dalian. As being unlike Korea, rapidly decreasing trends are shown in all 4 cities of China.
This result supports that the air quality in china successfully met the targets of Air Pollution Prevention and Control Action Plan, “The annual average PM2.5 concentrations should be reduced by 28–40%
from 2013 to 2017 in BTH, YRD and PRD region”.
The concentration of PM2.5 is high in spring (MAM) and winter (DJF) in China (Fig.3.12) which is similar to Korea. In summer (JJA), the concentration of PM2.5 is lowest in China, the wash out effect which is caused by Asian summer monsoon (Zhang et al., 2010). The annual mean of PM2.5
concentration change in Beijing, Shanghai, Qingdao, and Dalian through box plotting (as same as Fig.
3.4) using daily mean data is shown in figure 3.13. The mean and median are decreasing in all cities, and the maximum value also decreases rapidly, these trends are different from increasing trend of Korea.
However, regardless of the decreasing trend of annual mean of PM2.5 concentrations, the outliers in China are still extremely high even in 2018.
Figure 3.11 Yearly mean of PM2.5 concentration during 2015-2018 in China.
17
Figure 3.12 Seasonal mean of PM2.5 concentration during 2015-2018 in China.
Figure 3.13 yearly mean of the concentration of PM2.5 in Beijing (Top left), Shanghai (Top right), Qingdao (bottom left), and Dalian (bottom right).
18
Figure 3.14 Daily mean time-series of PM2.5 concentration in Beijing, Shanghai, Qingdao and Dalian from 2015 to 2019 November.
Figure 3.14 shows Daily mean time-series of PM2.5 concentration in Beijing, Shanghai, Qingdao and Dalian from 2015 to 2019. The gray dashed line in the daily mean time-series represents the threshold value for “Bad” which is following to the Chinses national atmospheric standards (75µg/𝑚3). After 2017 (refer to a blue shaded vertical line in Fig. 3.14), the concentration of PM2.5 at Beijing rapidly decrease especially for spring and winter and the frequency of days which over 75µg/𝑚3 decreases due to the stringent air pollution control policies of Chinese government.
19
3.3 Weight of “High Concentration”
In Chapter 3.1, it is found that the increasing trend of PM2.5 concentrations of HCD both in Seoul and Ulsan for recent 4 years. For in-depth statistical analysis for characteristics of HCD, we try to quantify the skewness of distribution of PM2.5 concentrations, that is, the weight of “High Concentration”, using the difference between mean and median value.
Skewness (Weight of “High Concentration”) = Mean – Median
The weight of "High Concentration" is shown as slightly positive (range of 2 ~ 4) with increasing trend in Korea (Seoul and Ulsan), while it is also positive but with very high values (range of 10 ~ 25) and decreasing trend in China (Beijing). These results indicate that the contribution of high concentration events to whole distribution of concentration is much bigger in China rather than in Korea, even though the extremely high value of outliers in Beijing is continuously decreasing.
Figure 3.15 Result of (Mean – Median) of previous box plots in Seoul, Ulsan and Beijing.
20
3.4 Monthly trends of PM2.5 in Korea and China
Seasonal variations of aerosols depend on seasonal variations of emissions. One of the main reasons of seasonal variations of the PM2.5 concentration is long-range transport (LRT), which depends on meteorological conditions (Zhang et al., 2010; Michael D, 2014). The location of Beijing, Dalian, and Seoul are shown in Figure 3.16, where can be affected by long-range transport due to northwesterly.
Figure 3.16 The location of Beijing, Dalian, and Seoul.
Figure 3.17 shows very similar monthly mean variations in all 3 cities, Beijing, Dalian, and Seoul.
PM2.5 concentrations are relatively higher in spring and winter rather than in other seasons due to high emission amounts in spring and winter season and lower in summer due to Asian summer monsoon. In the winter season, as the weather condition is getting colder then house heating is started, emission of air pollutants from fossil fuel should be added onto ordinary emission sources like industrial combustion and processes. Beyond anthropogenic emission sources like house heating, natural PM sources like Asian dust which used to be emitted in winter and spring season at arid and semi-arid Sandy and Gobi (gravel) deserts also effects seriously on PM2.5 concentrations over Chinese main continent and is transported into Korean peninsula, even toward Japan and Northwestern Pacific (Kim et al., 2008).
21
According to the previous study (Xiao, et al., 2015), especially in China, the PM2.5 concentrations in winter were about three times higher than the PM2.5 concentrations in summer, and winter house heating was identified as the main cause of PM2.5 pollutions during winter. Also, the prevailing wind of winter season in East Asian region, northwesterly, is favoring to the long-range transport of air pollutants from China to Korea (Lee et al., 2013). Moreover, when pressure anomalies over East Asian region are so high in winter due to very strong intensity of Siberian high pressure system that winds near the surface could be relatively weak and stagnant, the high concentration events easily occur (Oh, et al., 2015).
In Figure 3.18, we can find the differences of monthly trends in between urban and industrial complex area. The monthly mean PM2.5 concentrations of highly populated urban cities (Shanghai and Qingdao) are strongly affected by climatological variations, i. e., cold condition in winter and Asian monsoon in summer, like super-mega cities (Seoul and Beijing). Shanghai is the largest city of the Shanghai Municipality, which has over 15million people. It is located at the start of the Yangtze River and is one of the worlds’ largest seaports (Ye, Boming, et al., 2003). Qingdao is located on the southwest coast of the Shangdong Peninsula, bordering the Yellow Sea in the east and is a large coastal city in China with a population of about 7millions (www.gov.qd.sd.cn).
However, Ulsan is one of the most industrialized areas in the Korea, with huge shipbuilding, petrochemical, and automobile industrial complexes. In Ulsan, the concentrations of PM2.5 during summer (especially in May and June) are as high as in spring and winter (Fig. 3.18). Ulsan may be of course affected by long-range transport, but its emission amounts from local industrial activities are also expected to be quite significant. The high concentration of PM2.5 in summer is believed to be the result of photochemical secondary production with primary gaseous emission as precursors of PM formation. In particular, a large amount of volatile organic compounds (VOCs) emitted from the petrochemical industry will be converted into organic particles through an active photochemical reaction in the atmosphere during summer (Choi et al., 2018).
22
Figure 3.17 Box plot of monthly mean of the concentration of PM2.5 in Beijing, Dalian, and Seoul using daily mean data.
23
Figure 3.18 Box plot of monthly mean of the concentration of PM2.5 in Qingdao, Shanghai, and Ulsan using daily mean data.
24
3.5 High Concentration Events in Korea
The number of HCE (High Concentration Events) is shown in Table.3.1. The result cannot show the significant increasing/decreasing trends for four years (2015 – 2018). In a previous study (Yeo et al., 2019), it is found that the frequency of high PM10 concentration events exceeding 100µg/𝑚3 was decreasing in 16 cities in Korea during 2011 - 2017. In this study, we define HCE as if daily mean PM2.5 concentrations exceeding 35µg/𝑚3 have been observed for more than three days in a row. So, it seems that extremely bad air quality (PM10 concentration exceeding 100µg/𝑚3) has been improved gradually for last 10 years, but still there are needs to make it better by reducing slightly bad air conditions (PM10 concentration below 100µg/𝑚3 and PM2.5 concentrations exceeding 35µg/𝑚3).
In both Seoul and Ulsan, HCE used to occur frequently in spring and winter, when the concentration of PM2.5 was high. It is surprising that the total number of HCE for four years in Ulsan is larger than that of Seoul (Table 3.1). The large frequency of HCE in Ulsan may be attributed to higher concentrations in late spring and summer compared to in Seoul (Table 3.2 and 3.3). The number of HCE in Ulsan during summer is four times larger than that of Seoul. In fact, five cases of HCE happened around late spring, the end of May (25 May 2015 ~ 02 June 2015, 25 May 2016 ~ 31 May 2016, 22 May 2017 ~ 25 May 2017, 29 May 2017 ~ 01 June 2017, 26 May 2018 ~ 08 June 2018), which were not shown in this manuscript.
25
Table 3.1 The number of High Concentration Events in Korea by region and year.
Table 3.2 The number and duration days of High Concentration Events in Seoul by season.
Table 3.3 The number and duration days of High Concentration Events in Ulsan by season.
26
3.6 Statistically Significant Test
According to the previous study (Jeong et al., 2011), the variations of PM2.5 concentrations in Seoul where located in receptor region in East Asia, may be affected by seasonality due to temporal changes in wind direction, monsoon effect and other meteorological conditions. Notably, during winter, the meteorological conditions promote poor atmospheric mixing which cause the sever air pollution problem in Seoul (Lee et al., 1999).
In this study, the statistically significant test was conducted to see if there were significant differences of meteorological condition and chemical composition between during HCD and all periods. Table 3.4 shows the results of significant testing with p-values of less than 0.05 for the meteorological variables.
In winter, all the variables of meteorological factors (Temperature, Precipitation, Wind Speed, Humidity) were found to have a significant difference between averaged value of entire period and high concentration days in Seoul and Ulsan. This result suggests that synoptic meteorological conditions being favorable to long-range transport over East Asia are unique in case of high concentration days in winter.
Figure 3.19 shows the significant meteorological condition in winter for high concentration days of PM2.5, which could be characterized as higher temperature, weaker winds, and less precipitation. High concentration events often occur with warm temperature and slow tropospheric wind with high pressure system in winter, since the stationary high pressure over the Korean peninsula and northeastern China usually stabilized the atmosphere so, as to be a good condition for the accumulation of pollutants (Lee et al., 2011; Chaloulakou et al., 2003).
In the case of Ulsan, there was a significant difference of three variables (Wind Speed, Humidity, Visibility) in summer between the averaged value for all period and high concentration days (Table 3.4).
It seems that the weak daily averaged wind speed of Ulsan for high concentration days in summer could be related to opposite wind directions of each sea (daytime) and land (nighttime) breeze, and the low humidity (dry air) might be favorable to active photochemical reaction with strong solar insolation (Figure 3.20).
As for coastal, urban and industrialized area as like Ulsan where large industrial complexes are mainly located and local circulation should be much more complicated rather than inland cities, the high concentration events of air pollutants could be easily induced thermally and geographically due to unique meteorological condition of coastal areas and elevated emission amount of air pollutants from industrial complex (Cheng et al., 2008). According to previous studies (Kim et al., 2007; Ainslie et al., 2007), the recirculation of air mass by local circulation affects air quality adversely by transporting air pollutants to coastal areas.
27
Table 3.4 Results of statistically significant test for meteorological factors in Seoul and Ulsan.
Figure 3.19 Compares the mean of meteorological factors for entire period of winter (Blue) and for high concentration days of winter (Red) in Seoul (Left) and Ulsan (Right).
Figure 3.20 Compares the mean of meteorological factors for entire period of summer (Blue) and for high concentration days of summer (Red) in Seoul (Left) and Ulsan (Right).
28
The result of the statistically significant test for the gas component is shown in table 3.5. All components except ozone show a significant difference in all seasons and regions (Beijing have no data for high concentration days during summer), however, in the case of ozone, there is a significant difference only in summer and winter in Seoul and spring and summer in Ulsan.
Figure 3.21 shows the higher ozone in spring and summer and the lower in winter when high PM2.5
concentration days occur. The high concentration of ozone is related to strong solar energy in spring and summer seasons leading active photochemical reaction with both abundant NOx and VOCs concentrations. In the case of the HCD, photochemical reaction is also an important process for secondary production of aerosols. However, in winter, relatively abundant NOx and lack of VOCs supposed to lead NOx titration and result in lower ozone concentration, while large amount of NOx emission in winter season at Seoul is very positive condition to produce secondary aerosols.
The result of the statistically significant test for chemical composition is denoted in table 3.6 showing significant differences of 𝑆𝑂42−, 𝑁𝑂3−, OC, EC in all regions and all seasons. It is important to note that 𝑁𝐻4+ is significant differences between for the entire period and high concentration days in Seoul and Ulsan. According to Kim et al. (2018), high concentration events might occur due to the formation and accumulation of secondary aerosols, i. e., ammonium sulfate and ammonium nitrate, through the chemical reaction and chemical aging during long-range transport periods.
Figure 3.21 Compares the mean of gas component for entire period (Blue) and for high concentration days (Red) in Seoul (Left) and Ulsan (Right) by seasons.
29
Table 3.5 Results of statistically significant test for gas components in Seoul, Ulsan, and Beijing.
Table 3.6 Results of statistically significant test for chemical composition in Seoul, Ulsan, and Beijing.
30
3.8 Chemical composition rates during HCD
Figure 3.22 shows the averaged chemical composition rate for high concentration days in Seoul, Ulsan, and Beijing by seasons. In Korea, 𝑆𝑂42− dominants in summer and 𝑁𝑂3− in winter. Most 𝑁𝑂3− in polluted urban areas are secondary pollutants which produced by atmospheric chemical reactions from NOx, and it is well formed at low temperature and high humidity (Lee et al., 2004). With a lot of anthropogenic emissions, in urban areas, they attribute to high concentration of fine mode aerosol by the formation of ammonium nitrate. In the case of 𝑆𝑂42−, seasonal variation of concentration tends to be insignificant, but the contribution to PM2.5 of 𝑆𝑂42− is known to be highest in summer (Cho et al., 2016). In addition, since high temperature, strong insolation and high humidity make secondary production actively through photochemical reaction, 𝑆𝑂42− is well formed (Witting et al., 2004), so the 𝑆𝑂42− is dominant during summer.
From a regional perspective, figure 3.22 shows that 𝑁𝑂3− is dominant in Seoul except summer, while 𝑆𝑂42− is dominant in Ulsan except winter. Unlikely as Korea, OC is dominant during summer, autumn and winter in Beijing.
In megacities, the concentration of nitrate is generally high due to a large amount of NOx emitted by many mobile sources (Han et al., 2008), therefore 𝑁𝑂3− which is produced by the reaction mechanism of NOx and 𝑁𝐻3 can be dominant in Seoul except summer. As for Ulsan, 𝑆𝑂42− is one of the most abundant chemical compounds, because that industrial complexes at Ulsan have been emitting a considerable amount of 𝑆𝑂2 (from coal combustion of manufacturing factories) and VOCs (from the petrochemical industry), and these components form 𝑆𝑂42− through photochemical reactions (Han et al., 2008).
According to the previous study (Lin et al., 2009), the highest OC concentration in winter in Beijing is mainly due to the intensive emission of OC during cold season. In northern China, a large amount of coal is used for combustion during late autumn and winter, while the China government is making many efforts to replace coal with natural gases. However, coal in dense residential areas is still used and coal combustion for residential heating is the dominant source of carbonaceous aerosol in winter in Beijing (He et al., 2006).
31
Figure 3.22 Pie chart of averaged chemical composition rate during high concentration days in Seoul, Ulsan, and Beijing by season.
32
3.9 Optical properties during HCD
Optical properties of aerosols depend on their size distribution, chemical composition, and mixture type (Jung et al., 2018). The averaged aerosol volume size distribution by seasons and regions is shown in figure 3.23 using AERONET data, and the graph was divided into three groups based on the air quality standards of each country, which is same as table 2.3.
Three major features are obviously found in figure 3.23. First, there is a big peak in the range of 100𝜇𝑚 < 𝑟 < 101𝜇𝑚 at Beijing in spring. This range belongs to the coarse mode aerosol and is often a pollutant emitted from a natural source rather than anthropogenic pollutants. The distinct increasing of coarse mode aerosol in spring is because of frequent outbreaks of Asian dust storms (Kim et al., 2007). Second and third big peaks are in the range of 10−1𝜇𝑚 < 𝑟 < 100𝜇𝑚, which corresponds to a fine mode aerosol, at Ulsan and Beijing in the summer. It is because of secondary production by the secondary aerosol formation and hygroscopic growth. In Asian region, the hygroscopic growth of aerosols was much higher than that in Europe and the eastern U.S. The hygroscopic growth of aerosols is enhanced by high relative humidity in the lower troposphere because it offered proper conditions to sulfate aerosols for hygroscopic growth (Kim et al., 2007). Therefore, in summer, the peak occurs in accumulation mode.
Using GOCI satellite data, the seasonally averaged AOD is presented in figure 3.24. Unlike seasonal variations of mass concentration of PM2.5, AOD is highest in summer due to higher sensitivity of extinction efficiency for smaller size of aerosol, and lowest in winter when relatively large size of aerosol might be dominant compare to other seasons. It is obvious that GOCI AOD during high concentration days in winter could be quite useful for tracing long-range transport from industrial areas in the eastern coastal area of China which can be found.
33
Figure 3.23 The volume size distribution of aerosol which divided into three groups (Black –Normal, Red – Bad, Blue - Clear) by seasons and regions.
Figure 3.24 The spatial distribution of averaged AOD from GOCI satellite by seasons (left – averaged value of all period, right – averaged value of high concentration days in Seoul).
34
Chapter 4
Summary and Concluding Remarks
In this study, we analyze the three types of aerosol properties, which are physical, chemical, and optical properties using ambient surface air monitoring data from national network in both Korea and China, Intensive Monitoring Data, AERONET, GOCI satellite, and meteorological data during recent years (2015 – 2018). This study is motivated from a need to understand the relationship between the various properties (i. e., the relationships between physical and chemical properties, physical and optical properties, and chemical and optical properties) and to investigate different spatial and temporal features of those properties.
In Korea and China, during the recent year (2015-2018), the concentration of PM2.5 has decreased.
Especially, it is notable that the concentration of PM2.5 in China has rapidly decreased because of stringent air pollution control policies by the Chinese government, “Air Pollution Prevention and Control Action Plan”. However, in Korea, the PM2.5 concentrations of HCD (high concentration days) and the outliers of PM2.5 concentrations are increasing by the year. The concentration of PM2.5 in Korea and northern China is higher in spring and winter than other seasons due to long-range transport of Asian dust (spring) and emission from residential winter heating (winter). In particular, in Ulsan, where is the representative industrial city, high concentrations of PM2.5 are shown during summer because a significant amount of VOCs emitted from the petrochemical industry will be converted into secondary aerosols through photochemical formation with strong solar insolation.
During HCD, unique and different features of chemical and optical properties are found spatially and temporally. In the case of chemical property, 𝑁𝑂3− is dominant in megacities (Seoul, Beijing) due to a large amount of NOx emitted from numerous mobile sources. Also 𝑁𝑂3− is dominant during winter and spring because the low temperature and high humidity create proper conditions for 𝑁𝑂3− production. 𝑆𝑂42− is actively produced in industrial areas (Ulsan) where emit a large amount of 𝑆𝑂2 and VOCs, and these components form 𝑆𝑂42− through active photochemical reactions with strong solar energy during summer. In Beijing, the highest OC concentration during autumn and winter is mainly due to the intensive emission of OC from coal combustion for residential winter heating. The optical characteristics are analyzed by using the size distribution and AOD. The aerosols caused by natural sources such as Asian dust were dominant in section of coarse mode, and those by anthropogenic sources and secondary formation aerosols with chemical reaction were in fine mode.
The meteorological conditions are one of the essential factors for the high concentration of PM2.5 and high concentration events. In Seoul, during winter, the synoptic condition is important for long-range transport, and in Ulsan, the local circulation at the bay area is important in summer.
35
While the national PM forecasting and impact assessment of PM have been mainly focusing only on mass concentration, this study confirmed with observational evidences that each different region has different physical, chemical and optical characteristics of aerosol with different time period. The comprehensive results analyzed from this study and integrated methodologies suggested in this study might be useful to make better in-depth understanding of the relations between various aerosol properties in certain region and period. Also much more appropriate approaches for source apportionment, effectiveness of mitigation measures and assessment of human health can be possible with these scientific findings.
36
Chapter 5
Reference
Ainslie, B., & Steyn, D. G. (2007). Spatiotemporal trends in episodic ozone pollution in the Lower Fraser Valley, British Columbia, in relation to mesoscale atmospheric circulation patterns and emissions. Journal of Applied Meteorology and Climatology, 46(10), 1631-1644.
Bohren, C. F., & Huffman, D. R. (2008). Absorption and scattering of light by small particles. John Wiley & Sons.
Boucher, O. (2015). Physical, chemical and optical aerosol properties. In Atmospheric Aerosols (pp. 25- 49). Springer, Dordrecht.
Chaloulakou, A., Kassomenos, P., Spyrellis, N., Demokritou, P., & Koutrakis, P. (2003). Measurements of PM10 and PM2. 5 particle concentrations in Athens, Greece. Atmospheric Environment, 37(5), 649-660.
Cheng, F. Y., & Byun, D. W. (2008). Application of high resolution land use and land cover data for atmospheric modeling in the Houston–Galveston metropolitan area, Part I: Meteorological simulation results. Atmospheric Environment, 42(33), 7795-7811.
Cheng, X., Zhao, T., Gong, S., Xu, X., Han, Y., Yin, Y., & He, J. (2016). Implications of East Asian summer and winter monsoons for interannual aerosol variations over central-eastern China. Atmospheric environment, 129, 218-228.
Ding, A., Huang, X., & Fu, C. (2017). Air pollution and weather interaction in East Asia. In Oxford Research Encyclopedia of Environmental Science.
Han, Y. J., Kim, T. S., & Kim, H. (2008). Ionic constituents and source analysis of PM2. 5 in three Korean cities. Atmospheric Environment, 42(19), 4735-4746.
He, L. Y., Hu, M., Huang, X. F., Zhang, Y. H., & Tang, X. Y. (2006). Seasonal pollution characteristics of organic compounds in atmospheric fine particles in Beijing. Science of the Total Environment, 359(1-3), 167-176.
37
Jeong, U., Kim, J., Lee, H., Jung, J., Kim, Y. J., Song, C. H., & Koo, J. H. (2011). Estimation of the contributions of long range transported aerosol in East Asia to carbonaceous aerosol and PM concentrations in Seoul, Korea using highly time resolved measurements: a PSCF model approach. Journal of Environmental Monitoring, 13(7), 1905-1918.
Jung, C. H., Lee, J. Y., Um, J., Lee, S. S., & Kim, Y. P. (2018). Chemical composition based aerosol optical properties according to size distribution and mixture types during smog and Asian dust events in Seoul, Korea. Asia-Pacific Journal of Atmospheric Sciences, 54(1), 19-32.
Kim, D. R., Choi, W. J., Choi, M., Kim, J., Cho, A., Kim, S. K. & Moon, K. J. (2017). Analysis of Aerosol Optical Properties for High Particulate Matters and Light Asian Dust in Seoul Using GOCI. Journal of Korean Society for Atmospheric Environment, 33(3), 233-240.
Kim, H., Zhang, Q., & Heo, J. (2018). Influence of intense secondary aerosol formation and long-range transport on aerosol chemistry and properties in the Seoul Metropolitan Area during spring time: results from KORUS-AQ. Atmospheric Chemistry and Physics, 18(10), 7149-7168.
Kim, J. (2008). Transport routes and source regions of Asian dust observed in Korea during the past 40 years (1965–2004). Atmospheric Environment, 42(19), 4778-4789.
Kim, S. W., Yoon, S. C., Kim, J., & Kim, S. Y. (2007). Seasonal and monthly variations of columnar aerosol optical properties over east Asia determined from multi-year MODIS, LIDAR, and AERONET Sun/sky radiometer measurements. Atmospheric Environment, 41(8), 1634- 1651.
Kim, S. W., Yoon, S. C., Kim, J., & Kim, S. Y. (2007). Seasonal and monthly variations of columnar aerosol optical properties over east Asia determined from multi-year MODIS, LIDAR, and AERONET Sun/sky radiometer measurements. Atmospheric Environment, 41(8), 1634- 1651.
Lee, H. S., Kang, C. M., Kang, B. W., & Kim, H. K. (1999). Seasonal variations of acidic air pollutants in Seoul, South Korea. Atmospheric Environment, 33(19), 3143-3152.
Lin, P., Hu, M., Deng, Z., Slanina, J., Han, S., Kondo, Y., & Sugimoto, N. (2009). Seasonal and diurnal variations of organic carbon in PM2. 5 in Beijing and the estimation of secondary organic carbon. Journal of Geophysical Research: Atmospheres, 114(D2).
38
Lee, S., Ho, C. H., & Choi, Y. S. (2011). High-PM10 concentration episodes in Seoul, Korea:
background sources and related meteorological conditions. Atmospheric Environment, 45(39), 7240-7247.
Lee, S., Ho, C. H., Lee, Y. G., Choi, H. J., & Song, C. K. (2013). Influence of transboundary air pollutants from China on the high-PM10 episode in Seoul, Korea for the period October 16–20, 2008. Atmospheric Environment, 77, 430-439.
Moran, M. D., Dastoor, A., & Morneau, G. (2014). Long-Range transport of air pollutants and regional and global air quality modelling. In Air Quality Management (pp. 69-98). Springer, Dordrecht.
Oh, H. R., Ho, C. H., Kim, J., Chen, D., Lee, S., Choi, Y. S., & Song, C. K. (2015). Long-range transport of air pollutants originating in China: A possible major cause of multi-day high-PM10 episodes during cold season in Seoul, Korea. Atmospheric Environment, 109, 23-30.
Park, J. S., Park, S. M., Song, I. H., Shin, H. J., & Hong, Y. D. (2015). Characteristics of visibility impairment by semi-continuous optical and chemical property monitoring of aerosols in Seoul. Journal of Korean Society for Atmospheric Environment, 31(4), 319-329.
Pöschl, U. (2005). Atmospheric aerosols: composition, transformation, climate and health effects. Angewandte Chemie International Edition, 44(46), 7520-7540.
Van de Hulst, H. C. (1981). Light Scattering by Small Particles, Dover Publications. Inc., NY.
Van der Wal, J. T., & Janssen, L. H. J. M. (2000). Analysis of spatial and temporal variations of PM 10 concentrations in the Netherlands using Kalman filtering. Atmospheric Environment, 34(22), 3675-3687.
Wittig, A. E., Takahama, S., Khlystov, A. Y., Pandis, S. N., Hering, S., Kirby, B., & Davidson, C. (2004).
Semi-continuous PM2. 5 inorganic composition measurements during the Pittsburgh Air Quality Study. Atmospheric Environment, 38(20), 3201-3213.
Xiao, Q., Ma, Z., Li, S., & Liu, Y. (2015). The impact of winter heating on air pollution in China. PloS one, 10(1), e0117311.
39
Ye, B., Ji, X., Yang, H., Yao, X., Chan, C. K., Cadle, S. H., & Mulawa, P. A. (2003). Concentration and chemical composition of PM2. 5 in Shanghai for a 1-year period. Atmospheric Environment, 37(4), 499-510.
Yu, X., Ma, J., An, J., Yuan, L., Zhu, B., Liu, D. & Cui, H. (2016). Impacts of meteorological condition and aerosol chemical compositions on visibility impairment in Nanjing, China. Journal of cleaner production, 131, 112-120.
Zhang, L., Liao, H., & Li, J. (2010). Impacts of Asian summer monsoon on seasonal and interannual variations of aerosols over eastern China. Journal of Geophysical Research:
Atmospheres, 115(D7).
Zheng, Y., Xue, T., Zhang, Q., Geng, G., Tong, D., Li, X., & He, K. (2017). Air quality improvements and health benefits from China’s clean air action since 2013. Environmental Research Letters, 12(11), 114020.
40
김유근, 오인보, 강윤희, & 황미경. (2007). MM5-CAMx를 이용한 대기오염물질의 재순환현상 모델링: 2004 년 6 월 수도권 오존 오염 사례연구. 한국대기환경학회지, 23(3), 297- 310.
박민규, 김성준, 송솔아, 권혜옥, & 최성득. (2019). 울산시 미세먼지 입경별 이온 분포와 오염원 추정. 한국환경분석학회지, 22(1), 1-9.
손장호, 송상근, & 이강웅. (2010). 2009 년 봄, 여름철 광양만 지역 오존의 광화학적 특성 분 석. 한국대기환경학회지 (국문), 26(2), 161-176.
여민주, & 김용표. (2019). 우리나라 미세먼지 농도 추이와 고농도 발생 현황. 한국대기환경학회 지 (국문), 35(2), 249-264.
유근혜, 박승식, 김영성, 신혜정, 임철수, 반수진, & 조미라. (2018). 대기오염집중측정소별 2013~ 2015 년 사이의 PM 2.5 화학적 특성 차이및 유발인자 조사. Journal of Korean Society for Atmospheric Environment, 34(1), 16-37.
이상진, 김성준, 박민규, 조인규, 이호영, & 최성득. (2018). 울산시 미세먼지의 유해대기오염물질 오염 특성. 한국환경분석학회지, 21(4), 281-291.
이현주, 정여민, 김선태, & 이우섭. (2018). 한반도 미세먼지 발생과 연관된 대기패턴 그리고 미 래 전망. 한국기후변화학회지, 9(4), 423-433.
임병진, 이민도, 최진영, 박승명, 이상보, & 송미정. (2018). New Particle Formation and Growth at Baengnyeong Island in 2016. Journal of Korean Society for Atmospheric Environment, 34(6), 831-840.
이시혜, 김영성, 김용표, & 김진영. (2004). 광화학 상자모델과 기체/입자 평형모델을 이용한 서 울ㆍ수도권의 계절별 질산염 농도 변화. 한국대기환경학회지 (국문), 20(6), 729-738.
조성환, 김평래, 한영지, 김현웅, & 이승묵. (2016). 강원도 춘천에서 측정한 PM 2.5 의 탄소 및 이온성분 농도 특성 및 고농도 사례 분석. 한국대기환경학회지 (국문), 32(4), 435- 447.
41
감사의 글
AIR LAB의 첫 학부생 인턴을 시작으로, 첫 번째 학생으로 입학한 지 가 엊그제 같은데 벌써 2년이라는 시간이 흘러 석사 학위 논문을 제출하게 되었습니다. 모든 것이 처음이라 새롭고 서툴 러서 정신이 없었지만, 수많은 분들의 도움이 있었기에 지금의 AIR LAB 이 있고, 제가 석사 졸 업을 할 수 있었다고 생각합니다. 이에 감사의 말씀을 전하고자 합니다.
처음 송창근 교수님을 만나 뵀을 때, 전공자도 아니었던 저를 흔쾌히 학부생 인턴으로 받아 주 셨고, 그 인연으로 지금의 자리까지 올 수 있었다고 생각합니다. 교수님 덕분에 2년 동안 정말 많은 것들을 경험하고 배울 수 있었습니다. 처음에는 모든 것이 새로워 오히려 걱정 하기도 했지 만, 교수님께서 전폭적으로 지지해주시고, 다양한 배움의 기회를 마련해 주셨기 때문에 지금의 제 가 있을 수 있었습니다. 실수가 있어도 넓은 마음으로 받아주시고, 연구 방법뿐만 아니라 인생에 필요한 지혜와 세상을 크게 보는 법을 알려주셔서 정말 감사합니다. 내년에는 더 성장한 모습을 보여드리기 위하여 노력하는 학생이 되겠습니다.
더불어 바쁘신 와중에도 학위 논문 심사 위원으로 흔쾌히 참석해주신 최성득 교수님과 임정호 교수님께도 감사의 말씀을 올립니다. 학부 시절, 수업을 통해 미세먼지라는 환경문제에 처음으로 관심을 가지게 해주신 최성득 교수님, 잘 모르는 분야인 AI 수업에서, 혹시나 제가 제대로 알지 못 할 까봐 세심하게 배려해주신 임정호 교수님, 정말 감사드리고, 앞으로도 더 잘 부탁드립니다.
우리 AIR LAB 연구실분들께도 감사의 인사를 전합니다. 랩장임에도 불구하고 모든 것이 처음 이라 우왕좌왕 하던 저에게 큰 힘이 되어주신 김현국 박사님, 어려움에 부딪혀서 찾아가면 최선 을 다하여 도와주시는 이종재 박사님 정말 감사합니다. 그리고 항상 할 수 있다고 얘기해주는 은 령 언니, 묵묵히 열심히 일하는 강호, 내년부터 함께하게 될 세영이, AIR LAB 막내 규림이까지, 항상 즐거운 연구실 분위기 만들어줘서 정말 고맙고, 앞으로도 열심히 함께 무슨 일이든 해나가 봅시다. 또한, AIR LAB 에 저 혼자 있을 때 많은 도움을 주신 UCEM 연구실 분들께도 감사의 인사를 전하고 싶습니다.
만나는 것 만으로도 힐링되는 내 가장 소중한 친구들, 우유리, 정기정, 조희경에게도 고맙다는 말 전할게. 너희가 있어서 얼마나 다행인지 몰라, 우리 매일매일 행복하자. 그리고 멀리 떨어져 있어도 옆에 있는 것처럼 든든한 지원이, 혜정이, 지윤이도 무척 고마워. 천사 같은 내 룸메이트 수경이 언니, 그리고 밥친구, 술친구, 데이트 다 해주는 미솔이도 정말 고맙다.
마지막으로 언제나 내 편, 내 든든한 버팀목, 내가 제일 사랑하는 우리가족, 세상에서 제일 사 랑하고 고맙습니다. 초등학교 1학년 때부터 지금까지 직접 학교까지 데려다 주시는 우리 아빠, 집 밥을 너무 좋아하는 딸 위해서 주말마다 정성껏 도시락 싸서 챙겨주시는 우리 엄마, 고등학교 입학 할 때부터 기숙사에서 지내는 누나 대신해서 집에서 부모님 잘 챙겨주는 오빠 같은 내 동생 한솔이, 모두들 제가 어떤 선택을 하든 항상 응원해주고 지지해줘서 정말 감사합니다. 우리 항상 행복하고 건강합시다!
끝으로, 항상 저를 위해 기도 해주시던 우리 외할머니, 얼른 다시 회복 하셔서 늘 그랬던 것처 럼 저에게 ‘우리 예솔이 훌륭하다’ 라고 말씀 해주시기를 간절히 기도할게요, 힘내세요!