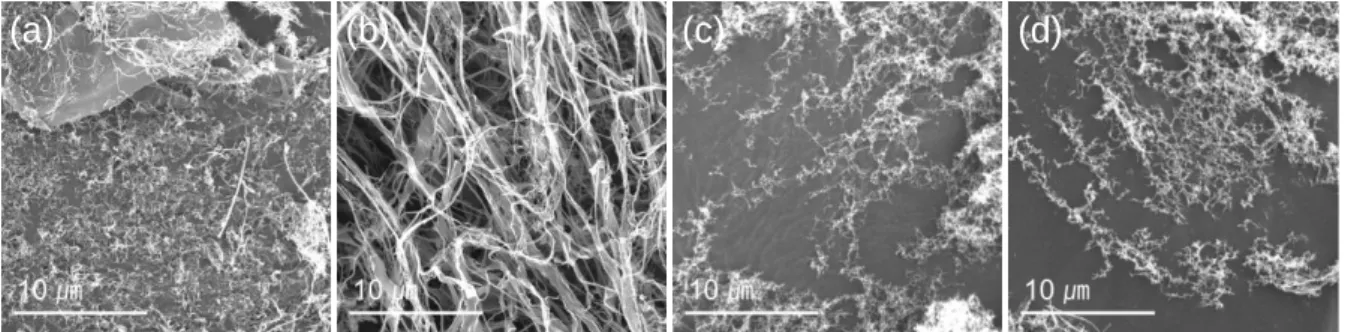
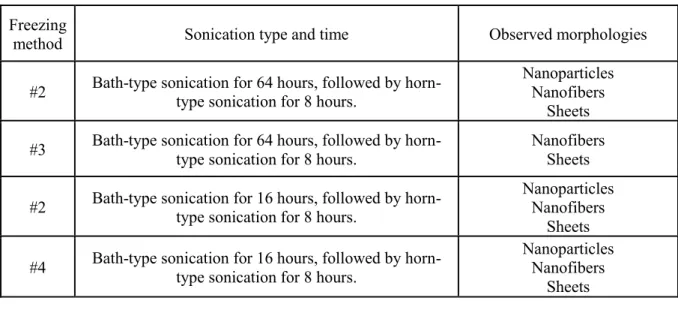
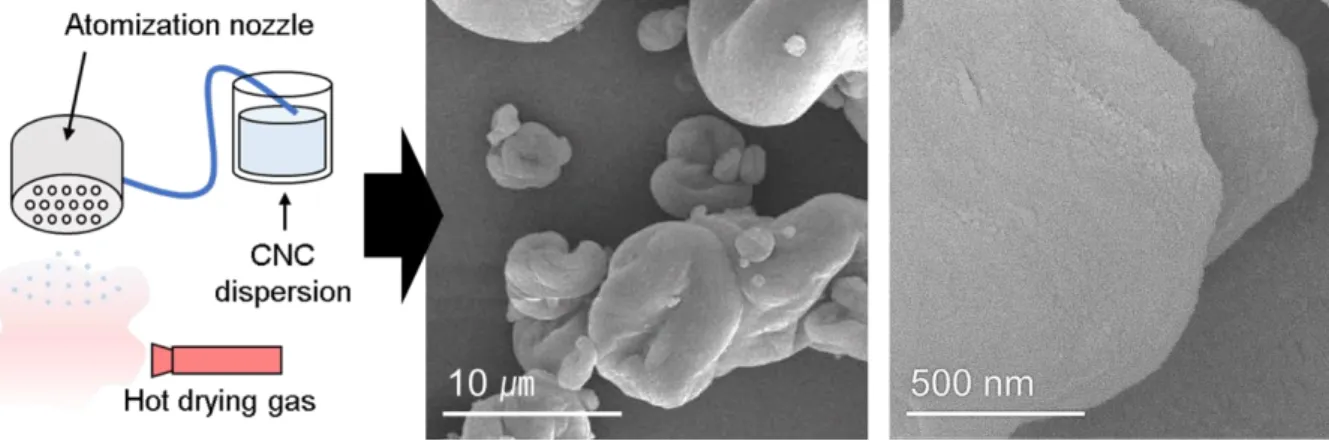
47 Figure 3.6 SEM images of spray lyophilized CNC obtained from 1.0 wt. % with different sonication times. 48 Figure 3.7 SEM images of spray lyophilized CNC obtained from 1.0 wt. % using a spray nozzle.
Cellulose Nanocrystals (CNCs)
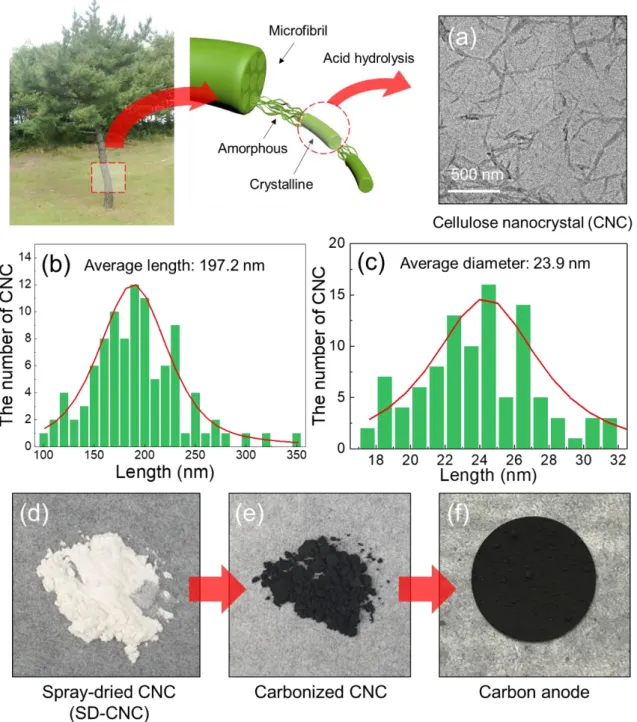
By removing amorphous areas through acid hydrolysis, the resulting nanometric crystalline materials, also called cellulose nanocrystals (CNCs), can be obtained. Among various nanocellulose materials, CNCs can be of great interest as a 'green' nanofiller for polymer nanocomposites due to their unique properties based on high crystallinity 3-6.
Preparation of Cellulose Nanocrystals
Crystalline structure of cellulose
This structure results from strong intermolecular hydrogen bonding by the hydroxyl groups of the cellulose molecule.
Extraction of cellulose nanocrystals
7 reported that CNC with cellulose II structure can be directly obtained by treating microcrystalline cellulose (cellulose I substrate) with sulfuric acid by controlling the amount of H2SO4 introduced and the addition time during the hydrolysis process. They found that CNCs with cellulose II structure were significantly smaller than CNCs with cellulose I structure and had rounded shapes such as ribbon-like morphology compared to CNCs with cellulose I structure of needle-like morphology.
Mechanical properties of Cellulose nanocrystals
The presence of these negatively charged groups induces the formation of a negative electrostatic double layer in the aqueous system, and it leads to the promotion of the dispersion of CNCs in water. The CNC obtained by sulfuric acid hydrolysis forms the very stable dispersed state in water by the electrostatic repulsion between individual nanoparticles.
Carbonization of Cellulose Nanocrystals
Carbonization mechanism of cellulose nanocrystals
Structure dependent sodium ion storage mechanism of
Introduction
- Carbonization of CNC
- Cell preparation
- Characterization
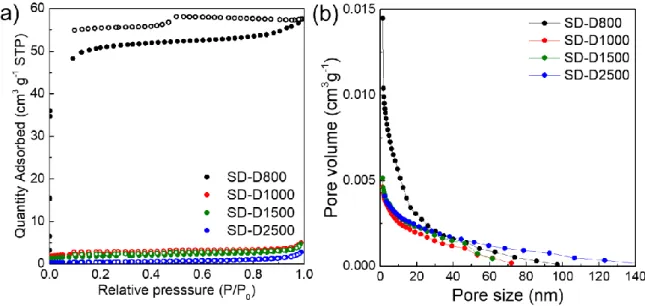
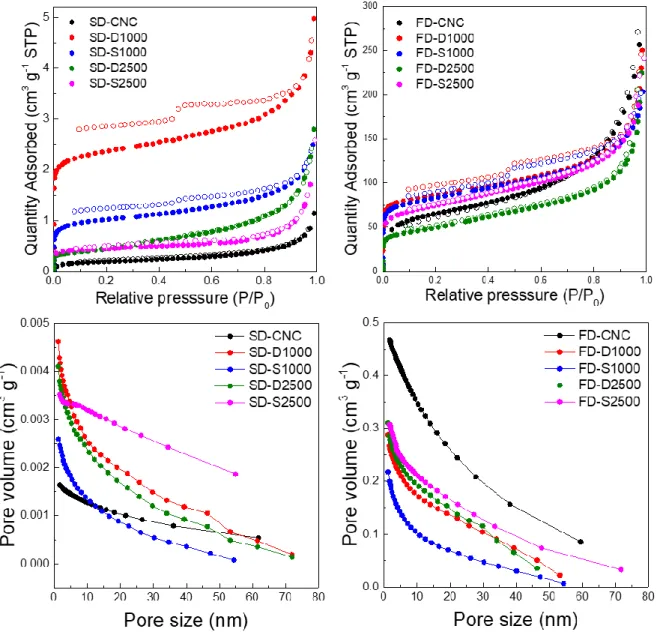
The electrochemical performance of carbonized SD-CNCs depends on the microstructures (less ordered structures and d-spacing). Detailed observation of sodium ion storage sites in the carbonized CNCs helps in the understanding of the charge–discharge mechanism of sodium ion in carbon anodes.
Results and discussion
- Morphological analysis
- Microstructural analysis
- Electrochemical performances of carbonized CNC
The red arrow in (d) represents the few-layer stacked structure with the d-spacing of 0.37 nm, which is observed on the surface of graphitic structure. e-h) The magnified images of (a-d) together with the Fast Fourier Transform (FFT) and d-spacing images. The rate performance for evaluating the kinetic feasibility of SD-D1000 and SD-D1500 is also illustrated in figure 2.11c.
Conclusion
Effects of drying method and structural evolution
Introduction
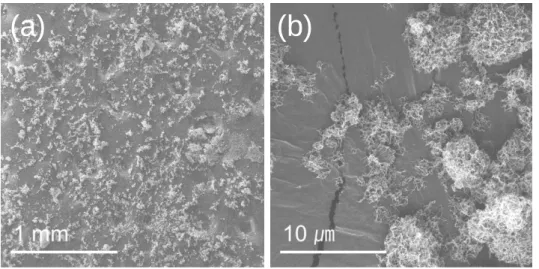
Effects of drying method and structural development mechanism of freeze-dried cellulose nanocrystals during carbonization. Additionally, heat can be applied more evenly to the FD-CNCs during carbonization, leading to the uniform microstructure of carbon. As such, the degree of structural transformation may vary depending on the pristine state morphology.
Therefore, the carbonization study on the structural development of FD-CNCs is necessary following that of SD-CNCs in our previous paper 16. In the present study, we carbonized FD-CNCs, which are in non-aggregated morphology, unlike SD -CNCs, in the range of C to trace the structural evolution mechanism. Furthermore, the oxidative stabilization was performed or not before carbonization to determine the effects of stabilization on the change of structure or morphology.
This study will provide the fundamental research on how to tailor the carbon structure of FD-CNCs with respect to the carbonization temperature and an understanding of how the structural evolution of carbonized CNCs differs by precursor morphologies.
Experimental
- Materials
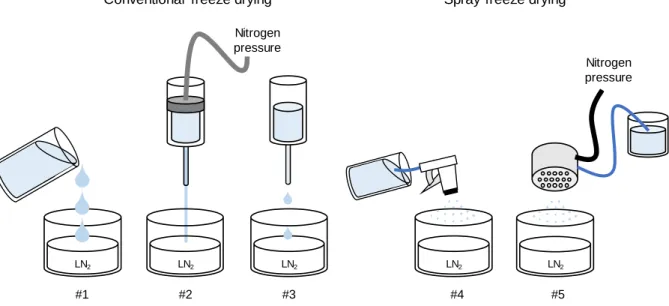
- Preparation of freeze-dried CNC
- carbonization of freeze-dried CNC
- Characterization
To distinguish from the carburized CNC as received, which is spray dried, FD was added in their code names. The morphology of the freeze-dried CNC (FD-CNC) and carbonized CNC was observed using scanning electron microscopy (SEM, Novanano230, FEI Co.) at an accelerating voltage of 10 kV. The microstructure of CNC and carbonized CNCs was investigated by a high-resolution transmission electron microscopy (HRTEM, JEM-2100. JEOL) operated at 200 kV acceleration voltage.
Raman spectra were recorded using an Alpha 300s micro Raman spectrometer (WITec) from 10 sites of carbonized CNC and 100 scans were averaged. Raman curve fitting to determine the spectral parameter was performed using the Peakfit software package supplied by Sigmaplot as the same peak fitting condition as mentioned in the previous paper.
Results and discussion
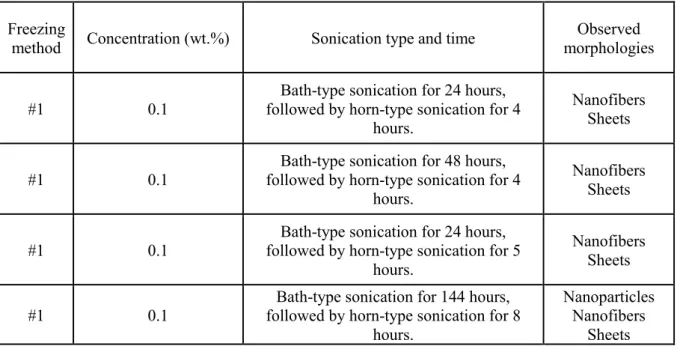
- Morphology control of cellulose nanocrystals by freeze drying
- Structural evolution of freeze-dried CNCs during carbonization
In the pristine FD-CNCs (Figure 3.12a), the highly crystalline parts (red arrow) are observed together with the amorphous parts that have few layered structures without order (yellow arrow) and have not yet been removed by acid hydrolysis (white arrow) , indicating that the acid treatment is not sufficient. The higher magnification TEM images of FD-CNCs versus the carbonization temperature are represented in Figure 3.13 and Figure 3.14. Therefore, A components in carbonized FD-CNCs appear to originate from the amorphous structure and short-range small crystals in pristine FD-CNCs (Figure 3.15a).
Schemes of mechanisms of structural development of A-components in FD-CNCs are shown in Figure 3.14e. The mechanism of evolution of T- or G-components based on TEM images and variation of structural parameters is shown in Figure 3.16. To summarize the carbonization mechanism of FD-CNC, Figure 3.17 shows the structural change of each component with respect to heat treatment.
This is due to the dramatic evolution of the graphitic structure and their thickness due to coalescence and interfusion above 2000 °C, which corresponds to the TEM images (Figure 3.16). However, the crystal sizes of the three components for SD-D/S2500 are larger than carbonized FD-CNCs (Figure 3.20 and Figure 3.22). This behavior was also observed in carbonized SD-CNCs, probably due to high-temperature carbonization above 2000 °C (Figure 3.28).
Conclusion
High-performance Amorphous Polyetherimide (PEI) fiber and
Introduction
- Polyetherimide (PEI)
With the addition of 1 wt% MWCNTs, the tensile strength and tensile modulus were increased by 22.6 and 39.5%, respectively. Their mechanical properties were improved by 15% in tensile strength and 7% in tensile modulus by the addition of 2 wt% MWCNT-COOH. In recent years, various kinds of cellulosic materials have been considered as attractive candidates for nanofillers in nanocomposites because they are environmentally friendly and derived from abundant resources 3 - 5 .
Their theoretical mechanical properties are reported to be as high as 206 GPa in tensile modulus along the [001] plane and 10 GPa in tensile strength 2, 4, 85. Therefore, CNC has already been used as a nanofiller in many nanocomposite systems, but there have been no previously reported attempts to use PEI /CNC nanocomposites. In the present study, the control PEI and PEI/CNC nanocomposite fibers were fabricated using a dry jet-wet spinning technique, followed by a post-drawing process to achieve the improved mechanical properties.
The behavior of PEI polymer chains and CNCs in relation to draw ratio and CNC amounts was thoroughly discussed using scanning electron microscopy (SEM), dynamic mechanical analysis (DMA), transmission wide-angle X-ray diffraction (WAXD ) and tensile testing.
Experimental
- Material
- Solution Preparation
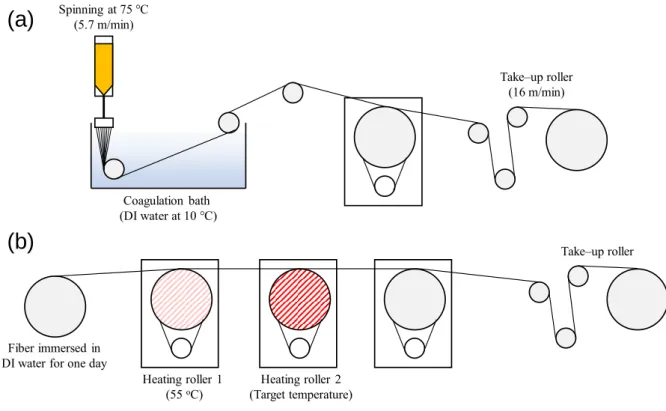
- Dry-jet wet spinning and post-drawing
- Characterization
The fracture morphologies of cross-sections of fibers were observed with a field emission scanning electron microscope (FE-SEM, Nanonova 230, FEI Co.) at an accelerating voltage of 10 kV after the sputter coating with platinum at 20 mA for 60 s. . Tensile properties of the PEI and PEI/CNC nanocomposite fibers were measured using a single filament tensile tester (FAVIMAT+, Textechno, GmbH) at a strain rate of 1%/s and at a gauge length of 1 inch with a prestress of 1.0 cN/ text. Linear density of the fiber samples was measured by a vibroscope attached to the tensile tester before tensile testing.
The effective diameters of the monofilaments were calculated based on the measured linear density and the known bulk density of PEI (1.27 g/cm3). In order to investigate the glass transition temperature and relaxation behavior of the fiber chain, dynamic mechanical analysis (DMA, Q800, TA Instrument Inc.) was performed from 50 to 250 °C with a ramping rate of 3 °C/min at a frequency of 1 Hz. Wide-angle transmission X-ray diffraction (WAXD) was performed at the PLS-II 6D UNIST-PAL beamline of the Pohang Accelerator Laboratory in Pohang, Republic of Korea.
Result and Discussion
- Post-drawing condition of PEI and PEI/CNC nanocomposite fibers
- The tensile properties of PEI and PEI/CNC nanocomposite fibers
- Fiber morphology of PEI and PEI/CNC nanocomposite fibers
- The glass transition temperature of PEI and PEI/CNC nanocomposite fibers
- Chain orientation and CNC alignment of PEI and PEI/CNC nanocomposite fibers
On the other hand, depending on the CNC amount, an increase in tensile modulus and a decrease in tensile strength and toughness were observed. The Tg and the magnitude of tan δ at the Tg are shown in the legend of b. To investigate the orientation behavior of the PEI polymer chain and CNC in the fibers as a function of TDR and the amount of CNC, WAXD pattern images are shown in Figure 4.9 and each peak is assigned in Figure 4.10.
They also confirmed that the density of the amorphous phase differs in the two directions. In particular, as shown in the 2D pattern images (Figure 4.9), CNC(200) is more distinct in the equatorial scan while the CNC(004) is more distinct in the meridional scan based on its orientation. For detailed analysis of the orientation of PEI polymeric chains, the overlapped spectra observed in the equatorial direction were developed (Figure 4.17) 118 .
The change in the degree of orientation of the overall spectrum (before deconvolution) according to DR is easily observed while a very slight change from the amount of CNC in the fibers. The value of fPEI is the highest in the control fiber and decreases dramatically with the addition of 1 wt.% of CNC. The orientation factors in the top row are calculated from azimuthal scans of (a-c) peak 2 and CNC(110), and the bottom row are from (d-f) peak 3 and CNC(200).
Conclusion
C.; Tingaut, P., Characterization of the supramolecular structure of cellulose nanowhiskers II produced by acid hydrolysis of cellulose substrates I. W.; Cui, Y.; Cho, J., Scalable synthesis of graphite embedded in silicon nanosheets for high-energy lithium-ion batteries. L.; Rojo, T., From charge storage mechanism to performance: a roadmap to high specific energy sodium-ion batteries through carbon anode optimization.
Simone, V.; Boulineau, A.; de Geyer, A.; Rouchon, D.; Simonin, L.; Martinet, S., Hard carbon derived from cellulose as anode for sodium ion batteries: Dependence of electrochemical properties on structure. W.; Hahn, M.; Scheifele, W.; Kotz, R.; Novak, P., In situ Raman spectroscopy of insertion electrodes for lithium-ion batteries and supercapacitors: First-cycle effects. Yoo, E.; Kim, J.; Hosono, E.; Zhou, H.; Kudo, T.; Honma, I., Large reversible Li storage of graphene nanosheet families for use in rechargeable lithium-ion batteries.
P.; Oksman, K., All-cellulose nanocomposite fibers produced by melt spinning of cellulose acetate butyrate and cellulose nanocrystals.