저작자표시 2.0 대한민국 이용자는 아래의 조건을 따르는 경우에 한하여 자유롭게
l 이 저작물을 복제, 배포, 전송, 전시, 공연 및 방송할 수 있습니다. l 이차적 저작물을 작성할 수 있습니다.
l 이 저작물을 영리 목적으로 이용할 수 있습니다. 다음과 같은 조건을 따라야 합니다:
l 귀하는, 이 저작물의 재이용이나 배포의 경우, 이 저작물에 적용된 이용허락조건 을 명확하게 나타내어야 합니다.
l 저작권자로부터 별도의 허가를 받으면 이러한 조건들은 적용되지 않습니다.
저작권법에 따른 이용자의 권리는 위의 내용에 의하여 영향을 받지 않습니다. 이것은 이용허락규약(Legal Code)을 이해하기 쉽게 요약한 것입니다.
Disclaimer
저작자표시. 귀하는 원저작자를 표시하여야 합니다.
Comparison of Residential Location Selection Determinants between Foreign female residents and
Domestic female residents using AHP
Jung Kug Lee
Department of Urban Environmental Engineering (Urban Infrastructure Engineering)
Graduate school of UNIST
2015
Comparison of Residential Location Selection Determinants between Foreign female residents and
Domestic female residents using AHP
A thesis/dissertation
submitted to the Graduate School of UNIST in partial fulfillment of the
requirements for the degree of Master of Science
Jung Kug Lee
12. 30. 2014 Approved by
_________________________
Advisor
Gi-Hyoug Cho
Comparison of Residential Location Selection Determinants between Foreign female residents and
Domestic female residents using AHP
Jung Kug Lee
This certifies that the thesis/dissertation of Jung Kug Lee is approved.
12. 30. 2014
___________________________
Gi-Hyoug Cho
___________________________
Dong Keun Yoon
___________________________
Jeongsob Kim
Abstract
The number of foreign population in Korea has dramatically increased over the last fifteen years.
The Korean government has initiated a multicultural family policy since 2006 in order to facilitate foreigners’ effective adaptation and settling down. Prior studies have shown evidence supporting the notion that various factors are associated with individuals’ preference on residential location selection.
Especially, those factors are significantly contributes to the building-up of foreign community populations which have become more conspicuous than ever before. Despite increasing concerns regarding the number of foreign-born female in Korea, too little attention is given to the residential location selection of foreign population in the previous literature. Most existing literatures are focused on the foreign workers and association with environmental characteristics; therefore, it is only speculation to the cause and effect relationship between these two objects.
In contrast to prior literature, this study attempts to identify how residential decision makings are influenced by architectural, social, characteristics of socioeconomic and environments. A survey for the determinants of residential location was conducted for those who reside in Ulsan City, above 20s and non-students as potential seeker for housing. Analytic Hierarchy Process (AHP) was used to analyze and identify the differences and similarities of residential location selection between foreign and domestic residents. To supplement the results of the survey, an in-depth interview was conducted for further analysis.
Hypothetically, we expected that the economic factors such as housing cost, investment prospects are the most important factor for both foreign-born female and domestic female residents. We hypothesized that foreign-born residents, however, are more seriously concerned about social factors such as proximity of friends and relatives, social group and same types of jobs than domestic residents.
The findings indicated that (1) preferences on residential location selection between domestic and foreign-born residents are similar in general since it concern with a basic human needs; (2) main differences between foreign and domestic residents are domestic are more influenced on investment in real estate, however, foreign residents are more influenced on living costs and travel expenses.
Surprisingly, the domestic residents have greater weight on the ‘where friends live’ than the foreign- born residents. In contrast, the foreign residents have a great weight on the ‘access to similar job’ than the domestic residents. The survey result shows that the social group is more important to the foreign- born residents than the domestic residents. In consistent, the in-depth interview results also indicate that the access to jobs is more important than the where friends live because it is the main source of living. From a practical perspective, this study suggests that, there is difference on residential location selection preference between the domestic female residents and the foreign-born female residents.
CONTENTS
Ⅰ. Introduction………...………..1
1.1 Background………..1
1.2 Aim ………...2
1.3 Objectives………...2
1.4 Purpose of Study……….…3
1.5 Research Questions……….……….…3
1.6 Outline Methodology……….…….….4
Ⅱ. Theoretical & Mathematical Development……….…...6
2.1 Various factors that influence on residential location selection…………..……….6
2.2 Residential location selection of foreign-born residents………..7
2.3 Housing Policy for Foreign-born population………...9
2.4 Analytic Hierarch Process (AHP) Method………...10
Ⅲ. Methodology………...…11
3.1 Study Area………..11
3.2 Sample………11
3.3 Recruiting methods………13
3.4 Socioeconomic characteristics and Demographic variables………..14
3.5 Quantitative Analytical Method……….15
3.5.1 Analytic Hierarchy Process (AHP)………...15
3.5.2 Analytical Methods – Principal Component Analysis (PCA)………...18
3.5.3 Estimating adjusted preferences………19
3.6 Qualitative method: in-depth Interview……….19
Ⅳ. Results……….20
4.1 Descriptive Statistics………..20
4.2 Analytic Hierarchy Process (AHP)………22
4.3 Adjusted mean by regression……….25
4.4 In-depth Interviews………33
Ⅴ. Discussion and Conclusion………41
5.1 Discussion………41
5.2 Reviews on Research questions………...43
5.3 Conclusions ……….45
References………..47
LIST OF FIGURES
1. Framework of the study………..……….………5
2. Analytic Hierarch Process………..……….…...10
3. City of Ulsan………..………11
4. Decision making process using AHP analysis………..……….16
5. Hierarchy Analysis model of residential location selection…..……….18
6. Sample of pair-wise comparisons………..………18
7. Comparion of level 1 and 2 weigth between the domestic and foreign residents………..24
8. Comparison of level 3 weight between the domestic and foreign residents………..25
9. Comparison of adjusted mean at level 1 and 2 weight of domestic and foreign………...27
10 Comparison of adjusted mean at level 3 weight between the domestic and foreign………28
11 Comparison of level 1 and 2 weight on socio-economic status ………...29
12 Comparison of level 3 weight on socio-economic status………..30
13. Comparison of level 1 and 2 weight on status of employment………..…..32
14 Comparison of level 3 weight on status of employment………...33
15 Comparison of Importance of residential decision factors………...35
LIST OF TABLES
1. Number of foreign born resident in Ulsan city…………..………..………..12
2. Types of foreign residents in Korean and Ulsan city………..……….………..12
3. Nationality of foreign marriage immigrants in Korea……….………..………12
4. Nationalities of foreign population in Ulsan city………..………...……..12
5. Total population respondents from the survey………..……….………14
6. Foreign population respondents from the survey ………..………..…..14
7. Hierarchy of criteria for individual preference on residential location selection…….………….…17
8. Factor description of residential location selection………..…………..17
9. List of in-depth interview questions………..………….20
10. Socio-economic descriptive of domestic and foreign population………..………..21
11. Socio-economic factors of domestic and foreign population………..……….22
12. Consistency Ratio of factors………..……..22
13. Weight of residential location selection for domestic residents………..…….23
14. Weight of residential location selection for foreign residents…………..………..…..23
15. Adjusted mean of Domestic residents ………...26
16. Adjusted mean of Foreign-born residents………....26
17. Low socio-economic status adjusted mean………..28
18. High socio-economic status adjusted mean………...…29
19. Unemployed adjusted mean………...31
20. Employed adjusted mean ………31
21. Nationalities of Interviewees……….………..34
22. Descriptive of Interviewees……….………34
23. Ranking by factors………..…….35
1
Chapter 1 Introduction
1. 1 Background
The number of foreign residents in Korea has dramatically increased over the last fifteen years as a result of rapid economic growth and social democratization. (Jun, Ha et al. 2013). According to a report by the Korean Ministry of Justice (MOJ), the number of foreign residents now stands at 1,628,771. This is an increase of 2.8% compared to 2013, and the number of registered foreign-born residents is expected to increase to 1,078,340, which represents a 10.5% growth rate compared to September of 2013. In same year, the number of illegal immigrants in Korea went up to 192,911, or 17% of the total foreign population (MOJ, 2014). This evidence of a consistent rise in the size of foreign populations certainly indicates that foreigners are no longer temporary residents of Korea;
they are becoming citizens and local residents of the country. As the phenomena of aging and low birth rates are occurring continually, the existence of foreign populations is becoming an essential socio-economic element of Korean society (Park & Jung, 2010; Jeong, Kim & Kim, 2013).
As the number of foreign-born residents are increasing, their nationalities and types of residencies (i.e. workers, marriage immigrants, naturalized foreigners, etc.) are becoming diverse, which effects social changes and cultural phenomena. Especially, the foreign-born females are mostly staying longer period than the average period of foreign workers and international students. As reside in Korean, they are giving a birth and living with their children will leads to a permanent settlement, which they will become a potential naturalized citizen of Korea. International marriage brings the cultural impact which requires the process of adoption and assimilation to oneself, but also its influence to family who is going to reside with foreign female as well as their children’s life and community (Ryu, 2012). Eventually, the community requires to prepare to accept any conflicts arising from the foreign-born female residents and endeavor for harmonizing with newcomers and existing residents.
According to MOJ statistical data, the largest ethnic group in Korea is Korean-Chinese and Chinese (50.6%), which makes up more than half of the foreign residents. The second largest ethnic group is American (8.09%), while the third group is Vietnamese (7.85%). Other ethnic groups are in order as follows: Thai (5.05%), Filipino (3.08%), Uzbekistan (2.66%), Indonesian (2.48%), Cambodian (2.30%), Japanese (1.71%), and Nepalese (1.57%).
Most foreign-born female residents are involuntary at initial stage on determents residential location selection due to various restrictions such as language barrier and lack of resources. As the
duration period of residency is longer as time passes by, their ability in Korean has improved so they can acquire more information through multiple channels so their range of workplace and housing selection is getting wider. Furthermore, the foreign-born female residents strengthen themselves in a regional area through their own native nationalities network. A variety of race and ethnic groups of foreign-born female are formulating the collective identity by country (Jeong, 2010). To encourage social integration and minimize the social and cultural conflicts for foreign populations, the Korean government initiated a multiculturalism policy in 2005. Some of the programs for effective adaptation include various types of education, welfare programs, and family support facilities as well as services for multi-cultural families and new residents.
Housing can be seen as one of the most important social welfare services that government provides to citizens. The Korean government also supports housing in a variety of formats to the domestic low-income class. However, the housing policy for foreign population in Korea has not been discussed in earnest yet (Park, 2010; Kim 2012). Current housing policies for foreign populations are mainly focused on developed countries, which mean that they do not reflect the challenges that foreign populations are facing today, which include; difficulties of proof of residence visas, differences in the residency of foreigners, and widely varying income differences among multicultural families (Kim, 2012). Therefore, the limitation of existing foreign housing policy is that it is not comprehensive covering the challenges that foreign populations are facing on today.
Few non-government organizations and local governments have individual policies that support the residential amenities of foreigners residing in Korea. However, it is difficult to say that a framework of the housing policy for foreigners has been secured. To perform better social integration with multiple cultures, creativity and openness is essential. Cosmopolitan metropolises like London, New York, and Hong Kong have become thriving as world cities partly because of creativity from multiple cultures and openness (Lin, J. 2005; Elliott, M. 2008; Park & Jeong, 2010).
1.2 Aim
Given the important role of determining residential location selection by the foreign-born female residents in future housing policy, the aim of this study is to examine the preference of foreign population in residential location selection to provide an empirical investigation of the their thoughts and needs to be reflected into the future housing policy.
1.3 Objectives
We first analyzed the main causes of ethnic neighborhood formation indirectly by applying a
comparative analysis using a quantitative survey constructed based on the Analytic Hierarchy Process (AHP) method. Second, we grasped the main causes of living in and ground areas of ethnic neighborhoods by applying the qualitative method approach, using in-depth interviews to capture the needs and complaints of foreign-born female residents. Third, we empirically proposed a housing policy for foreign-born residents by substantially projecting their needs, thoughts, and complaints.
This research is meaningful in two ways: (1) it suggests the development of a direction for comprehensive foreign housing policy for foreign-born female residents and (2) it presents a direction for how to improve urban planning for better social convergence and integration.
1.4 Purpose of Study
Even though, foreign-born female residents have greater impact on local communities than foreign workers and international students since they reside for a longer period of time, they are more influential on local communities because they interact frequently with domestic residents. However, too little attention is given to comparing the residential location selections of domestic and foreign- born residents.
This study attempts to investigate how residential decisions are influenced by socioeconomic, physical, and environmental characteristics in domestic female and foreign-born female residents.
Since it is possible for foreigners to own land and property in Korea, it is important and meaningful to identify the characteristics that go into selecting a residential location. Furthermore, central and local governments can use the data collected from foreign populations to help formulate housing policies that will improve the quality of life of both domestic and foreign-born residents, thereby minimizing the conflicts arising from the domestic and foreign population.
1.5 Research Questions
- Do foreign-born female residents and domestic female residents have different criteria when it comes to selecting a residential area in which to live?
- What factors are most important to domestic and foreign-born residents in selecting a residential location?
- What steps can the Korean government take to improve the quality of life of non-Korean residents?
Hypothetically, we expect that economic factors such as housing cost and investment prospects are the most important factors for both foreign and domestic residents. We hypothesized that foreign residents, however, are more concerned about social factors such as the proximity of friends and relatives, social groups, and the ability to live in a residential location that approximates that of their Korean counterparts. We speculate that the determinants of residential location choice might show a great deal of variations by nationality.
1.6 Outline Methodology
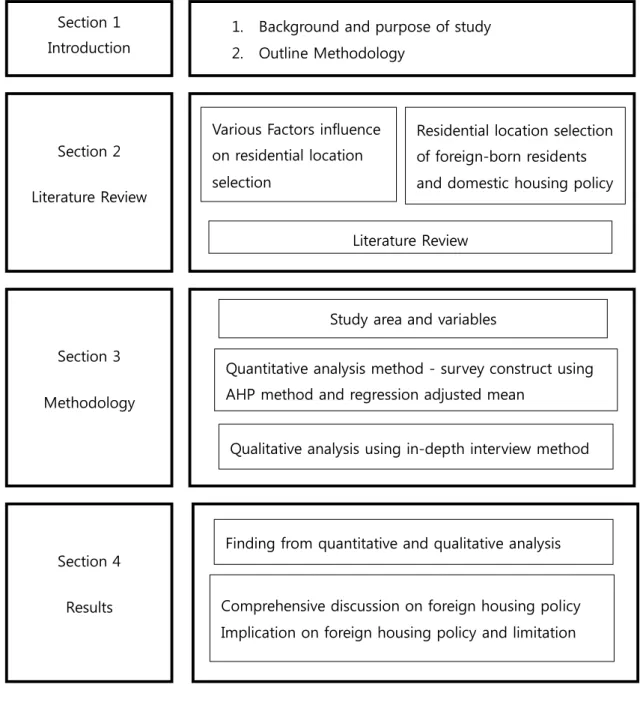
This study is separated into four parts. The first part is offers a review of the previous literature related to the residential location selection of foreign-born residents and the relationship between the residential location selection. The second part illustrates the theoretical structure of the Analytic Hierarchy Process (AHP) method and the process applied to yield the regression adjusted mean. The third part presents the results of the survey and the regression adjusted mean is analyzed to investigate the preference of residential location selection for both domestic female and foreign-born female residents. The fourth part explains and discusses the findings from the in-depth interviews using the results of the survey analysis methods. We end with conclusions and a discussion of implications on foreign housing policy.
Figure 1 Framework of the study
Section 1 Introduction
Section 2 Literature Review
1. Background and purpose of study 2. Outline Methodology
Section 3 Methodology
Section 4 Results
Residential location selection of foreign-born residents and domestic housing policy
Quantitative analysis method - survey construct using AHP method and regression adjusted mean
Literature Review Various Factors influence
on residential location selection
Comprehensive discussion on foreign housing policy Implication on foreign housing policy and limitation
Study area and variables
Finding from quantitative and qualitative analysis Qualitative analysis using in-depth interview method
2. Theoretical framework and literature review
Residential location selection has been an important research field for urban planners and economists. There are large volumes of research on the determinants of residential location selection with varying theoretical frameworks so we focused on two scopes of the literature: 1) Various factors that influence on residential location selection, and 2) Residential location selection of foreign-born residents.
In order to enhance an understanding of the basic concept of residential selection, we focused on main theories for residential location selection that explain residential location selection in urban areas.
They are the ‘Utility Maximization’ and the ‘Tiebout’ theories. The Utility Maximization Theory suggests that when people select housing, they will consider the most beneficial combination of factors to maximize their own benefits (Alonso, 1964). This theory is also known as ‘trade-off’ theory because it literally involves a trade of housing prices against the expenses of travel (Hoang & Wakely 2000). In contrast, other researchers argue that households choose residential locations based on the environmental conditions of the surroundings, including accessibility to health and education systems (Tiebout, 1956; Friedman, 1981; Reschovsky, 1979).
2.1 Various factors that have influence on residential location selection
Taking a comprehensive approach, Rossi explained the decision to re-locate or remain at the current location of residence using two aspects: ‘Push’ and ‘Pull’ (Rossi, 1955). Push factors include crime, pollution, noise, changes in household structure, and other factors that create dissatisfaction for residents. Pull factors include attractiveness of the new residential location and new opportunities like employment, access to public services and recreational activities (Sanchez and Dawkins, 2001).
Residential location selection involves a complicated decision making process and it is a very important matter for residents who will dwell there because it affects them financially as well as changing the daily lives of all family members (Jun 2013). Other scholars like Kirschenbaun (1983) stated that, as applied to residential selection, physical aspects are closely associated with characteristics of the residents as well economic, social, cultural, and environmental elements.
Furthermore, people can only select a residential location based on the knowledge, experience, and information available to them; thus, limited knowledge and limited of alternatives are also constraints in terms of choosing a place to live (Murie 1974; Sinai 2001).
Other factors that influence the selection of residential location include social status, self- image reflections, quality of housing (Marcus, 1995; Hoang & Wakely, 2000; Kenyon & Heath, 2001;
Sirgy, Grzeskowiak & Su, 2005), accessibility to recreational areas and open space (Colwell, Dehring
& Turnbull, 2002; Vogt & Marans, 2004; Kaplan & Austin, 2004), neighborhood characteristics and density (Morrow-Jones et al., 2004, Myers & Gearin, 2001), quality of the schools (Vogt and Marans, 2004; Morrow-Jones et al., 2004, Myers & Gearin, 2001), and preference of the household and other lifestyle factors (Krizek & Waddell, 2002; Walker and Li, 2007; Lee et al., 2008). Montgomery and Curties (2006) reviewed the most recent journal articles (published in 2001 or later) regarding housing mobility and selection, and divided the factors that influence housing selection into four categories: 1) socioeconomic and demographic characteristics like income, and size of household; 2) housing price and affordability; 3) environmental factors like availability and accessibilities to services, and quality of services; and 4) social factors such as ethnicity, social stratification, and feelings of safety.
In summary, these numerous factors can be distinguished into two categories: Internal and External factors. Internal factors are factors like the status of an individual household socio-economically such as income, size, age, ethnicity, ownership of a vehicle, etc. External factors include like characteristics like housing, housing price, location of the neighborhood, and characteristics of the environment.
2.2 Residential location selection of foreign-born residents
The foreign-born population has to face numerous barriers such as cultural differences, language barriers, and adjustments to an unfamiliar environment with limited information and knowledge of Korean culture. Generally, it would be easier for the foreign population to adapt and settle down into the new culture and new environmental conditions if they knew a native born Korean who could assist them with how the system works and help them in finding a house. Therefore, social factors may be more important than internal factors to foreign-born residents.
A number of researchers have closely looked into the impact of race and ethnicity as a key element of social factors affecting foreign-born populations in residential location selection in Europe and the United States (US) (Zavodny, 1999; Keith, 2002; Bayer et al., 2004; Guo & Bhat, 2007).
Zavodny (1999) showed that the presence of other immigrants is the most influential factor in determining immigrants’ residential location selection. The main causes of urban phenomenon can be explained by social factors such as cultural values and social networks. According to Montgomery and Curties (2006), when people buy or rent a place, they obtain a package of goods such as the building features itself, characteristics of the environment, community and social networks, access to work and goods, public services, and local amenities like green space and schools.
Some studies in residential location research have proven that social stratification and
homogeneity of ethnicity are important to foreign-born residents when they are selecting a residential location (Sirgy, Grzeskowiak & Su, 2005). Toussaint-Comeau and Rhine (2004) emphasized that Hispanic immigrants in the U.S. tend to locate themselves within ‘ethnic enclaves’. Lindstom (1997) pointed to the importance of shared values and culture in residential location selection and empirical research continues to examine the influence of these social factors. For example, Gou and Bhat (2006) and Bayoh, Irwin & Haab (2006) have shown that households prefer to reside in a similar structure, size, and class of households as their own in the U.S. This behavior referred to as ‘social effects’
impacts neighborhoods (Ioannides & Zabel, 2008). Social networking, or making social connections, is one of the main factors in residential location selection because it is a channel to mainstream society, or between the native population and the foreign population. Winstanely, et al. (2002) explored the importance of familiarity and social connections in residential location selection and suggested that people are reluctant to re-locate to unfamiliar areas due to the fact that they are already attached to where they currently reside. Moreover, studies of foreign-born residences in the US find that residential location selection is driven by individual taste and preferences, such as black pride, preservation of black institutions, and fear of white majority locations (Ihlanfeldt & Scafidi, 2002).
Also, the characteristics of foreign-born residents, such as status of residency, purpose of stay (i.e.
visit, to work, to live, to study), educational level, language skills and family structure are closely related to their residential location (Bayer et al., 2004; Espenshade & Fu, 1997).
Trends of international marriage have been shifted to urban area from the rural area. A single-man from an urban area has greater opportunities to get married with foreign-born females than a single- man from the rural area because they have stable income. In 2013, areas with highest rate of international marriage (Changwon, Ansan, Suwon and Ulsan) were mostly urban areas located near industrial sites. Also, the foreign-born females prefer the life-style in urban area. Therefore, the foreign-born females prefer coming to an urban area rather than a rural area where many single-man reside surrounding the industrial area (Ryu, 2012).
Most foreign residents are limited at the initial stage on determining residential location selection due to various restrictions such as language barrier and lack of resources. As the duration period of residency is longer as time pass by, their ability of Korean has improved so they can acquire more information through multiple channels allowing their range of workplace and housing selection is widen. However, the residential selection process for foreign-born female immigrants is seen less and is due to the heavy influence of their status of their spouse. Since, they have marriage immigrant residency; living with domestic spouse and related family such as mother-in-law and sister-in-law, they are strongly influenced by the status of their spouse due to his type of job, level of income and education level (Kim, et al,. 2012). Most foreign-born female are staying a longer period than the
average period of foreign workers and international students. As they reside in Korea, they are giving birth and living with their children and that leads to permanent settlement, which they will become a naturalized citizen of Korea. Furthermore, they strengthen themselves with local communities through their own network of country of origin. A variety of race and ethnic groups of foreign-born females are formulating a collective identity by country (Jeong, 2010).
Based on the literature review, we found that there are mixed aspects of foreigner’s residential location selection in terms of social integration and assimilation. Some studies have found that depends on the type of residency, such as foreign worker verse foreign-born female immigrants which have different influencing factors on residential location selection like opportunities of housing, employment and social support, number of children (Hagan, 1998). Espenshade and Fu (1997) highlighted the fact that ethnic communities delays social integration due to limited social networks, constraints on language ability and processes involved in the convergence of multiple cultures.
2.3 Housing Policy for Foreign-born population
There are few studies regarding housing policy for foreign-born residents even though the number of foreign residents continues to grow. There are 1.6 million, representing 3.3 percent of the total population (49 million), dwelling in the country at the end of 2014. Most recent studies mainly focus on the spatial distribution of foreign populations (Park & Jung, 2010; Jeong et al., 2011, Jun et al., 2013, Jeong et al. 2013). These studies partially explain the reasons that foreign-born residents are concentrated in particular areas, which include employment opportunities, low living costs, and the presence of foreign schools and facilities. Other studies have emphasized the necessity of housing policy for foreign-born residents by tenancy conditions (Jang, 2001). Jang (2001) separated the foreign residents’ income levels into different three classes based on their preference of housing type.
High-income class foreigners prefer a detached house, middle-income classes tended to reside villa, and low-income classes prefer to live in apartments. He highlighted that most foreigners are paying the rent fees up front for one year (or sometimes up to three years in advance) without deposits.
However, these rent fees are high compared to average market values, so it is necessary for housing policy to intervene between landlord and tenant.
Based on the housing survey conducted on the foreign-born population that resides in Ansan, Korea, Park (2012) urged that the foreigner’s ‘Rate of three or more people living in the same room’ is 10.16%
which was very high compared to the domestic rate (0.27%), indicating that the foreigner’s condition of living is poor. He suggested that housing policy should address the number of occupants in the residency as well as the income levels of foreign-born multicultural families. Furthermore, foreigners
are ineligible to access public housing since they are not authorized to have a resident registration number approving the household while domestic residents are (Park, 2012; Kim, 2010; Jang, 2001).
Overall, the literature review can be summarized as follow: 1) ethnic, racial and social factors are important factors when selecting a residential location; and 2) new foreign populations are likely to reside closer to people from their country of origin in foreign residential areas.
2.4 Analytic Hierarch Process (AHP) Method
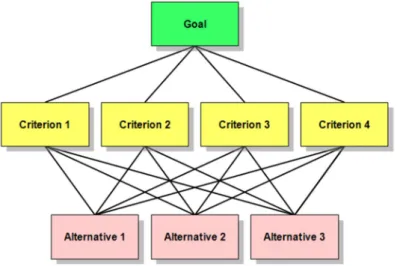
The Analytic Hierarch Process (AHP) is a hierarchy decision-making process for analyzing and organizing complicated decisions. It uses paired comparisons with psychology and mathematics as shown in Fig 2. Originally, it was developed by Professor Thomas L. Saaty in the 1970s (Saaty, 1970) to help select the most suitable alternative to meeting goals.
FIGURE 2 Analytic Hierarch Process (Sander, 2007)
The AHP technique has been adopted in various housing choice studies. However, the majority of these studies have focused on only domestic residents. Chung and Shin (2002), for example, studied the priorities that influence residential selection but limited the study to domestic residents who live in apartments. Cho and Park (2002) used the AHP technique to find the preferences of domestic university students for their future house locations. Kim (2012) applied AHP to analyze housing determinations by residents who live in Seoul. Choi (2004) used AHP and factor analysis to find the satisfaction standard of domestic residents who live in apartments and this study focused on an expert group. Overall, there are not many studies conducted regarding the preferences of foreign-born residents in terms of determining residential location selection.
Distinctions of this research from existing studies
This study has two purposes that distinguish it from the previous literature on residential location selection by foreign-born female residents in Korea. First, this research attempts to identify how residential decision-making is influenced by socio-economic, social, and environmental characteristics among both domestic females and foreign-born females by using a quantitative approach with the AHP analysis method. Second, a qualitative method was applied to supplement the results of the quantitative data by conducting an in-depth interview to identify the foreign-born female’s needs in terms of residential location selection.
3. Methodology
3.1 Study Area
The study area for this research was Ulsan Metropolitan City, the seventh largest metropolis in South Korea (hereafter Korea) with a population of over 1.16 million (Density 1,100/km2). Ulsan is located in the Southeastern part of the country, between the Busan to the south and the Gyeongju to the north.
Ulsan administrative divisions are separated into one county (gun) and four districts (gu). Ulsan is the industrial oriented area of South Korea. In the Ulsan Industrial District, there are automobile assembly plants operated by the Hyundai and KIA car manufacture companies, Hyundai Heavy Industries (HHI) operating the shipyard and SK Energy operating the oil refinery.
Currently, Ulsan has the highest GDP per capita in South Korea, higher than the U.S. and comparable to Luxembourg.
FIGURE 3 City of Ulsan
3.2 Sample
Registered foreign populations in Korea and Ulsan City
Table 1 shows the foreign populations registered in Korea and Ulsan City. The table shows that the
number of foreign populations in Korea is increasing continually.
TABLE 1 Number of foreign born resident in Ulsan City (MOJ, 2014)
Table 2 shows that the type of foreign residents in Korea and Ulsan City. All types of foreign residents are increasing in both Korea and Ulsan City, which suggests that as the size of the foreign population increases, the types of foreigners will also increase proportionally.
TABLE 2 Types of foreign residents in Korea and Ulsan City (MOJ, 2014)
TABLE 3 Nationality of foreign marriage immigrants in Korea (MOJ, 2014)
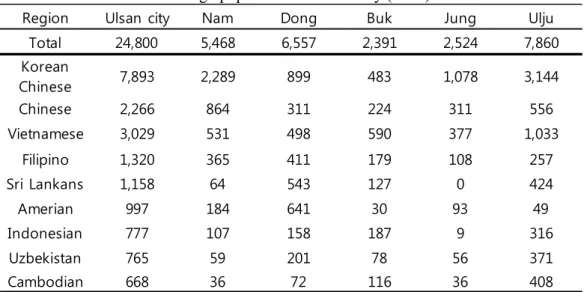
Table 4 illustrate that there are many Korean Chinese and Chinese in Ulsan City. Sri Lankans, individuals from English speaking countries, Indonesians, Uzbekistanis and Cambodians are residing in different proportions depending on each region. The table indicates that foreign residents from different nationalities tend to cluster into distinct regional areas.
TABLE 4 Nationalities of foreign population in Ulsan City (2014)
Ulsan City is separated into five administrative areas: four districts (gu) and one county (gun). We
2009 2010 2011 2012 2013 2014
Ulsan city 14,961 16,043 18,421 19,247 22,427 24,800
Korea 1,168,477 1,261,415 1,395,077 1,445,103 1,576,034 1,628,771
Total Foreign Workers Foreign marriage Overseas Korean Illegal alien
Korea 1,628,771 610,358 152,278 692,605 192,911
Ulsan (2014) 24,800 11,639 3,025 4,747 unknown
Last year (%) 2.80% 7.50% 1.10% 20.00% 5.00%
Nationality Total Chinese Korean-Chinese Vietnamese Japanese Filipino Thai Cambodian Monglian Others Total 152,278 61,353 25,091 40,515 12,508 11,042 2,673 4,715 2,407 17,065 Female 129,654 49,260 17,612 39,926 11,297 10,728 2,606 4,699 2,327 8,811
% 85.14 80.29 70.19 98.55 90.32 97.16 97.49 99.66 96.68 51.63
Region Ulsan city Nam Dong Buk Jung Ulju
Total 24,800 5,468 6,557 2,391 2,524 7,860
Korean
Chinese 7,893 2,289 899 483 1,078 3,144
Chinese 2,266 864 311 224 311 556
Vietnamese 3,029 531 498 590 377 1,033
Filipino 1,320 365 411 179 108 257
Sri Lankans 1,158 64 543 127 0 424
Amerian 997 184 641 30 93 49
Indonesian 777 107 158 187 9 316
Uzbekistan 765 59 201 78 56 371
Cambodian 668 36 72 116 36 408
looked at each administrative area to see how foreign-born residents were dispersed throughout them.
Distribution of foreign population in Ulsan City
The foreign population in the Nam district of Ulsan shows a similar demographic profile as that of Ulsan City in general. The foreign population of the Nam district is primarily composed of Korean- Chinese, ethnic Chinese, Vietnamese, and Filipino as well as English speakers from the U.S., Canada and the U.K. We postulate that English speakers who chose to reside in Nam did so due to the schools and other educational facilities for which this district is renown.
In Dong district, there are many Korean-Chinese as well as individuals from English speaking countries. The Buk district is primarily composed of Asian and South-East Asian residents such as Vietnamese, Indonesian and Filipinos. There are far fewer English speaking residents living in the Buk district compared to the Dong district. Noteworthy is the fact that there exists a large Vietnamese community followed by Korean Chinese, Indonesian and Filipino communities in the Buk district. In Jung district, the foreign population is primarily composed of Korean-Chinese, Vietnamese, Chinese, Filipinos as well as many English-speaking nationals.
Ulju County (gun) houses a broad demographic of foreign residents. They include Korean-Chinese, Vietnamese, Sri Lankans, Cambodians, Uzbekistanis, Indonesians and Filipinos and small number of residents from English speaking countries.
3.3 Recruiting methods Quantitative method: Survey
We have collected a total of 416 respondents (domestic females 167 and foreign-born females 249) who are aged in their 20s, non-students and residing in Ulsan Metropolitan City, Republic of Korea were recruited in 60 days conducting period between August and September 2014 through the multiple channels and various organizations (i.e. religious groups, foreign social meeting groups, public sectors like multicultural family center and the global center, private sectors like individual company) to carried out the survey. Furthermore, we attended a number of international open-festivals to conduct the survey as well. All participants provided a brief background explanation of the study.
Ethical approval to conduct the study was provided by the host institution ethics committees.
TABLE 5 Total population respondents from the survey
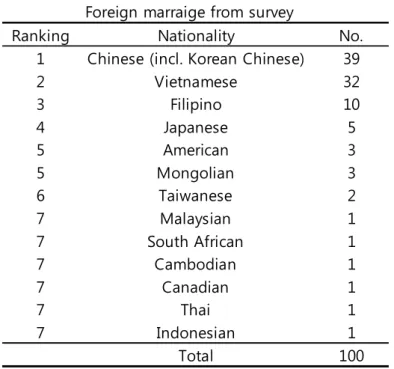
Table 6 shows the valid survey respondents’ nationalities. The top five nationalities represented in the survey were Chinese (including Korean-Chinese), Vietnamese, Filipino, Japanese and American. This outcome is reasonably similar to the registered foreign population in Ulsan City reputed by the 2014 MOJ report.
TABLE 6 Foreign population respondents from the survey
Qualitative method: In-depth interview
We confirmed our arranged interview dates and times over the phone and visited the multicultural families’ support facilities. In total, twenty-two foreign-born female residents in Ulsan, Korea were interviewed. Twenty-one interviewees were conducted by face-to-face methods and one interviewee was done by telephone due to the participants’ personal reasons. We told them the nature of the proposed interview and explained the background to help their understanding of this study.
3.4 Socio-economic characteristics and Demographic variables Survey Collected Valid Invalid
Domestic 167 75 92
Foreign 249 100 149
Total 416 175 241
Foreign marraige from survey
Ranking Nationality No.
1 Chinese (incl. Korean Chinese) 39
2 Vietnamese 32
3 Filipino 10
4 Japanese 5
5 American 3
5 Mongolian 3
6 Taiwanese 2
7 Malaysian 1
7 South African 1
7 Cambodian 1
7 Canadian 1
7 Thai 1
7 Indonesian 1
Total 100
The survey collected the individuals’ socio-economic characteristics on nationality/national origin, marital status, number of children, car ownership, occupation, household income, occupied area, type of residence and type of house ownership.
For statistical analysis, the nominal value of individual characteristics such as domestic/foreign population was converted to a binary variable, as follows: foreign (1), car ownership (car 1), type of residence (apartment 1) type of house ownership (self-owned 1).
Nationality/national origin was distinguished into two groups. Age and household income were treated as categorical variables. Age was divided into six categorical values: 20s, 30s, 40s, 50s, 60s and +70s. Household income was converted into two categorical values: less than KRW 1 million and more than 1 million. All four factors (architectural, economic, environmental and social) that influence residential location selection were treated as dependent variables.
3.5 Quantitative Analytical method
For the quantitative analysis, we constructed a survey about the importance of the four factors for decision making in residential location selection using the Analytic Hierarchy Process (AHP) method.
The survey was administered to domestic and foreign residents who are aged in their 20s, are non- students and are potential seekers for housing in Ulsan.
In the survey, participants were asked to fill out socioeconomic characteristics about their nationality/national origin, marital status, number of children, car ownership, occupation, household income, occupied area, type of residence and type of house ownership. For individual preferences regarding residential location selection, participants were asked to choose the most important factors by pair-wise comparisons. We applied an analytic hierarchy approach to examine the determinants of the domestic and foreign population’ residential location selection. Further, we supplemented the results of the quantitative analysis method by conduct an in-depth interview of the survey participants.
To identify the individual preferences on residential location selection, we characterized the residential location selection decision-making into a hierarchy of criteria and alternatives using AHP analysis.
3.5.1 Constructing the Survey using AHP Method
The Analytic Hierarch Process (AHP) (Saaty, 1970) is one of the multiple criteria decision-making
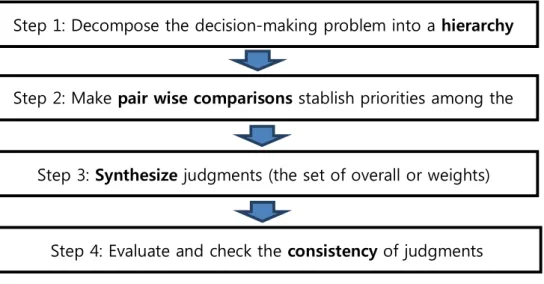
methods developed by Professor Thomas L. Saaty. It is a very powerful and flexible decision making process that is helpful in setting priorities among criteria and alternatives and making the best decision when both qualitative and quantitative aspects of a decision need to be considered. AHP simplifies preference ratings among decision criteria using pair wise comparisons, and it provides measures of judgment consistency (Bunruamkaew, 2012). Figure 4 shows the AHP process analysis.
FIGURE 4 Decision making process using AHP analysis (Bunruamkaew, 2012)
To make sure that the original preference ratings were consistent in the AHP analysis, a consistency analysis was used to calculate the consistency ratio (CR). First, we computed the consistency index (CI) and then divided by the random index (RI). In practice, a CR of 0.10 or below is considered acceptable as recommended by Saaty (Saaty, 1970).
CR = CI / RI
Consistency Index (CI), measures the deviation
= − −
First, we multiplied each column of the pair wise comparison matrix by the corresponding weight.
Second, we divided the sum of the row entries by the corresponding weight. Lastly, we computed the average of the values from step 2, and denote it by λmax, where n is the number of criteria and λmax is the biggest eigenvalue of the matrix. λ is calculated by averaging the value of the Consistency Vector and the Consistency Vector was calculated by multiplying the pair-wise matrix by the weights vector (Bunruamkaew, 2012).
Step 1: Decompose the decision-making problem into a hierarchy
Step 2: Make pair wise comparisons stablish priorities among the
Step 3: Synthesize judgments (the set of overall or weights)
Step 4: Evaluate and check the consistency of judgments
Random Index (RI), the CI of a randomly-generated pair wise comparison matrix
Notes: n = order of matrix, Random index for n = 10 (Saaty, 1970)
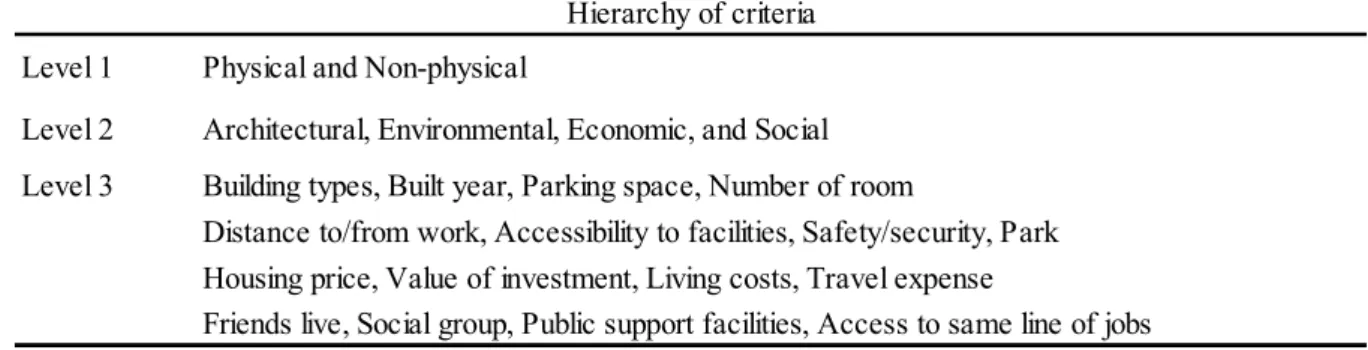
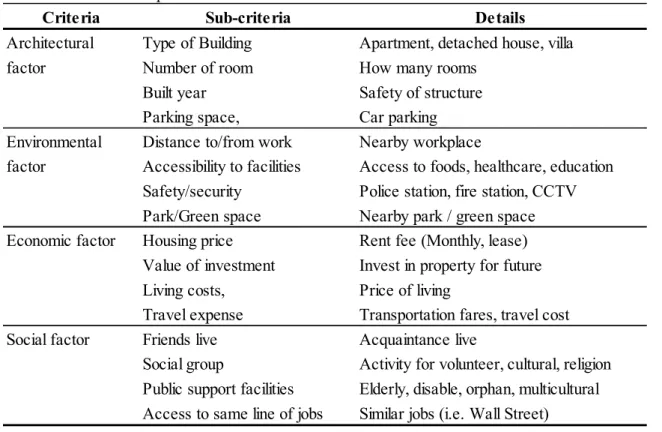
We have created a pair-wise comparison questionnaire about the influential factors on residential location selection by separating it into three levels as shown in Table 7. Table 8 shows all the elements in each factor.
TABLE 7 Hierarchy of criteria for individual preference on residential location selection
TABLE 8 Factor description of residential location selection
n 1 2 3 4 5 6 7 8 9 10
RI 0 0 0.58 0.9 1.12 1.24 1.32 1.41 1.46 1.49
Level 1 Physical and Non-physical
Level 2 Architectural, Environmental, Economic, and Social Level 3 Building types, Built year, Parking space, Number of room
Distance to/from work, Accessibility to facilities, Safety/security, Park Housing price, Value of investment, Living costs, Travel expense
Friends live, Social group, Public support facilities, Access to same line of jobs Hierarchy of criteria
Criteria Sub-criteria Details
Architectural Type of Building Apartment, detached house, villa
factor Number of room How many rooms
Built year Safety of structure
Parking space, Car parking
Environmental Distance to/from work Nearby workplace
factor Accessibility to facilities Access to foods, healthcare, education Safety/security Police station, fire station, CCTV Park/Green space Nearby park / green space Economic factor Housing price Rent fee (Monthly, lease)
Value of investment Invest in property for future
Living costs, Price of living
Travel expense Transportation fares, travel cost
Social factor Friends live Acquaintance live
Social group Activity for volunteer, cultural, religion Public support facilities Elderly, disable, orphan, multicultural Access to same line of jobs Similar jobs (i.e. Wall Street)
FIGURE 5 Hierarchy Analysis model of residential location selection
We constructed a questionnaire a using three-point Likert scale, ranging from equal importance (1), very important (2) and a very strong importance (3) of one factor over another for pair-wise comparisons, as illustrated Fig. 6.
A
'A' is important than 'B'same 'B' is important than ‘A'
B
Physical 3 2 1 2 3 Non-physical
FIGURE 6 Sample of pair-wise comparisons
Respectably, the questionnaire was translated into seven different languages to conduct the survey.
The languages were English, Filipino, Chinese, Japanese, Russian, Vietnamese and Indonesia. The survey was administered to those above 20 years of age who reside in Ulsan, and are non-students and potential seekers for housing between August and October 2014.
3.5.2 Principal Component Analysis (PCA)
The four characteristics economic variables (car ownership, household income, type of residence and type of house ownership) were calculated using principal component analysis (PCA) to condense these variables into a single factor. They were nominated because we found that they were the most highly significantly confounders in terms of socioeconomic characteristics between domestic and
foreign population groups. We used STATA SE 12.1 to compute a single factor based on the four economic characteristic variables. Given the calculated value of PCA, we predicted economic scores, which were then converted into two groups.
3.5.3 Estimating adjusted preferences
We used adjusted means by regression to control for socioeconomic and demographic factors such as foreign, ages, socio-economic status (income, car ownership, type of residence and type of house ownership). The value of the adjusted mean is the predicted value from a regression equation, adjust function is able to create predictions assuming certain values for some of the independent variables.
In contrast, the unadjusted mean value is a simple linear regression of X on Y with no other covariates, whereas, the adjusted mean value is the same regression of X on Y in the presence of at least one covariate, and which are the group means adjusted for control potential confounding variables.
Regression adjusted means were used to control potential confounders. In this case, the confounders that were taken into account were age, foreign and status of economic.
First, we examined in detail how the factors of residential location selection are different between domestic and foreign populations based on a t-test unadjusted means value. Second, we conducted an adjusted mean by regression to determine how factors are different between domestic and foreign populations when they are determining a residential location. Lastly, we conducted analysis by comparing and contrasting analyzed results from the first and second steps to distinguish how foreign populations are distinct from domestic. The analysis was conducting using STAT SE 12.1.
3.6 Qualitative method: In-depth Interview
The fieldwork for the thesis included a survey with both domestic female residents and the foreign- born female residents who reside in Ulsan Metropolitan City. Further, we supplemented the results of the survey analysis by conducting semi-formal in-depth interviews of the foreign female residents who participant in the survey. Seven questions were included in the interviews. Each question was formulated based on the issues arising from the survey results in conjunction with the research objectives.
The first question was meant simply to put four factors in order of importance when determining residential location selection (e.g. architectural, economic, environmental, and social). The next four questions were split into two parts. The first part, which will be discussed individually, simply asked whether participants though the answer was ‘important’ or ‘not important’. In the second part, the respondents explained their thoughts and opinions about their answer. For the last two questions, the respondents explained or suggested their opinion regarding social factors in terms of housing policy in Korea.
TABLE 9 List of in-depth interview questions
No. Details
Q 1 Put four factors in importance order for determine residential location selection.
A - Architectural, B- economic, C- environmental, D - social factors Q2 Is Social factors are importance on residential location selection?
Q3 Is social meeting groups are importance on residential location selection?
Q4 Is Public support facilities are importance on residential location selection?
Q5 Do you consider the location of public support facilities when you looking for a house?
Q6 How to improve the quality of service for public support facilities?
Q7 Is there any comment or suggestion and recommendation that you would like to tell the Korean government regarding Housing policy issues to make better housing policy for foreign-born residents?
4. Results
4.1 Descriptive statistics
From the survey, we have collected a total of 416 questionnaires (Domestic 167 and Foreign 249) participants were residents in Ulsan, 175 appears as valid records (42.1%). Out of 175 valid survey results, domestic 75 and foreign is 100.
For validation process, once we collected the survey, we analyzed the validity of the survey based on the AHP method using Excel to evaluate and check the consistency of respondents’ judgments. Saaty (1970) suggested, that if the value of Consistency Index (CI) is ‘below (< 0.10)’, then the result of survey is consistent enough, however, if the value of CI is ‘larger than > 0.10’, then the result of survey is not consistent, therefore, need to revise the comparisons in further.
Table 10 presents the survey result of the socio-economic characteristics of domestic and foreign-born female respondents living in Ulsan. Married respondents outnumbered non-married respondents at a ratio of nearly 2 to 1. Respondents who possessed a vehicle were also significantly higher than those who did not. Respondents were also much more likely to live in and own apartments than in other types of residential dwellings. The proportion of monthly household income was roughly equal for both domestic and non-domestic residents. Household income was measured in Korean won (KRW).
TABLE 10 Socio-economic descriptive of Domestic and Foreign population
The rate of married foreign-born respondents was more than two times that of non-married respondents. There were slightly more respondents who did not have children than those who have a child or children. Vehicle ownership among foreign residents is slightly higher than non-ownership of a vehicle.
Variable Categories Domestic Foreign
Total sample 75 100
Marital Status Married 44 85
Non-married 31 15
Car ownership Yes 50 55
No 25 45
Number of Children None 39 54
1 10 34
2 22 10
more than 2 4 2
Ages 20s 22 35
30s 21 45
40s 13 15
50s 12 5
60s and more 7 0
Employment Yes 46 19
No 29 81
Monthly income I 〈 100 27 65
(Kor Man\) 100 < I 48 35
Type of residence Apartment 46 56
Non-apartment 29 44
Type of house ownership Self-owned 65 37
Not self-owned 10 63
The number of foreign-born respondents with a household income of less than 1 million KRW was double that of respondents who had an income of over 1million KRW. Household income is an extremely important indicator because it is positively correlated with vehicle and property ownership:
As shown in Table 11, among domestic residents is higher than that of foreign residents while, home ownership among foreign residents is significantly lower than domestic survey respondents. With respect to the type of residence, foreign-born residents were more likely to reside in non-apartment dwellings than domestic residents.
TABLE 11 Socio-economic factors of Domestic and Foreign population
The survey results also indicated that domestic residents were more likely to be married than foreign- born residents. In addition, the domestic residents were more likely to have children, owned house and older than the foreign-born residents.
4.2 Analytic Hierarchy Process (AHP)
AHP Consistency Ratio
Consistency index (CI) values and consistency ratios (CR) were calculated as shown in Table 13. The CI values of five comparisons were lower than 0.10 in the study, indicating that the use of the weights presented in Table 13 were appropriate (Saaty, 1970).
TABLE 12 Consistency Ratios of Factors
Tables 13 and 14 present the weighted results of the AHP, showing the weight of residential location selection for domestic and foreign respondents.
Dep. Variable
t value
Age 3.34**
Married 3.89**
Income 3.73**
Car 1.57*
Apartment 0.48
Self-owned House 7.94**
Domestic (n=75) Foreign (n=100)
Mean Mean
34.8 29
0.41 0.15
1.93 1.50
0.67 0.55
0.61 0.56
0.87 0.37
*p<0.05; **p<0.01
Category Overall Architectural Economic Environmental Social
Consistency Ratio (CR) 0.037 0.041 0.037 0.035 0.033
TABLE 13 Weight of residential location selection for Domestic residents
TABLE 14 Weight of residential location selection for foreign residents
From Figure 7, for level 1, the domestic female residents and foreign-born residents both indicated that physical have a greater weight than non-physical but the foreign-born residents shows that non- physical is slightly higher than the domestic residents.
For level 2, environmental and economic factors are mostly important for both groups, followed by social and architectural factors. Generally, both domestic and foreign-born residents tend to favor similar residential locations. The domestic residents significantly indicated that environmental are more important than foreign-born residents, however, foreign-born residents strongly indicated that
category weight(a) category weight(b) category weight(c) Building type 0.2496
No. of room 0.2111 Built year 0.2799 Parking space 0.2593 Distance to/from work 0.2407 Access to facilities 0.2255 Safety/security 0.2959 Green space 0.2379 Housing price 0.2568 Investment 0.2867 Living costs 0.2357 Travel expense 0.2207 Friends live 0.2877 Social group 0.2007 Public support facilities 0.2536 Access to similar job 0.2579 Physical 0.511
Architectural
factor 0.4455
Environmental
factor 0.5545
Non-phsycial 0.489
Economic
factor 0.5289
Social
factor 0.4711
category weight(a) category weight(b) category weight(c) Building type 0.2425
No. of room 0.2557 Built year 0.2538 Parking space 0.2480 Distance to/from work 0.2501 Access to facilities 0.2403 Safety/security 0.2741 Green space 0.2355 Housing price 0.2505 Investment 0.2331 Living costs 0.2629 Travel expense 0.2535 Friends live 0.2582 Social group 0.2235 Public support facilities 0.2509 Access to similar job 0.2674 Physical 0.5050
Architectural
factor 0.4674
Environmental
factor 0.5326
Non-phsycial 0.4950
Economic
factor 0.5309
Social
factor 0.4691
architectural factors are more important domestic residents.
FIGURE 7. Comparion of Level 1 and 2 weigth between the domestic and foreign residents
However, priority of elements for domestic residents and foreign-born residents were slightly different at level 3. For architectural factor, the domestic considered the ‘Built year’ is most important factor but the foreign considered the ‘Number of room’ is most important. In terms of environmental factor, the Feeling safety/security’ was top priority for both groups but least important element was the ‘Access to facilities’ for domestic and ‘Green space’ for foreign. For economic factors, many domestic born residents tend to give greater weight to investment, but most foreign residents tend to give greater weight to the living costs. For social factor, ‘Where friends live’ was most important to the domestic and the ‘Access to similar job’ was most important to the foreign-born residents.
Based on the results of Figure 7, it is possible to conclude that domestic and foreign-born residents have similar characteristics in generally with regards to residential housing locations before adjusting mean values. However, both groups have a different preference on the residential location selection in details as we can see from the figure 8 and 9 Level 3 weight.
0.40 0.42 0.44 0.46 0.48 0.50 0.52 0.54 0.56 0.58
Physical Non-Physical Architectural Environmental Economic Social
Level 1 Level 2
Level 1 & 2 weight
Domestic Foreign
FIGURE 8. Comparion of Level 3 weigth between the domestic and foreign residents
4.3 Adjusted mean by regression
Adjusted mean by regression was applied to control potential confounders. Confounders that were taken into account were age, status of employment and household income.
4.3.1Domestic vs Foreign
Tables 15 and 16 showed the results of the domestic female residents and foreign-born female residents adjusted mean by the regression.
0.15 0.17 0.19 0.21 0.23 0.25 0.27 0.29 0.31
Building type No. of room Built year Parking space Distance to/from work Access to facilities Safety/security Green space Housing price Investment Living costs Travel expense Friends live Social group Public support facilities Access to similar job
Architectural
factor Environmental
factor Economic
factor Social
factor
Level 3 weight
Domestic Foreign