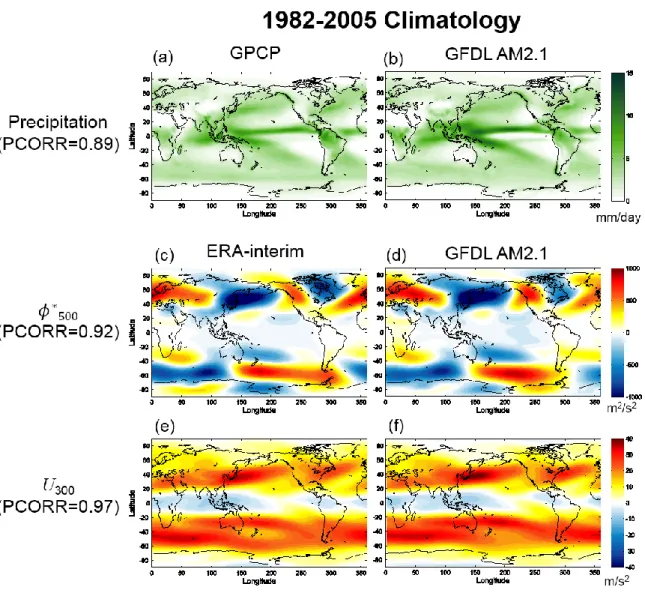
Longitudinally limited thermal forcing has been described in different latitude bands in the Northern Hemisphere. Tropical Pacific forcing features an El Nino-like pattern in the tropical Pacific, while tropical Atlantic forcing features a La Nina-like pattern. The effect of tropospheric warming in the Pacific spreads to the Atlantic, due to the weak temperature gradient.
Introduction
CMIP5 climate simulations show that greenhouse gases and aerosols cause similar spatial patterns of precipitation change [Xie et al., 2013]. The zonal atmospheric energy budget is responsible for the regional understanding of precipitation in the Sahara [Swann et al., 2014; Boos and Korty, 2016]. Similar cooling in the Southern Ocean causes a large northward shift in UCLA-CGCM, but a small shift in NorESM [Mechoso et al., 2016].
Model description and experimental design
Models
Experiment setup
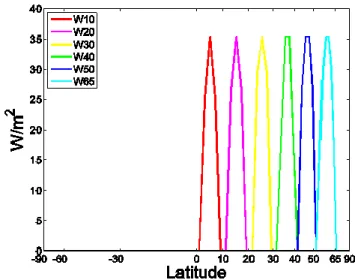
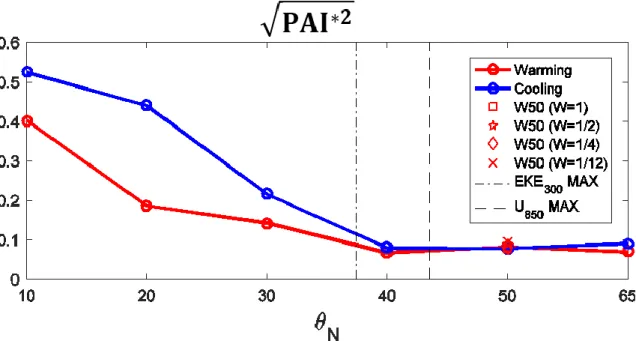
Since 𝜃𝑆 is varied, W is adjusted to ensure that the global mean H is the same. Note that Seo et al. 2014) adjusted A instead of W, making it unclear whether a stronger local temperature response to extratropical forcing than to tropical forcing was due to the stronger local forcing (i.e., larger. The experiments are named based on the northern boundary of the forcing (𝜃𝑁) as in Fig.
Model control climatology (CTL) is calculated as the 60-year average after 8 years of spin-up. The perturbed experiments started from an arbitrary day after the spin-up period of the control experiment. Perturbed experiments are run for 20 years and the first 5 years are discarded as spin-up.
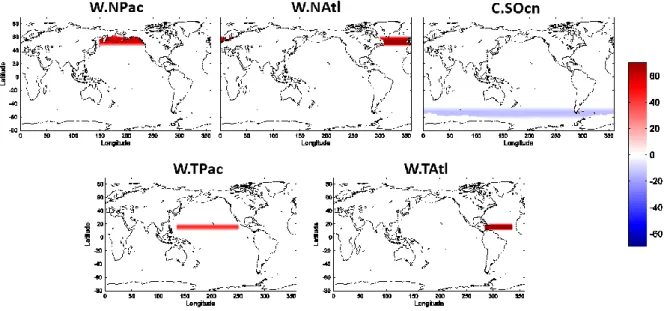
For example, W.NPac indicates the forcing located at the northern high latitude Pacific with a warming effect, and C.TAtl indicates the forcing located at the tropical Atlantic with a cooling effect. The amplitude (𝐴) of the forcing varies from 14 to 105 W/m2 according to the size of the respective basins, ensuring the same amount to 0.4 PW. The amount of forcing is somewhat extreme, but it is acceptable to capture the signal of climate response, the predominant amplitude of extratropical forcing, such as AMOC collapse, which induces a change in equatorial ocean heat transport of 0.3 PW in the Atlantic [Zhang and Delworth, 2005; Cheng et al., 2007] and the amplitude of the tropical forcing, such as the decadal variability of the total ocean heat transport of ENSO, is about 0.2 PW [Hazeleger et al., 2004; Hazeleger et al., 2005].
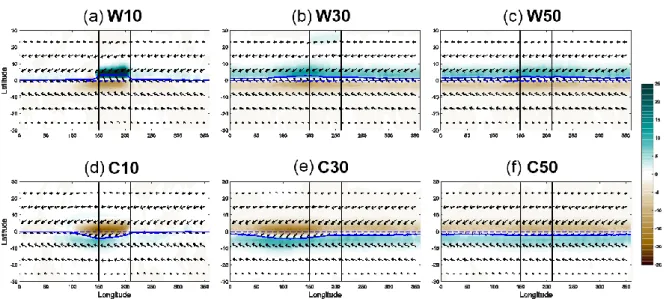
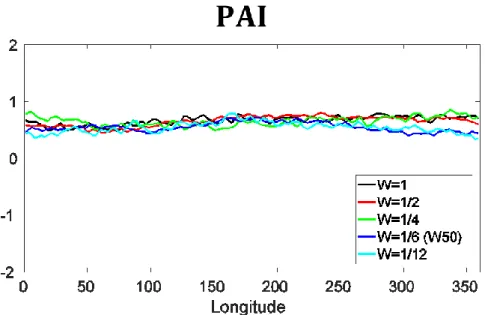
Distribution of imposed surface influence (W/m2) of high-width cases (top panels) and tropical enclosures (bottom panels).
Results
Tropical climate response to localized forcing in an aquaplanet simulation
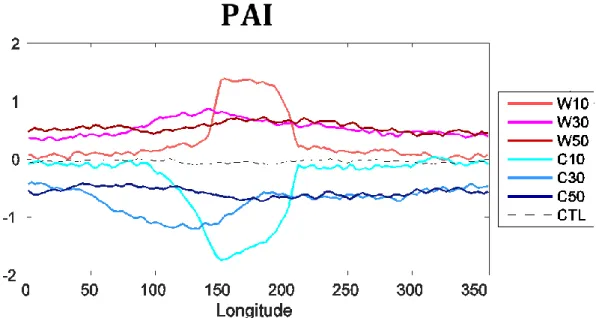
The tropical precipitation response is more localized in the tropical forcing (e.g., W/C10 and 30) compared to the high-latitude forcing (W/C50) for the warming and cooling experiments, as shown in Figs. Additional experiments were conducted to determine whether the tropical rainfall response is due to changes in the magnitude of the extratropical forcing. Although the high-latitude response varies with the location of the forcing, the responses in the tropical climate are very similar at the global scale, as shown in Fig.
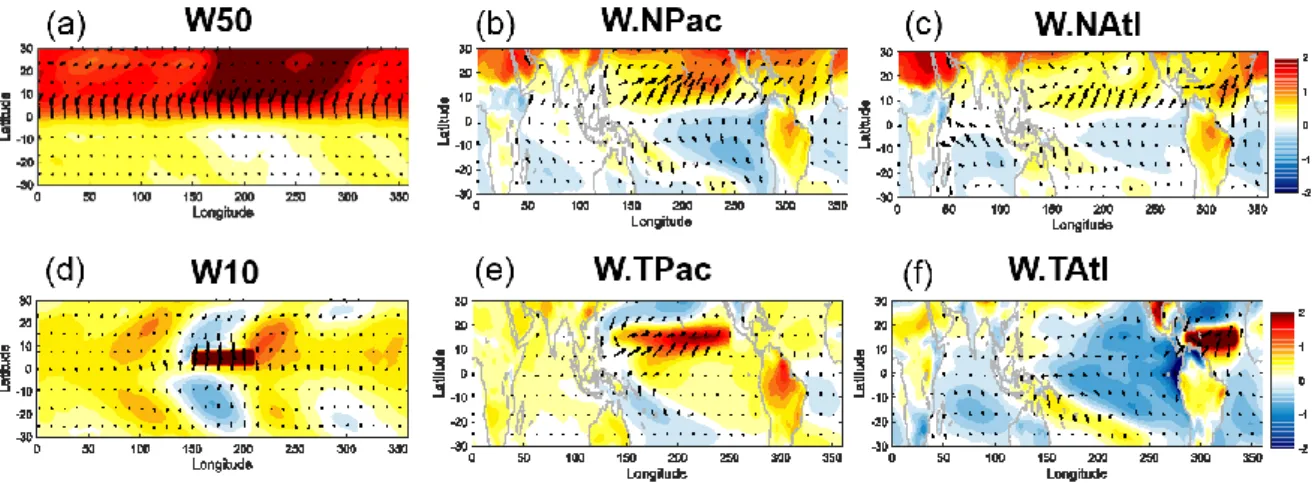
The anomalous wind strengthens (weakens) the easterly outside (inside) the forcing region. Especially on the western side of the forced region, W10 shows strong warming response, but W.TPac and W.TAtl show strong cooling. The cold anomaly in the eastern tropical Pacific increases the zonal asymmetry of the SST profile, which strengthens the Walker circulation as shown in Fig.3.3.7c.
The criteria may cause the upper tropospheric warming in the tropical Pacific region to be induced by surface forcing following moist adiabat. Thus, the negative feedback from the SW CRE induces anomalous cooling in the South Atlantic as shown in Fig. A number of previous studies have indicated that the effect of localized extratropical forcing is nearly zonally symmetric in the tropics, whereas the tropical response to the localized tropical forcing is strongly zonally asymmetric.
The tropical response is homogenized in experiments where the localized forcing is positioned poleward by about 40°, which is the position of the extratropical jet and the strongest eddy kinetic energy. Thus, the tropical response to the extratropical forcing is zonally symmetric, resulting in a meridional shift of the ITCZ to the warmer hemisphere with an enhanced zonally mean Hadley circulation in the cooler hemisphere. This cold anomaly in the eastern Pacific strengthens the zonal asymmetry of the tropical Pacific SST climatology, which in turn strengthens the Walker circulation.
Tropical climate response to extratropical forcing at different locations
Tropical climate response to tropical forcing at extratropics vs tropics
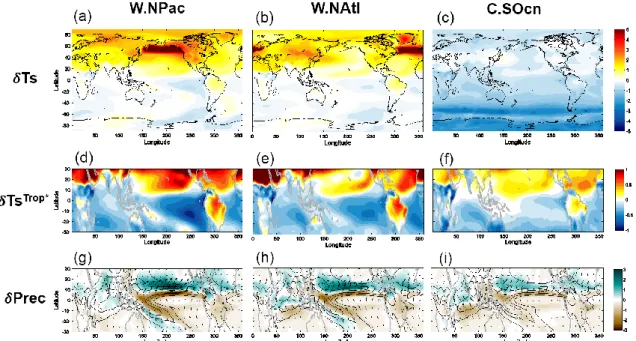
In the inner tropics, the surface pressure anomaly pattern is zonally asymmetric and confined to each basin (Figures 3.3.1c-d). The response of surface temperature (a-b) in the globe, surface temperature (shadow) and surface pressure (contours) and precipitation (e-f) in the tropics (30°S-30°N) from W.TPac (left column), and W.TAtl ( right column). The extratropical forcing induces a relatively zonally symmetric response of surface temperature and wind following the mean easterly field (Fig. 3.3.2a-c).
The term on the left-hand side is the conservation term (or tendency term), which is close to zero or the forcing imposed in the quasi-equilibrium tropics. Surface temperature response (top panels) and summary of the whole surface energy budget attribution (bottom panels) with their spatial model correlation value in W10 (a,d), W.TPac (b,e ) and (c, f) W.TAtl. In the W50 case, the SST response on the southern side of the ITCZ is still positive even though the WES effect is negative due to the strong shortwave cloud radiative heating effect, while both the SST responses of W.NPac and W.NAtl show negative.
The controlling climatology of low-level wind in the deep tropics is eastward at every zonal location in aquaplanet simulation, so the low-level convergence causes easterly decreases on the western side of forced area. The attribution of (Top panels) evaporation considering the change of wind and (Bottom panels) shortwave cloud effect in W10 (a,d), W.TPac (b,e) and (c,f) W.TAtl. This can be understood as strong SW CRE feedback to significantly cool that region, causing the high pressure system in the region (Fig. 3.3.6e).
In the tropics, there should be a weak temperature gradient in the upper troposphere due to the low Coriolis force [ Sobel et al ., 2001 ]. Therefore, the contrasting zonal asymmetry affects the zonally averaged responses, which the interhemispheric tropical rainfall asymmetry between W.TPac and W.TAtl is similar to (Figure 3.3.8c). In response to the extratropical forcing, the positive SW CRE feedback in the extratropics was compensated by the negative SW CRE feedback in the tropics, causing each radiative component to differ between the extratropical and tropical forcings (Figure 3.3.9).
Conclusion and Discussion
Thus, the tropical Pacific heating produces cooling on the western subtropics and maritime continents and more warming on the eastern side of forcing with decreased easterlies. The zonal asymmetry of warming weakens the Walker circulation with warming of the upper troposphere resembling El-Nino-like atmospheric pattern. After weak temperature gradient, the tropospheric warming may affect the tropical Atlantic region with uniform warming.
However, the vertically stable heating profile increases the low cloud amount in the southern tropical Atlantic due to the abundance of low cloud in this region. The shortwave cloud effect breaks the hemispheric symmetry in the tropical Atlantic and causes a cold anomaly and a northward shift of the ITCZ. In this forcing area, a low pressure system produces anomalous northerly winds that bring cold and dry air into the eastern tropical Pacific.
A cold anomaly in the eastern Pacific Ocean increases the amount of low cloud cover over the Peru Ocean Basin, increasing the cooling. The increased easterly of the tropical Pacific due to the strengthened Walker circulation causes a large-scale cooling of SSTs with WES feedback to produce a La-Nina-like atmospheric pattern. Recent studies also suggest that tropical Atlantic warming may result in a La-Nina-like pattern in the eastern tropical Pacific, linking the recent cooling of the eastern tropical Pacific with a warming trend in the northern tropical Atlantic from observational data and supporting modeling simulations [Ham et al., 2013; McGregor et al., 2014; Li et al., 2016].
Thus, we can infer that the dynamical mechanism proposed in this study also exists in the other GCMs and the real world.
이명인 교수님께서 항상 수업을 진지하게 받아들이시고 학생들의 진로에 관심을 가져주시는 모습이 정말 멋집니다. 앞으로도 좋은 시간 보내시고, 밝은 미래를 함께 하시길 바라겠습니다. 선배님 덕분에 실험실에서 많은 일을 수월하게 할 수 있었고, 졸업 후에도 조언을 해주셔서 감사했습니다.
연구뿐만 아니라 같이 게임도 하고 해외여행도 다니면서 의미 있는 추억이 많아요. 북극에 대해 잘 알지 못했지만, 북극의 치열한 연구 세계를 배울 수 있도록 도와주고 논문 작성과 심사에 많은 도움을 주신 김도연님께 감사의 말씀을 전하고 싶습니다. 그의 적극적인 태도와 나에 대한 끊임없는 관심 덕분에 나는 누구보다 풍성한 학교 경험을 할 수 있었다.
제가 그곳에 있을 때 마지막 라이더였던 김한준 선수에게도 감사의 말씀을 전하고 싶습니다. CDL 연구실을 거쳐간 모든 학부생 연수생들에게 감사의 말씀을 전하고 싶습니다. 많이 해결하진 못했지만 좋은 에너지로 이겨낸 것 같아요.
장교 훈련에 관해 조언해 주셔서 진심으로 감사드리며, 저보다 먼저 3년의 복무를 잘 마치시기 바랍니다.