저작자표시-비영리-변경금지 2.0 대한민국 이용자는 아래의 조건을 따르는 경우에 한하여 자유롭게
l 이 저작물을 복제, 배포, 전송, 전시, 공연 및 방송할 수 있습니다. 다음과 같은 조건을 따라야 합니다:
l 귀하는, 이 저작물의 재이용이나 배포의 경우, 이 저작물에 적용된 이용허락조건 을 명확하게 나타내어야 합니다.
l 저작권자로부터 별도의 허가를 받으면 이러한 조건들은 적용되지 않습니다.
저작권법에 따른 이용자의 권리는 위의 내용에 의하여 영향을 받지 않습니다. 이것은 이용허락규약(Legal Code)을 이해하기 쉽게 요약한 것입니다.
Disclaimer
저작자표시. 귀하는 원저작자를 표시하여야 합니다.
비영리. 귀하는 이 저작물을 영리 목적으로 이용할 수 없습니다.
변경금지. 귀하는 이 저작물을 개작, 변형 또는 가공할 수 없습니다.
이학석사 학위논문
상염색체 우성 다낭성 신종의 영상을 통해 측정한 총 신장 부피와 신기능 간의 상관관계 :
체계적 문헌고찰 및 메타분석
Correlations between renal function and
the total kidney volume measured on imaging for autosomal dominant polycystic kidney disease:
a systematic review and meta- analysis
울 산 대 학 교 대 학 원 의 학 과
조 우 리
[UCI]I804:48009-200000002551 [UCI]I804:48009-200000002551 [UCI]I804:48009-200000002551 [UCI]I804:48009-200000002551
상염색체 우성 다낭성 신종의 영상을 통해 측정한 총 신장 부피와 신기능 간의 상관관계 :
체계적 문헌고찰 및 메타분석
지 도 교 수 김 정 곤
이 논문을 이학석사 학위 논문으로 제출함
2017 년 12 월
울 산 대 학 교 대 학 원 의 학 과
조 우 리
조우리의 이학석사학위 논문을 인준함
심사위원 김 정 곤 (인) 심사위원 김 경 원 ( 인 )
심사위원 심 우 현 (인)
울 산 대 학 교 대 학 원
2017 년 12 월
Abstract (English)
Purpose: To provide a systematic summary of total kidney volume (TKV) as an imaging biomarker in clinical trials for autosomal dominant polycystic kidney disease (ADPKD), focusing on the correlation between TKV and renal function.
Methods:A computerized literature search was performed using MEDLINE and EMBASE databases for studies that evaluated the correlation between TKV and the glomerular filtration rate (GFR) and between the TKV growth rate and GFR decline rate. A meta- analysis was performed to generate the summary correlation coefficient (r). A qualitative review was performed to evaluate the characteristics of TKV as an imaging biomarker.
Results: Eighteen articles including a total sample size of 2835 patients were retrieved.
Meta-analysis revealed substantial correlations between TKV and GFR [r, –0.520; 95%
confidence interval (CI), –0.60 to –0.43] and between the TKV growth rate and GFR decline rate [r, –0.320; 95% CI, –0.54 to –0.10]. The quantitative review revealed that baseline TKV can affect the TKV growth rate and GFR decline rate, such that patients with a higher baseline TKV showed faster TKV growth and GFR decline. There was significant variability in image acquisition and analysis methods.
Conclusion:There were significant negative correlations between TKV and GFR as well as between TKV growth and GFR decline rates, suggesting that TKV imaging is a useful biomarker in clinical trials. However, standardization—or at least trial-specific
standardization—of image acquisition and analysis techniques is required to use TKV as a reliable biomarker.
Keywords: total kidney volume; review; autosomal dominant polycystic kidney disease;
meta-analysis; biomarker
Table of contents
Abstract (English) ··· i
List of tables ··· iv
List of figures··· v
Introduction··· 1
Methods ··· 2
Literature search strategy··· 2
Terminology··· 3
Inclusion criteria ··· 5
Exclusion criteria ··· 5
Data extraction ··· 6
Quality assessment ··· 6
Data synthesis ··· 7
Results ··· 9
Literature search ··· 9
Study characteristics and quality assessment··· 9
Meta-analysis of correlation coefficients ··· 12
Subgroup analysis and meta-regression··· 12
Qualitative review ··· 13
Discussion··· 15
Conclusion ··· 19
Reference··· 34
국문요약··· 38
List of tables
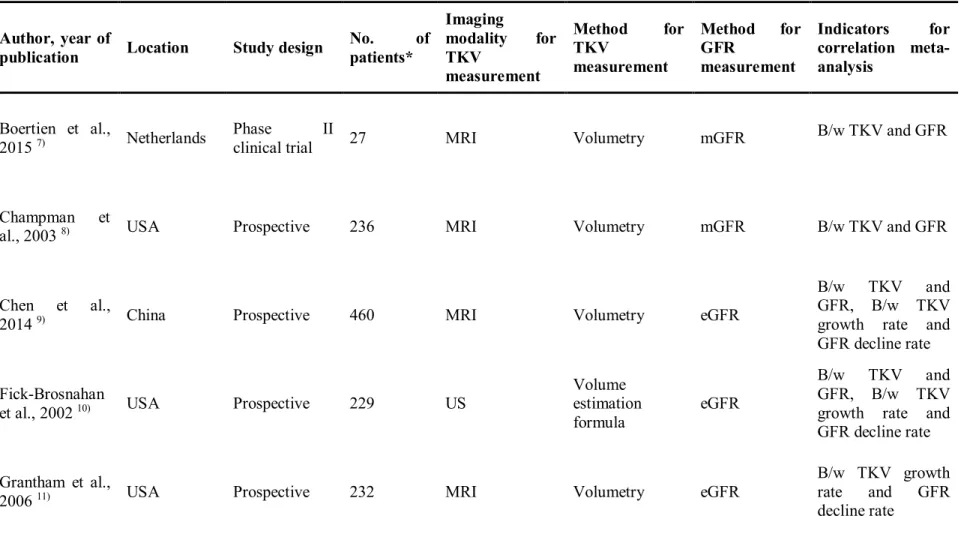
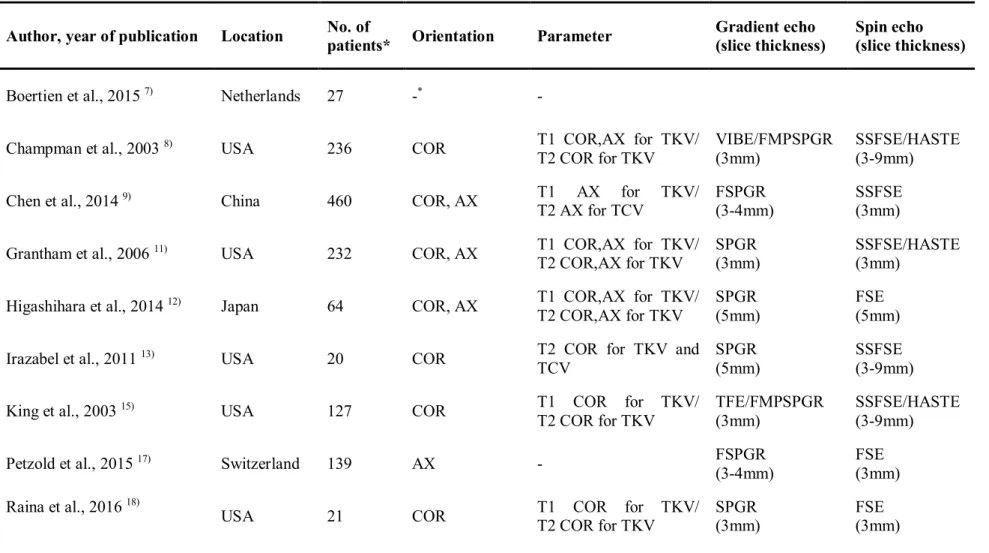
Table 1. Characteristics of TKV and GFR measurements of articles included in meta- analysis ··· 20 Table 2.Characteristics of image acquisition method used for TKV measurement of articles included in meta-analysis··· 24 Table 3. Qualitative review of the questions commonly used for TKV in ADPKD patients
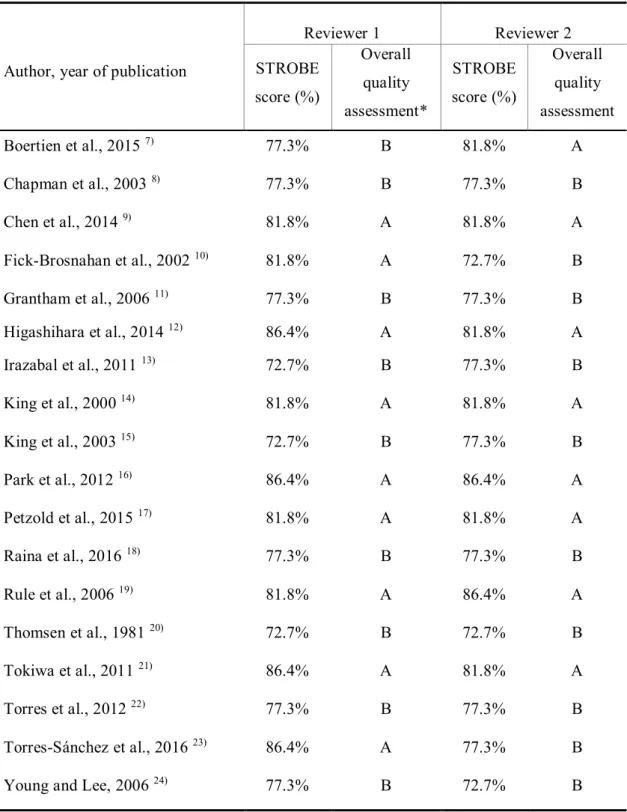
··· 26 Table 4.Quality assessment of the included literature using STROBE criteria ··· 29
List of figures
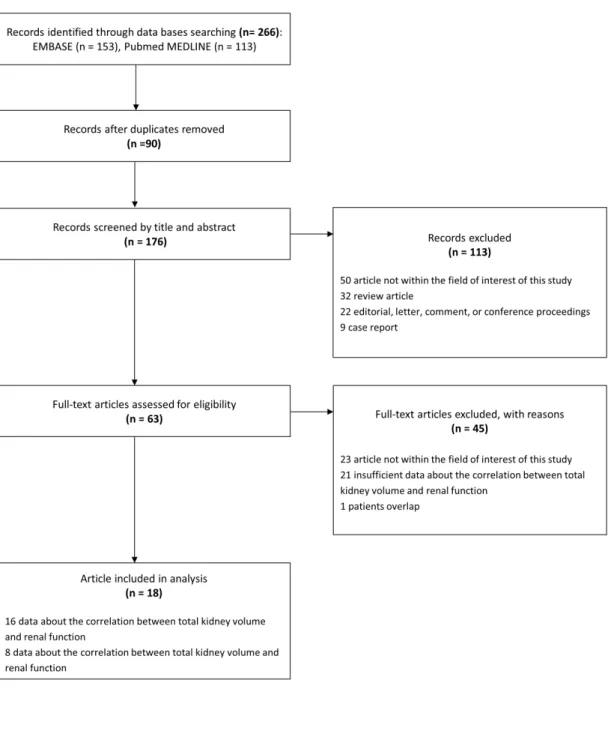
Figure. 1.PRISMA flow diagram of the study selection process ··· 30 Figure. 2. Forest plots for correlation coefficients between TKV and GFR and the TKV growth rate and GFR decline rate. TKV = total kidney volume, GFR = glomerular filtration rate, B/w= between ··· 31 Figure. 3. Funnel plots for visual appraisal of the literature bias. (a) Correlation coefficient between TKV and GFR. (b) Correlation coefficient between the TKV growth rate and GFR decline rate. TKV = total kidney volume, GFR = glomerular filtration rate ··· 32 Figure. 4. Forest plots in subgroup analysis. The upper forest plot demonstrates the pooled correlation coefficient s between TKV measured by MRI and GFR as well as TKV measured by CT and GFR. The lower forest plot demonstrates the pooled correlation coefficients between TKV measured by volumetry and GFR as well as TKV measured by volume estimation formula and GFR ··· 33
Introduction
Autosomal dominant polycystic kidney disease (ADPKD) is characterized by non- malignant cystic tissue in the kidney and is caused by a hereditary or acquired mutation.
ADPKD occurs worldwide and in all ethnicities with a prevalence estimated to be between 1/400 (including observed and estimated autopsy cases) and 1/1000 (clinically diagnosed cases) 1). Proper diagnosis and management of ADPKD is critical because ADPKD causes structural abnormalities, impairs renal function, and eventually leads to end-stage renal disease (ESRD) in approximately half of the patients 2). The primary mechanism of renal function impairment is excessive cyst growth, which compresses and replaces the renal parenchyma and ultimately results in renal parenchyma loss within the interstitial fibrosis.
In the last decade, glomerular filtration rate (GFR) and serum creatinine have been the only available biomarkers for treatment response assessment in clinical trials in patients with ADPKD. These serum- or urine-based biomarkers are excellent for evaluating renal function but they cannot detect structural abnormalities. Most of the new therapeutics target the inhibition of cyst growth, which can in turn preserve renal function 3). Thus, there remains a need to find effective biomarkers that can directly evaluate cyst growth.
Total kidney volume (TKV) measurement has gained popularity as a good mechanism-driven biomarker that can objectively evaluate the pathogenic processes or the pharmacologic responses to a therapeutic agent 4). TKV can be accurately measured using
imaging modalities such as magnetic resonance imaging (MRI), computed tomography (CT), and ultrasonography (US). These imaging modalities are readily available in most clinics.
An increasing number of clinical trials have adopted imaging studies to measure TKV.
Furthermore, TKV was recently approved as a qualified imaging biomarker by both the United States Food and Drug Administration (FDA) and the European Medicines Agency (EMA) for clinical trials of new drugs for ADPKD 5, 6). Therefore, the use of TKV will be rapidly increasing in both routine practice and clinical trials.
Recently, multiple studies have reported on TKV as a pharmacodynamics biomarker and on the relationship between TKV and renal function in patients with ADPKD 7-24). However, the results have varied and no systematic review and meta-analysis have been conducted to explore the correlations between TKV and renal function. Hence, we believe that it is timely and critical to establish a systematic summary on the relationship between TKV and renal function in patients with ADPKD. Accordingly, we performed this meta- analysis to provide data on the evidenced-based of TKV in clinical trials and clinical practice.
Methods
Literature search strategy
We followed the Preferred Reporting Items for Systematic Reviews and Meta- Analyses (PRISMA) guidelines for accomplishing and reporting this study 25). A
comprehensive search of the PubMed-MEDLINE and EMBASE databases was conducted to identify relevant, original publications concerning the correlation between TKV and estimated renal function in patients with ADPKD.
The following search terms were used: (“autosomal dominant polycystic kidney disease” OR ADPKD OR PKD) AND (“total kidney volume” OR “TKV” OR “kidney volume” OR “renal volume”) AND (“GFR” OR “glomerular filtration rate” OR “clearance”).
The use of the terms “autosomal dominant polycystic kidney disease” OR ADPKD OR PKD was intended to specify the patient group. The use of “total kidney volume” OR “TKV” OR
“kidney volume” OR “renal volume” was intended to find literature on various imaging modalities for TKV measurement. The use of “GFR” OR “glomerular filtration rate” OR
“clearance” was intended to identify works on various types of renal function estimation. No limitations on study dates were used. We searched the literature published prior to February 28th 2017. Our search was restricted to human patients and English-language studies. For the management of literature searches, Endnote version X7 (Thomson Reuters, New York, NY) was used.
Terminology
TKV is defined as the sum of the volume of the left and right kidneys 5) and is measured by MRI, CT, or US imaging. TKV can be measured by a volume estimation
formula based upon an ellipsoid volume equation using three semi-axes on three planes.
Alternatively, it can be measured by quantitative volumetry through boundary tracing or by summing the regions of interest on multiple 2D images (i.e., 2D volumetry) or 3D volume measurements (i.e., 3D volumetry). In some studies, an adjusted TKV by body surface area or height was used. In our systematic review, TKV included all types of TKV values, which included those using a volume estimation formula or direct volumetry with/without adjustment.
Renal function is evaluated by the GFR, which is the volume of fluid filtered from the renal glomerular capillaries into the Bowman’s capsule per unit time. Several different techniques are used to measure or estimate GFR. The measured GFR (mGFR) can be calculated by quantifying the clearance of inulin, creatinine, or 125I-iothalamate 7, 8, 11, 12, 20). The estimated GFR can be calculated by the Cockcroft–Gault equation, the Modification of Diet in Renal Disease equation, or the CKD–EPI equation.
In ADPKD patients, GFR usually declines over time, while TKV increases. In our systematic review, the term “GFR decline rate” refers to the speed of the decline in GFR, which was expressed in a slightly different manner in the literature, for example, yearly GFR decline, rate of GFR decline, GFR slope, or GFR change rate. Likewise, the term “TKV growth rate” refers to the rate of increase in TKV over time.
Inclusion criteria
Studies (or subsets of studies) that investigated the correlation between TKV or the total cyst volume and renal function were eligible for inclusion in the analysis. Studies (or subsets of studies) that satisfied all of the following criteria were included:
(a) Population: studies that included nine or more patients with adult ADPKD who underwent imaging to measure TKV or the total cyst volume;
(b) Reference standard: studies in which the renal function was measured based on GFR or creatinine clearance (CrCl);
(c) Study design: clinical trials and observational studies (i.e., retrospective or prospective);
(d) Outcomes: results were reported in sufficient detail to evaluate the correlation coefficients between TKV and renal function and that between TKV growth rate and GFR decline rate.
Exclusion criteria
The exclusion criteria included the following:
(a) Case reports and series with sample sizes of less than nine patients and studies with potential selection biases, e.g. non-consecutive series;
(b) Review articles, editorials, letters, comments, and conference proceedings;
(c) Studies on topics other than the correlation between TKV or the total cyst volume and
renal function in patients with ADPKD;
(d) Studies with insufficient data for evaluating the correlation coefficient between TKV or total cyst volume and renal function.
Data extraction
From the selected studies, we extracted the following data into standardized data forms: (a) study characteristics such as authors, year of publication, hospital or medical school, and study design; (b) demographic and clinical characteristics of the patients, namely, age, sex, state of ADPKD, and population size; (c) image acquisition methods of MRI, CT, and ultrasonography and imaging analysis methods to measure TKV; (d) methods to estimate renal function, including indirect GFR estimation and direct GFR measurement using clearance methods; (e) outcomes of the studies, that is, the statistical method and results for investigating the correlation between TKV and renal function at one time point or during the follow-up period. Two reviewers (W.R.J. and S.H.K.) independently extracted the data from the studies and all discrepancies were resolved by consensus with a third reviewer (K.W.K.).
Quality assessment
The Strengthening of the Reporting of Observational Studies in Epidemiology
(STROBE) recommendations were used to estimate the methodological quality of the evaluated studies. The STROBE recommendations include a checklist of 22 items designed to evaluate literature quality. The 22-criteria checklist evaluates three main clinical study designs: cohort, case-control, and cross-sectional. Two reviewers independently assessed the quality of the articles by calculating the percentage of the STROBE checklist met by each article (“STROBE score”) 26). The overall quality assessment was grouped into categories from A to D, based on the percentage of STROBE checklist met by each article (A: 81–
100%; B: 61–80%; C: 41–60%; and D: 21–40%).
Data synthesis
Meta-analysis of correlation coefficients
To calculate the summary correlation coefficient (r) between TKV and GFR as well as between the TKV growth rate and GFR decline rate, we used Fisher’s method with Fisher’s Z transformation of the correlation coefficients 27). Using this method, the Pearson or Spearman correlation coefficients were converted to Z transforms, after which a mean transformed correlation weighted by the sample size was calculated. Once a 95% confidence interval (CI) was obtained for the pooled Z score, it was transformed back to a 95% CI for the pooledrwith random effects models. Heterogeneity was assessed using the Cochran’s Q test based on the chi-square statistic. A p value <0.10 in the Q test was considered to be
statistically significant, indicating substantial heterogeneity 28). If heterogeneity existed, a random effects model was used to obtain r and its 95% CI 29). To explore source of heterogeneity, we performed subgroup analysis and meta-regression for potential influencing factors for the correlation coefficient. The meta-regression was performed using mixed- model including two moderators, i.e., imaging modalities (MRI versus CT) and TKV measurement method (direct volumetry versus the volume estimation formula method).
Publication bias was assessed by a funnel plot and Egger’s test. The statistical analyses were performed using the R version 3.0.1 with the “metafor” package30).
Qualitative review
The main hypothesis of our study is that TKV correlates well with renal function.
However, there might be other factors that influence the relationship between TKV and renal function. To address this, we explored the following four questions:
(1) Is baseline TKV associated with the rate of renal function decline?
(2) Is baseline TKV associated with the rate of TKV increase?
(3) Is baseline renal function associated with the rate of TKV increase?
(4) Is patient age associated with the rate of TKV increase?
Given the diversity of the parameters used and the small number of individual studies, we performed a qualitative systematic review for each question.
Results
Literature search
Our literature search process is shown in Fig. 1. In the literature search using PubMed-MEDLINE and EMBASE databases, and after removing duplicates, 176 articles were screened for eligibility. Of these, 113 articles were excluded after a review of the titles and abstracts: 32 review articles; 22 letters, editorials or conference abstracts; 9 case reports;
and 50 original articles whose topics were different from the correlation between TKV and renal function. Full texts of the remaining 63 articles were retrieved. A search of the bibliographies of these articles did not find any additional eligible studies. The following 45 articles were further excluded after a review of the full texts: 23 articles whose topics were outside the field of interest of our study; 21 articles with insufficient data on the correlation between TKV and renal function; and 1 other article that presented data using a study population that overlapped with other studies. The remaining 18 articles 7-24)were used for in the qualitative and quantitative reviews. Among the 18 articles, 17 papers 7-10, 12-24)were used to evaluate the correlation between TKV and renal function. In addition, 6 articles 9-12, 14, 21)
were used to evaluate the correlation between the TKV growth rate and GFR decline rate confirm the association of changes in TKV with changes in renal function.
Study characteristics and quality assessment
The basic characteristics of the 18 included studies are summarized in Table 1 7-24). Most research was done in the United States (n = 9), followed by Europe (n = 4), Korea (n = 2), Japan (n = 2), and China (n = 1). Most studies were prospective (n = 13), followed by retrospective observational studies (n = 4) and a clinical trial (n = 1). Four studies used data from the Consortium for Radiologic Imaging Studies of Polycystic Kidney Disease (CRISP) cohort 8, 11, 15, 18), which was established to test whether imaging techniques can provide accurate and reproducible markers of progression of renal disease in patients with polycystic kidney disease.
TKV measurements of patients with ADPKD have been evaluated by various imaging techniques such as MR, ultrasonography, and CT. The vast majority of imaging studies on TKV used MRI (n = 14), followed by CT (n = 3) and ultrasonography (n = 1).
Among the articles using MRI images, 9 articles using T1-weighted images and T2-weighted images in the coronal plane were used. In addition, T1-weighted images were used to measure renal cysts and parenchymal volumes, and TCV was measured using T2-weighted images because cysts were mostly water content. Thus, TKV measurement through T1 and TCV measurement through T2 are also recommended by CRISP8). Especially, all of the articles using MRI in the United States were measured in this way (Table 2). However, there are significant differences in the way in which images are acquired from other articles, and the diversity of these image acquisition devices or methods can lead to bias in the outcome.
This can have a major impact in predicting drug efficacy or disease response. Therefore, standardization of image acquisition methods for TKV measurement of ADPKD patients should be standardized. In addition, in the past, enhanced MR imaging enhanced only the kidney parenchyma except for cysts, so that cysts and parenchyma could be distinguished from each other, which was widely used for TKV and TCV measurements. However, because gadolinium-based MR contrast agents are associated with renal systemic fibrosis in patients with renal disease, the FDA has raised concerns about the use of gadolinium in patients with ADPKD, and CRISP currently uses images that have not been enhanced in current studies31). Although T2-weighted images are presented as alternatives to enhanced images, additional studies are needed to determine whether T2-weighted images can replace information obtained from enhanced images.
For TKV measurements, direct volumetry (n = 15) was more commonly used than volume estimation formula methods (n = 3) because direct volumetry generally provides more accurate volume measurements than volume estimation by the ellipsoid volume equation (Table 3).
The quality of the included studies, as assessed using the STROBE checklist ver. 4, was good overall (Table 4). As suggested by both reviewers, all 18 studies had STROBE scores between 72.73% and 86.36%, which placed them in category A and B. Nine (50%) and eight (44.4%) studies were categorized as category A (i.e., high-quality studies) by
reviewers 1 and 2, respectively. The discrepancy between the two reviewers was minor.
Meta-analysis of correlation coefficients
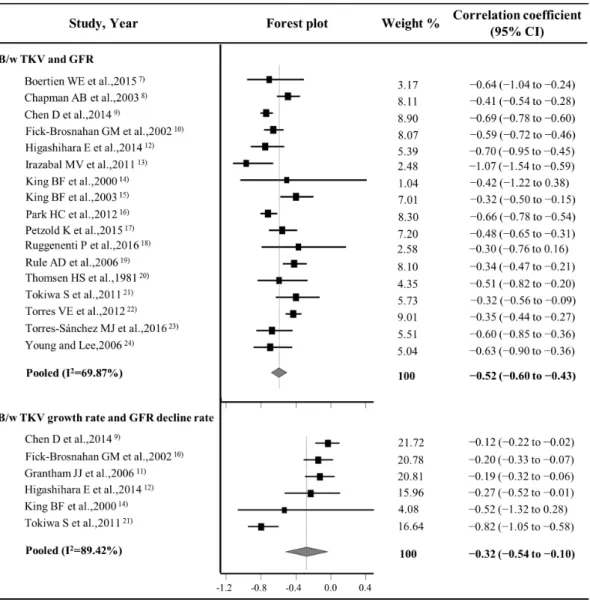
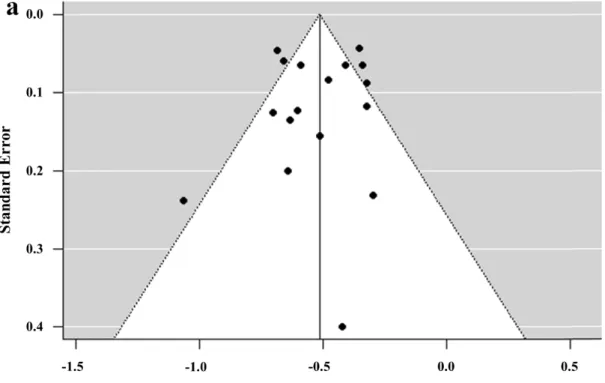
The forest plots of the correlation meta-analysis are presented in Fig. 2. For the correlation between the TKV and GFR, the rwas –0.52 (95% CI, –0.60 to –0.44), suggesting a good inverse correlation between TKV and renal function. For the correlation between the TKV growth and GFR decline rates, the r was –0.32 (95% CI, –0.54 to –0.10), indicating a fair inverse correlation between the TKV growth rate and GFR decline rate. There were heterogeneities among the 17 studies (p < 0.001, Q test) with regard to the correlation between TKV and GFR and among 6 studies (p < 0.001, Q test) with regard to the correlation between the TKV growth rate and GFR decline rate, leading to use of the random effects model in the pooled data. There was no significant publication bias in the funnel plots (Fig. 3) and Egger’s tests with regard to the correlation between TKV and GFR (p = 0.4355) and that between the TKV growth rate and GFR decline rate (p = 0.3068).
Subgroup analysis and meta-regression
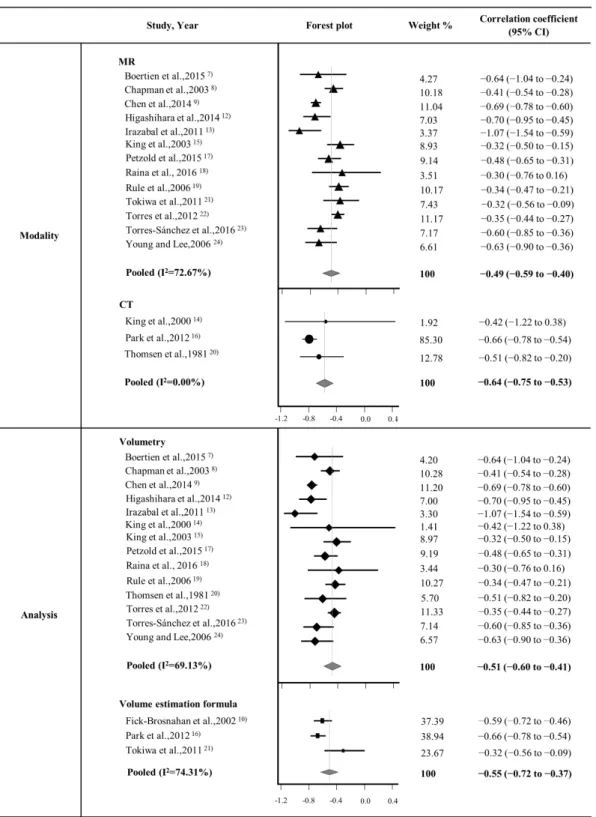
As illustrated in Fig. 4, the subgroup analysis results for the imaging modality (MRI versus CT) and TKV measurement methods (direct volumetry versus volume estimation formula method) were as follows: (1) the correlation coefficients for MRI group (n = 13) and
CT group (n = 3) were –0.49 (95% CI, –0.59 to –0.40) and –0.64 (95% CI, –0.75 to –0.53), respectively; and (2) the correlation coefficients for direct volumetry group (n = 14) and volume estimation formula method group (n = 3) were –0.51 (95% CI, –0.60 to –0.41) and – 0.55 (95% CI, –0.72 to –0.37), respectively.
Meta-regression for two moderators revealed that there was no significant subgroup effects of both moderators (p = 0.3919 for imaging modality, p = 0.7507 for TKV measurement method). The pooled correlation coefficient between TKV and GFR after adjustment for imaging modality and measurement method was –0.46 (95% CI, –0.72 to – 0.20), which was similar to the unadjusted pooled correlation coefficient of –0.52 (95% CI, – 0.60 to –0.43). These results indicate that imaging modality and TKV measurement method might not be influencing factors.
Qualitative review
The answers and evidence for the four questions used to identify any factors that might affect the relationship between TKV and renal function or the TKV growth rate and GFR decline rate were obtained from subgroup analysis using five research papers (Table 4)
8, 9, 11, 12, 32).
Three studies explored the relationship between the baseline TKV and GFR decline rate using a comparison of the yearly GFR decline rate 11, 12, 32). All studies demonstrated an
inverse relationship between the baseline TKV and GFR decline rate, indicating that patients with a large TKV may have a rapid decline in GFR.
Further, the baseline TKV and TKV growth rate was evaluated in two studies and this showed a strong correlation (r = 0.80, p < 0.001) between TKV and the TKV growth rate (r = 0.69, p < 0.001, between log TKV and TKV growth rate), suggesting that patients with large kidneys have a rapid rate of kidney enlargement 12, 32).
In addition, Torres et al. 32) reported that the baseline iothalamate clearance (mL/min/1.73 m2) was negatively correlated with the TKV growth rate (r= –0.19, p = 0.052).
However, the degree of correlation was low; thus, we are not sure if patients with low renal function have a rapid rate of kidney enlargement.
Lastly, there were controversies within studies with regard to the relationship between age and TKV or the TKV growth rate. Chapman et al. 8) reported that TKV was greater in the group aged 35–45 years than in that aged 25–34 years, while Chen et al9) reported that the TKV growth rate (i.e., annual TKV growth rate) increased with age. In contrast, Higashihara et al. 12) reported that TKV and TKV-related parameters had no significant correlation with age. Thus, further studies are needed to determine the role of age in TKV.
Discussion
Our study findings have demonstrated that there are substantial correlations between TKV and GFR, as well as between the TKV growth rate and GFR decline rate (r = –0.520 and –0.320, respectively). These results support the theory that TKV and the TKV growth rate are good biomarkers that may reflect renal function and provide clinically relevant information of the disease status of ADPKD. In addition, through a quantitative review, we also determined that the baseline TKV could affect the TKV growth rate and GFR decline rate. Specifically, patients with a higher baseline TKV may show faster TKV growth and GFR decline.
As our understanding of the pathogenesis of ADPKD has increased, the therapeutic goal is to inhibit cyst development and growth33). Many molecular targeted agents are being evaluated to stop or delay cyst growth in ADPKD patients 33). In these clinical trials, biomarkers to measure cyst development and growth are needed and TKV or the TKV growth rate were adopted as important clinical endpoints, as well as the traditional renal function markers.
In terms of the qualification of TKV as a biomarker, it is of paramount importance to note the characteristics, including the advantages and drawbacks, of TKV measurement by imaging. First, the most important advantage of TKV is that it sensitively reflects kidney structural changes and cyst growth during the entire time of ADPKD progression 8). Thus,
TKV can be used as a biomarker throughout the entire disease process from the early to late stages of ADPKD, which can last many decades. In contrast, the renal function decline usually occurs in the relatively late stages of ADPKD; thus, there might be limitations in the use of renal function as a biomarker in early stages of ADPKD11). The discrepancy between the cyst growth period and renal function decline period may raise an issue that TKV can reflect renal function, which is the ultimate endpoint in the management of ADPKD patients.
Our meta-analysis showed fair correlations between TKV and GFR, as well as between the TKV growth rate and GFR decline rate. These findings support that TKV measurement can be used as a surrogate for disease progression.
In addition, the use of imaging for TKV measurement has the following advantages:
(1) imaging enables accurate and repeated evaluation of the disease process of ADPKD over several decades by providing quantitative and objective measurements 8); (2) imaging is widely used in clinical practice and is thus readily available in most clinics and clinical trial centers; and (3) imaging evaluates patient’s overall condition besides the kidney and liver cysts and can, for example, identify complications of ADPKD such as hemorrhagic or infected cysts. These advantages have enabled investigators and pharmaceutical companies to adopt TKV as an endpoint in clinical trials. Indeed, as of March 30, 2017, of the 92 ADPKD-related clinical trials, 31 used TKV as a biomarker, resulting from a search for
“ADPKD” and “ADPKD and total kidney volume” in the clinical trial database
(clinicaltrial.gov).
However, there are potential drawbacks to the use of TKV imaging measurements for clinical trials. Significant variability in the imaging techniques, such as image acquisition and analysis, may hamper reliable TKV measurement. First, the imaging modality varied across studies. In our systematic review, most studies used MRI (n = 14) for TKV measurements, but some used CT (n = 3) and ultrasonography (n = 1). Even in the studies using MRI, the image acquisition protocol slightly varied across studies, vendor, sequence, and institutional preference. Nevertheless, T1-weighted and T2-weighted coronal images, with a large field-of-view, were the most commonly used sequence for TKV measurements in our included articles (n = 10). T2-weighted images are the best sequence to identify an enlarged kidney with numerous cysts, as it provides the best contrast for fluid-containing cysts 15). In addition, a large field-of-view is required because enlarged kidneys in ADPKD patients frequently grow very large and can fill almost the entire abdominopelvic cavity. The coronal imaging plane is the best method to acquire a large field-of-view in a short time 15).
There are various methods for volume measurement, including a volume estimation formula using an ellipsoid volume equation and quantitative volumetry, either 2D or 3D, using special imaging processing software7, 13). There is controversy regarding the choice of methods for TKV measurement. The volume estimation formula method is easy and fast and does not require special imaging processing software; however, it has potential issues with
the accuracy and reproducibility of the estimated volume 33). Volumetry can accurately calculate TKV but it takes a long time and requires special software. In clinical trials, where measurements should be accurate and reproducible in multiple repeated images over time, volumetry may be a more appropriate method than the volume estimation formula method.
Indeed, in the literature included in our systematic review, most studies used volumetry (n = 14) rather than the volume estimation formula (n = 3).
In addition, in some studies, TKV was adjusted by body surface area or height to enable investigators to obtain more accurate results reflecting individual variations in height or weight 12, 15, 17, 24). However, these adjustments may not be necessary. For example, Higashihara et al.12)reported that the correlation coefficients between TKVs and GFR were –0.606 using unadjusted TKV, –0.606 using a height-adjusted TKV, and –0.614 using a body surface area-adjusted TKV.
Although our subgroup and meta-regression analysis showed that there is no subgroup effects in both imaging modality and TKV measurement methods, standardization of the imaging modality, acquisition protocol, and volume measurement method is required.
Indeed, the FDA strongly recommends the use of standardized equipment and protocols in their guidance 5). At the very least, trial-specific standardization, that is, harmonization and maintenance of these imaging techniques according to standard operation procedures (SOPs), is mandatory for the use of TKV as a biomarker in a clinical trial.
There are several limitations to our systematic review. First, our systematic review focused on the overall correlation between TKV and GFR and between the TKV growth rate and GFR decline rate. Due to a lack of data in the included literature, we were not able to perform any subgroup meta-analysis based on the initial TKV. Instead, we qualitatively reviewed and summarized the pre-existing evidence. Second, the number of included studies is relatively small; however, the use of TKV as a biomarker in clinical trials is just beginning as the FDA approved its use in 2016. Hence, we believe that it is very timely to perform this systematic review.
Conclusion
There are significant negative correlations between TKV and GFR and between the TKV growth rate and GFR decline rate, which supports the use of TKV-based imaging as a useful biomarker in clinical trials. Standardization, or at least trial-specific standardization, of imaging acquisition and analysis techniques is required before TKV can be used as a reliable biomarker.
Table 1. Characteristics of TKV and GFR measurements of articles included in meta-analysis
Author, year of
publication Location Study design No. of patients*
Imaging
modality for TKV
measurement
Method for TKV
measurement
Method for GFR
measurement
Indicators for correlation meta- analysis
Boertien et al.,
2015 7) Netherlands Phase II
clinical trial 27 MRI Volumetry mGFR B/w TKV and GFR
Champman et
al., 2003 8) USA Prospective 236 MRI Volumetry mGFR B/w TKV and GFR
Chen et al.,
2014 9) China Prospective 460 MRI Volumetry eGFR
B/w TKV and GFR, B/w TKV growth rate and GFR decline rate Fick-Brosnahan
et al., 2002 10) USA Prospective 229 US Volume
estimation formula
eGFR
B/w TKV and GFR, B/w TKV growth rate and GFR decline rate Grantham et al.,
200611) USA Prospective 232 MRI Volumetry eGFR
B/w TKV growth rate and GFR decline rate
Higashihara et
al., 2014 12) Japan Prospective 64 MRI Volumetry eGFR
B/w TKV and GFR, B/w TKV growth rate and GFR decline rate Irazabel et al.,
2011 13) USA Prospective 20 MRI Volumetry eGFR B/w TKV and GFR
King et al., 2000
14) USA Prospective 9 CT Volumetry eGFR
B/w TKV and GFR, B/w TKV growth rate and GFR decline rate King et al., 2003
15) USA Prospective 127 MRI Volumetry mGFR B/w TKV and GFR
Park et al., 2012
16) Korea Prospective 270 CT
Volume estimation formula
eGFR B/w TKV and GFR
Petzold et al.,
2015 17) Switzerland Retrospective 139 MRI Volumetry eGFR B/w TKV and GFR
Raina et al.,
2016 18) USA Retrospective 21 MRI Volumetry eGFR B/w TKV and GFR
Rule et al., 2006
19) USA Prospective 234 MRI Volumetry mGFR B/w TKV and GFR
Thomsen et al.,
1981 20) Denmark Prospective 43 CT Volumetry mGFR B/w TKV and GFR
Tokiwa et al.,
2011 21) Japan Retrospective 73 MRI
Volume estimation formula
eGFR
B/w TKV and GFR,B/w TKV growth rate and GFR decline rate Torres et al.,
2012 22) USA Prospective 528 MRI Volumetry eGFR B/w TKV and GFR
Torres-Sánchez
et al., 2016 23) Spain Retrospective 67 MRI Volumetry eGFR B/w TKV and GFR
Young and Lee,
2006 24) Korea Prospective 56 MRI Volumetry eGFR B/w TKV and GFR
TKV = total kidney volume, mGFR = measured glomerular filtration rate, eGFR = estimated glomerular filtration rate, B/w = between.
* If several methods were used in the study, we noted only the method that was used for the meta-analysis of the correlation coefficient.
Table 2.Characteristics of image acquisition method used for TKV measurement of articles included in meta-analysis
Author, year of publication Location No. of
patients* Orientation Parameter Gradient echo (slice thickness)
Spin echo (slice thickness)
Boertien et al., 2015 7) Netherlands 27 -* -
Champman et al., 2003 8) USA 236 COR T1 COR,AX for TKV/
T2 COR for TKV
VIBE/FMPSPGR (3mm)
SSFSE/HASTE (3-9mm)
Chen et al., 2014 9) China 460 COR, AX T1 AX for TKV/
T2 AX for TCV
FSPGR (3-4mm)
SSFSE (3mm)
Grantham et al., 200611) USA 232 COR, AX T1 COR,AX for TKV/
T2 COR,AX for TKV SPGR
(3mm) SSFSE/HASTE
(3mm) Higashihara et al., 2014 12) Japan 64 COR, AX T1 COR,AX for TKV/
T2 COR,AX for TKV
SPGR (5mm)
FSE (5mm)
Irazabel et al., 2011 13) USA 20 COR T2 COR for TKV and
TCV
SPGR (5mm)
SSFSE (3-9mm)
King et al., 2003 15) USA 127 COR T1 COR for TKV/
T2 COR for TKV
TFE/FMPSPGR (3mm)
SSFSE/HASTE (3-9mm)
Petzold et al., 2015 17) Switzerland 139 AX - FSPGR
(3-4mm)
FSE (3mm)
Raina et al., 2016 18) USA 21 COR T1 COR for TKV/
T2 COR for TKV
SPGR (3mm)
FSE (3mm)
Rule et al., 2006 19) USA 234 COR T1 COR for TKV/
T2 COR for TKV
VIBE/FMPSPGR, (3mm)
SSFSE/HASTE (3-9mm)
Tokiwa et al., 2011 21) Japan 73 COR, SAG, AX - - -
Torres et al., 2012 22) USA 528 COR T1 COR for TKV/
T2 COR for TKV
VIBE/FMPSPGR (3mm)
SSFSE/HASTE (9mm)
Torres-Sánchez et al., 2016
23) Spain 67 AX T1 AX for TKV GRE
(2-3mm) -
Young and Lee, 2006 24) Korea 56 COR T2 COR for TKV - FSE
(5-7mm)
* No description of the content in the article
COR = coronal image, AX = axial image, SAG = sagittal image, FSE = fast spin echo, SSFSE = single shot fast spin echo, HASTE = half-fourier acquired single-shot turbo spin echo, VIBE = volumetric interpolated breath-hold examination, TFE = turbo field echo, FMPSPGR = fast multi planar Spoiled gradient echo, FSPGR = fast-spoiled gradient echo sequences
Table 3. Qualitative review of the questions commonly used for TKV in ADPKD patients.
Q1. Is baseline total kidney volume associated with the rate of kidney function decline (i.e., GFR decline rate)?
Study Method Result Answer
Grantham 2006 11)
Authors stratified the cohort into three groups according to baseline total kidney volume
In the groups over 30 years old with total kidney volumes of
<750 mL, 750–1500 mL, and >1500 mL, the GFR slopes were 1.03, –1.62, and –5.04 mL/min/year, respectively
Yes
Higashihara 2014 12)
The correlation coefficient (r) between baseline TKV and eGFR slope was obtained
Baseline TKV, ht-TKV, bs-TKV, and log TKV negatively correlated with the eGFR slope (r = –0.2642, –0.2476, – 0.1811, and –0.2425; p = 0.0349, 0.0485, 0.1521, and 0.0534, respectively.)
Yes
Torres 2007 32)
i. The correlation coefficient (r) between baseline log TKV and GFR slope was obtained
ii. Multiple regression models were used to determine which baseline variables independently predictive of renal function deterioration (estimated by GFR slope)
i. Baseline log TKV negatively correlated with the GFR slope (r= –0.40, p < 0001)
ii.Three baseline variables—TKV, age, 24-hour urine albumin excretion—contributed negatively to the eGFR slope. Among these variables, the influence of TKV was the highest
Yes
Q2. Is baseline total kidney volume associated with the rate of total kidney volume increase (i.e., TKV growth rate)?
Study Method Result Answer
Higashihara 2014 12) Identify the relationship between TKV slope and baseline TKV
There was a high correlation between baseline TKV and the TKV slope (r = 0.7995, p < 0.001), suggesting that patients with large kidneys have a rapid rate of kidney enlargement
Yes
Torres 2007 32)
The correlation coefficient (r) between baseline log TKV and the TKV slope was obtained
Baseline log TKV positively correlated with the TKV slope (r
= 0.69, p < 0001) Yes
Q3. Is baseline renal function associated with the rate of total kidney volume increase (i.e., TKV growth rate)?
Study Method Result Answer
Torres 2007 32)
Relationship among total kidney volume slopes and iothalamate clearances
Baseline iothalamate clearance (mL/min/1.73 m2) negatively correlated with slope of kidney volume (r= –0.19, p = 0.052) Yes Q4. Is patient age associated with the rate of total kidney volume increase (i.e., TKV growth rate)?
Study Method Result Answer
Chapman 2003 8)
Mean total renal, cystic, and noncystic volumes in the entire Consortium for Radiologic Imaging Studies of Polycystic Kidney Disease (CRISP) cohort, in those between 15 to 24, 25 to 34, and 35 to 45 years of age.
Total kidney volume was significantly greater in the 35- to 45- year age group than in the 25- to 34-year age group Yes
Chen 2014 9)
The relationship between baseline total kidney volumes and yearly TKV growth rates for age categories ≤18 years, 19–30 years, 31–40 years, 41–
50 years, 51–60 years, and 60 years were reported
Yearly TKV growth rates were positively correlated with age.
Yearly TKV growth rates were largest in patients > 60 years old
Yes
Higashihara 2014 12) Identify the relationship between the TKV slope and baseline patients’ age
TKV and TKV-related parameters were not significant
correlated with age No
TKV = total kidney volume, ht-TKV = height-adjusted total kidney volume, bs-TKV = body surface area-adjusted total kidney volume, log TKV = natural log-transformed total kidney volume, mGFR= measured glomerular filtration rate, eGFR= estimated glomerular filtration rate, B/w = between
Table 4. Quality assessment of the included literature using STROBE criteria
Author, year of publication
Reviewer 1 Reviewer 2
STROBE score (%)
Overall quality assessment*
STROBE score (%)
Overall quality assessment
Boertien et al., 2015 7) 77.3% B 81.8% A
Chapman et al., 2003 8) 77.3% B 77.3% B
Chen et al., 2014 9) 81.8% A 81.8% A
Fick-Brosnahan et al., 2002 10) 81.8% A 72.7% B
Grantham et al., 2006 11) 77.3% B 77.3% B
Higashihara et al., 2014 12) 86.4% A 81.8% A
Irazabal et al., 2011 13) 72.7% B 77.3% B
King et al., 2000 14) 81.8% A 81.8% A
King et al., 2003 15) 72.7% B 77.3% B
Park et al., 2012 16) 86.4% A 86.4% A
Petzold et al., 2015 17) 81.8% A 81.8% A
Raina et al., 2016 18) 77.3% B 77.3% B
Rule et al., 2006 19) 81.8% A 86.4% A
Thomsen et al., 1981 20) 72.7% B 72.7% B
Tokiwa et al., 2011 21) 86.4% A 81.8% A
Torres et al., 2012 22) 77.3% B 77.3% B
Torres-Sánchez et al., 2016 23) 86.4% A 77.3% B
Young and Lee, 2006 24) 77.3% B 72.7% B
STROBE = Strengthening the Reporting of Observational Studies in Epidemiology.
* Scale of A–D: A, 81–100%; B, 61–80%; C, 41–60%; D, 21–40%.
Figure 1.PRISMA flow diagram of the study selection process
Figure 2. Forest plots for correlation coefficients between TKV and GFR and the TKV growth rate and GFR decline rate. TKV = total kidney volume, GFR = glomerular filtration rate, B/w =between.
Figure 3.Funnel plots for visual appraisal of the literature bias. (a) Correlation coefficient between TKV and GFR. (b) Correlation coefficient between the TKV growth rate and GFR decline rate. TKV = total kidney volume, GFR = glomerular filtration rate.
Figure 4.Forest plots in subgroup analysis. The upper forest plot demonstrates the pooled correlation coefficients between TKV measured by MRI and GFR as well as TKV measured by CT and GFR. The lower forest plot demonstrates the pooled correlation coefficients between TKV measured by volumetry and GFR as well as TKV measured by volume estimation formula and GFR.
References
1. Torres VE, Harris PC, Pirson Y. Autosomal dominant polycystic kidney disease.
The Lancet 2007;369:1287-301
2. Grantham JJ. Mechanisms of progression in autosomal dominant polycystic kidney disease. Kidney International Supplement 1997
3. Belibi FA, Edelstein CL. Novel targets for the treatment of autosomal dominant polycystic kidney disease. Expert opinion on investigational drugs 2010;19:315-28 4. Grantham JJ, Torres VE. The importance of total kidney volume in evaluating
progression of polycystic kidney disease. Nature Reviews Nephrology 2016 5. Food and drug administration. Qualification of biomarker-total kidney volume in
studies for treatment of autosomal dominant polycystic kidney disease: Guidance for industry (available from
http://www.Fda.Gov/downloads/drugs/guidances/ucm458483.Pdf; date assessed, january 10th 2017). In, 2016.
6. European medicines agency. Draft qualification opinion-total kidney volume as a prognostic biomarker for use in clinical trials evaluating patients with autosomal dominant polycystic kidney disease (available from
http://www.Ema.Europa.Eu/docs/en_gb/document_library/regulatory_and_proced ural_guideline/2015/07/wc500190205.Pdf; date assessed, january 10th 2017). In, 2015.
7. Boertien WE, Meijer E, de Jong PE, ter Horst GJ, Renken RJ, van der Jagt EJ et al.
Short-term effects of tolvaptan in individuals with autosomal dominant polycystic kidney disease at various levels of kidney function. American journal of kidney diseases : the official journal of the National Kidney Foundation 2015;65:833-41 8. Chapman AB, Guay-Woodford LM, Grantham JJ, Torres VE, Bae KT,
Baumgarten DA et al. Renal structure in early autosomal-dominant polycystic kidney disease (adpkd): The consortium for radiologic imaging studies of polycystic kidney disease (crisp) cohort. Kidney international 2003;64:1035-45
9. Chen D, Ma Y, Wang X, Yu S, Li L, Dai B et al. Clinical characteristics and disease predictors of a large chinese cohort of patients with autosomal dominant polycystic kidney disease. PloS one 2014;9:e92232
10. Fick-Brosnahan GM, Belz MM, McFann KK, Johnson AM, Schrier RW.
Relationship between renal volume growth and renal function in autosomal dominant polycystic kidney disease: A longitudinal study. American journal of kidney diseases : the official journal of the National Kidney Foundation 2002;39:1127-34
11. Grantham JJ, Torres VE, Chapman AB, Guay-Woodford LM, Bae KT, King BF, Jr. et al. Volume progression in polycystic kidney disease. The New England journal of medicine 2006;354:2122-30
12. Higashihara E, Nutahara K, Okegawa T, Shishido T, Tanbo M, Kobayasi K et al.
Kidney volume and function in autosomal dominant polycystic kidney disease.
Clinical and experimental nephrology 2014;18:157-65
13. Irazabal MV, Torres VE, Hogan MC, Glockner J, King BF, Ofstie TG et al. Short- term effects of tolvaptan on renal function and volume in patients with autosomal dominant polycystic kidney disease. Kidney international 2011;80:295-301 14. King BF, Reed JE, Bergstralh EJ, Sheedy Ii PF, Torres VE. Quantification and
longitudinal trends of kidney, renal cyst, and renal parenchyma volumes in
autosomal dominant polycystic kidney disease. Journal of the American Society of Nephrology 2000;11:1505-11
15. King BF, Torres VE, Brummer ME, Chapman AB, Bae KT, Glockner JF et al.
Magnetic resonance measurements of renal blood flow as a marker of disease severity in autosomal-dominant polycystic kidney disease. Kidney international 2003;64:2214-21
16. Park HC, Hwang JH, Kang AY, Ro H, Kim MG, An JN et al. Urinary n-acetyl- beta-d glucosaminidase as a surrogate marker for renal function in autosomal dominant polycystic kidney disease: 1 year prospective cohort study. BMC nephrology 2012;13:93
17. Petzold K, Poster D, Krauer F, Spanaus K, Andreisek G, Nguyen-Kim TD et al.
Urinary biomarkers at early adpkd disease stage. PloS one 2015;10:e0123555 18. Raina R, Lou L, Berger B, Vogt B, Do AS-M, Cunningham R et al. Relationship
of urinary endothelin-1 with estimated glomerular filtration rate in autosomal dominant polycystic kidney disease: A pilot cross-sectional analysis. BMC nephrology 2016;17:22
19. Rule AD, Torres VE, Chapman AB, Grantham JJ, Guay-Woodford LM, Bae KT et al. Comparison of methods for determining renal function decline in early
autosomal dominant polycystic kidney disease: The consortium of radiologic imaging studies of polycystic kidney disease cohort. Journal of the American Society of Nephrology : JASN 2006;17:854-62
20. Thomsen HS, Madsen JK, Thaysen JH, Damgaard Petersen K. Volume of polycystic kidneys during reduction of renal function. Urologic Radiology 1981;3:85-9
21. Tokiwa S, Muto S, China T, Horie S. The relationship between renal volume and renal function in autosomal dominant polycystic kidney disease. Clinical and experimental nephrology 2011;15:539-45
22. Torres VE, Chapman AB, Perrone RD, Bae KT, Abebe KZ, Bost JE et al. Analysis of baseline parameters in the halt polycystic kidney disease trials. Kidney
international 2012;81:577-85
23. Torres-Sánchez MJ, Ávila-Barranco E, Esteban De La Rosa RJ, Fernández- Castillo R, Esteban MA, Carrero JJ et al. Relationship between renal function and renal volume in autosomal dominant polycystic kidney disease: Cross-sectional study. Revista Clinica Espanola 2016;216:62-7
24. Young RL, Lee KB. Reliability of magnetic resonance imaging for measuring the volumetric indices in autosomal-dominant polycystic kidney disease: Correlation with hypertension and renal function. Nephron - Clinical Practice 2006;103:c173- c80
25. Moher D, Liberati A, Tetzlaff J, Altman DG. Preferred reporting items for systematic reviews and meta-analyses: The prisma statement. BMJ 2009;339
26. Von Elm E, Altman DG, Egger M, Pocock SJ, Gøtzsche PC, Vandenbroucke JP.
The strengthening the reporting of observational studies in epidemiology [strobe]
statement: Guidelines for reporting observational studies. Gaceta Sanitaria 2008;22:144-50
27. Hedges LV OI. Statistical methods for meta-analysis London: Academic Press., 1985
28. Higgins JP, Thompson SG, Deeks JJ, Altman DG. Measuring inconsistency in meta-analyses. BMJ 2003;327:557-60
29. DerSimonian R, Laird N. Meta-analysis in clinical trials. Controlled Clinical Trials 1986;7:177-88
30. Laliberté E. Metacor: Meta-analysis with correlation coefficients as effect sizes. R package version 2009:1.0-
31. Kistler AD, Poster D, Krauer F, Weishaupt D, Raina S, Senn O et al. Increases in kidney volume in autosomal dominant polycystic kidney disease can be detected within 6 months. Kidney international 2009;75:235-41
32. Torres VE, King BF, Chapman AB, Brummer ME, Bae KT, Glockner JF et al.
Magnetic resonance measurements of renal blood flow and disease progression in autosomal dominant polycystic kidney disease. Clinical journal of the American Society of Nephrology : CJASN 2007;2:112-20
33. Alam A, Dahl NK, Lipschutz JH, Rossetti S, Smith P, Sapir D et al. Total kidney volume in autosomal dominant polycystic kidney disease: A biomarker of disease progression and therapeutic efficacy. American Journal of Kidney Diseases 2015;66:564-76
국문요약
목적: 본 논문은 상 염색체 우성 다낭성 신종(ADPKD)환자대상 임상시험에서 영 상 바이오마커로 활용되는 총 신장 부피(TKV)에 대한 체계적 문헌 고찰의 내용 을 서술하고자 함이며, 총 신장 부피와 신장 기능 간의 상관관계에 중점을 둔 다.
방법: 총 신장 부피와 사구체여과율(GFR), 총 신장부피의 증가율과 사구체여과 율 의 감소율 간의 상관관계에 대해 평가한 논문을 대상으로 문헌검색을 진행 했으며, 데이터베이스는 MEDLINE 과 EMBASE 가 활용되었다. 이를 통해, 선별된 논문의 상관계수를 요약 및 평가하기 위한 메타분석을 실시하였으며, 영상 바 이오마커로써 총 신장 부피의 적격성을 확인하기 위한 정성적 평가도 함께 수 행하였다.
결과: 본 논문에서는 총 18 개의 논문을 활용하였으며, 이에 포함되는 전체 표 본 수는 2835 명이다. 메타분석 결과 총 신장 부피와 사구체여과율[r, – 0.520;
95% 신뢰구간 (CI), – 0.60 에서– 0.43], 그리고 총 신장 부피의 증가율과 사구 체여과율 간[r, -0.320; 95 % CI, -0.54 에서 -0.10]에 긴밀한 상관관계가 있 음을 확인하였다. 추가적으로, 정량적 평가를 통해 기준점(baseline)의 총 신 장 부피가 총 신장 부피의 증가율과 GFR 감소율에 영향을 주는 것을 확인하였다.
다시 말해, 기준점의 총 신장 부피가 높을수록 총 신장 부피의 증가와 사구체 여과율의 감소가 급격히 빨라진다는 것을 의미한다. 총 신장 부피를 측정하는
데 필요한 영상의 수집 및 분석 방법의 다양성으로 상당한 변이는 존재한다.
결론: 총 신장 부피와 사구체여과율 그리고 총 신장 부피의 감소율과 사구체여 과율의 감소율 간 긴밀한 음의 상관관계는 총 신장 부피를 위한 영상이 관련 임상시험에서 유용한 바이오마커임을 시사한다. 그러나, 총 신장 부피를 신뢰 도높은 바이오마커로써 적절히 활용하려면, 총 신장 부피를 측정하기 위한 영 상획득 및 분석 기술의 표준화 또는 최소한 해당 임상시험 맞춤형 표준화 (trial-specific standardization)가 우선적으로 이뤄져야 한다.
중심단어:총 신장 부피;고찰;상 염색체 우성 다낭성 신종;메타분석;바이오마커