Calculations for the difference in strength, 2ΔT for np-Au (blue squares) and for each ligament (red circles), estimated using the typical Gibson-Ashby equation [1] as a function of ligament size. Total creep strain and QSS creep rate as a function of ligament size for uncoated (a, b) and coated (c, d) np-Au.
Introduction
With four np-Au samples, the asymmetric tension-compression behavior in terms of yield strengths and ligament size effect is obtained. These results are discussed with the dominant creep mechanism and the dominant dislocation mechanism for each ligament size sample.
Research Background
Nanoporous Gold (np-Au)
- Preparation of Precursor Alloys
- Fabrication of np-Au by Dealloying Process
Thus, fabricated np-Au from the Au-Ag precursor alloy can be formed with a uniform bi-continuous nanoporous structure after the dealloying process. The alloying of Au-Ag precursor alloy by free corrosion in nitric acid can be given as:
![Fig. 2-1. Silver-gold phase diagram [46].](https://thumb-ap.123doks.com/thumbv2/123dokinfo/10497677.0/18.892.180.709.321.737/fig-2-1-silver-gold-phase-diagram-46.webp)
Mechanical Properties of Np-Au
- Effect of Relative Density
- Effect of Ligament Size
- Deformation Behavior
Combined with the ligament size effect, typical Gibson-Ashby equation was modified and suitable developed for np-Au structure. In addition, there have been arguments that deformation behavior of np-Au depends on the number of ligaments in the gauge section.
![Fig. 2-10. Reported yield strengths (a) yield strengths of np-Au and (b) that of Au as a function of relative density and ligament size on log-log scale [57].](https://thumb-ap.123doks.com/thumbv2/123dokinfo/10497677.0/34.892.114.783.379.649/reported-yield-strengths-strengths-function-relative-density-ligament.webp)
Microstructural Evolution by Ligament Coarsening
Self-similarity of Np-Au
- Morphological and Topological Evolution
- Coarsening Mechanism
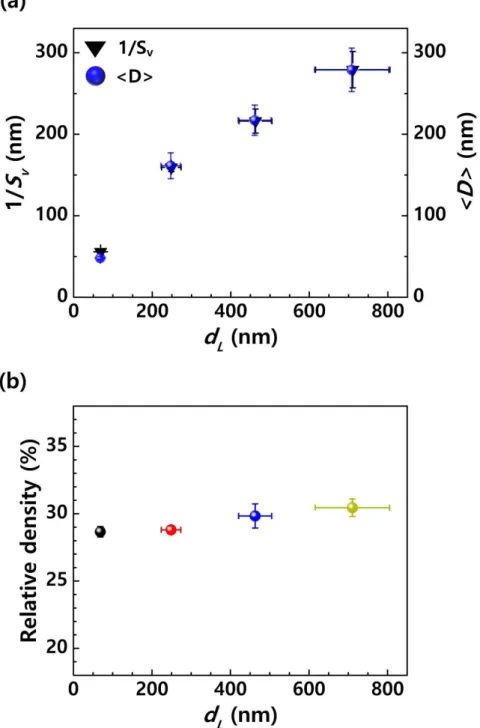
3-2(a) shows the relationship between the inverse ratio of ligament area to volume 1/SV, and the mean thickness
3-3(b) shows SV
Conclusions
This value is similar to the activation energy for surface diffusion in gold [86-88] and much lower than that for lattice diffusion in gold [89]. So, this indicates that thermal burial is done by surface diffusion and is also consistent with previous computational and experimental studies. Surface diffusion in np-Au during thermal burial is likely to cause pinch-off of connecting ligaments and coalescence of torus ligaments, which could lead to a decrease in connectivity [79, 80].
Dead-end ligaments formed by the pinch-off process have a convex curvature and tend to flatten to reduce surface energy, leading to an increase in ligament size. Relationship between average ligament size and inverse coarsening temperature to calculate activation energy for thermal coarsening of np-Au [29].
![Fig. 3-4. Scaled connectivity density as a function of average ligament size [29].](https://thumb-ap.123doks.com/thumbv2/123dokinfo/10497677.0/48.892.177.713.368.771/fig-scaled-connectivity-density-function-average-ligament-size.webp)
Uniaxial Deformation on Np-Au
Tensile and Compressive tests
- Microstructure of Precursor Alloy and Np-Au
- Tensile and Compressive Behavior
4-3 presents SEM and optical microscopy (OM) images for the top surface, elastic and compressive samples for np-Au. The brittle-ductile transition has been observed in np-Au depending on the number of ligaments in the gauge volume [66]. Both tensile and compressive np-Au samples with dL of 56 nm, 149 nm, and 402 nm were prepared by FIB milling.
The difference in tensile plasticity between np-Au with dL of 868 nm and the other three can be attributed to the presence of the PID (proportional integral differential) controller in the mechanical testers. Relative density, gauge dimension and number of ligaments in the gauge volume of np-Au samples [30].
![Fig. 4-2. The EBSD images for (a) Au-Ag precursor alloy and (b) np-Au tensile sample with d L of 149 nm [30].](https://thumb-ap.123doks.com/thumbv2/123dokinfo/10497677.0/55.892.186.712.356.718/fig-ebsd-images-au-precursor-alloy-tensile-sample.webp)
Factors Affecting the Mechanical Properties
- Compliance of Underlying Np-Au in Micro-pillar Compression
- Dependence on Crystallographic Orientation
The increase in elastic modulus of the np-Au micropillars due to plastic collapse results in greater compliance of the underlying np-Au. So, considering that the elastic modulus of np-Au micropillars can change during compression, a compliance model is proposed. Therefore, we reasonably concluded that the orientation factor cannot affect the mechanical behavior of np-Au under both tension and compression.
We concluded that due to the irregular structure for ligament size distribution, the effect of orientation on the mechanical properties of np-Au would be negligible. So, we can consider that the yield strength of np-Au is related to the plastic deformation of the weakest ligaments, which could be the thinnest load-bearing ligament.
Tension-compression Asymmetry
- Role of Surface Energy
- Yielding Mode in Tension and Compression
4-13(b) shows a diagram of the four stress components induced by the uniaxial compressive force F: (1) Axial stress 𝜎𝑎𝑥𝑖𝑎𝑙 for ligaments parallel to the load axis, (2) bending stress 𝜎𝑏𝑒𝑛𝑑𝑖𝑛𝑔 for transverse ligaments perpendicular to the tax axis , (3 ) transverse shear stress 𝜏𝑡𝑟𝑎𝑛𝑠 for transverse ligaments perpendicular to the load axis, (4) pure shear stress 𝜏𝑠ℎ𝑒𝑎𝑟 for transverse ligaments of short and thick shape. 4-13(c) shows a diagram for the fixed-solid beam model and the stress distribution along the neutral axis (yellow dotted line) showing the maximum bending stress occurring at the outer surface, while the maximum shear stress due to bending deformation has been applied to the neutral axis. From the above description, the maximum resolved shear stress of axial strain can be given by.
4-14(c), 𝜏𝑅𝑒𝑠_𝜎𝑏𝑒𝑛𝑑𝑖𝑛𝑔,𝑚𝑎𝑥 is much higher than the others and has the maximum resolved shear stress for a wide center region. Maximum resolved shear stress for 4-type stress components normalized by F/A as a function of distance from cell edge to loading point with aspect ratio t to l of (a) 2, (b) 1, (c) 0.5; the.
![Fig. 4-11. Calculations for difference of strengths, 2ΔT for np-Au (blue squares) and for each ligament (red circles) estimated by typical Gibson-Ashby equation [1] as a function of ligament size](https://thumb-ap.123doks.com/thumbv2/123dokinfo/10497677.0/74.892.186.708.286.728/calculations-difference-strengths-ligament-estimated-equation-function-ligament.webp)
Ligament-Size Effect
Moreover, strain hardening is increased by dislocation multiplication in the ligaments as the ligament size increases (as described above), so that the strain hardening exponent increases with increasing ligament size up to dL of 402 nm. This phenomenon also coincides with the decrease of this size effect exponent m to -1.30 for compressive flow stress at 20% strain from -1.49 for compressive flow strength (Fig. 4-7).
![Fig. 4-15. DIC images for (a) tensile test right before failure and (b) compressive test at 20% strain [30]](https://thumb-ap.123doks.com/thumbv2/123dokinfo/10497677.0/84.892.251.656.167.965/fig-dic-images-tensile-right-failure-compressive-strain.webp)
Conclusions
Time-dependent Deformation on Np-Au
Time-dependent Deformation (creep) Tests
- Np-Au Preparation and Surface Coating on Np-Au
- Time-dependent Behavior on Uncoated and Coated Np-Au
This strategy aims to account for the effect of np-Au on ligament size so that all applied loads are included in the plateau regime of the compressive stress-strain curves regardless of ligament size. The purpose of the exposure step is to uniformly deposit an amorphous aluminum oxide layer on the np-Au structure as a whole [132]. Spherical nanoindentation tests were performed in the same way for coated np-Au with all bond sizes.
5-4 shows the comparison of the creep behavior in uncoated np-Au and coated np-Au in terms of total creep strain (top line) and QSS creep rate (bottom line) as a function of applied displacement. 5 presents the amount of total creep stress 𝜀total and QSS creep rate 𝜀̇𝑄𝑆𝑆 as a function of ligament size dL in log-log scale for bare np-Au (Fig.
![Fig. 5-1. SEM images for np-Au samples with ligament size d L of 30 nm, 103 nm, 417 nm, and 986 nm [31].](https://thumb-ap.123doks.com/thumbv2/123dokinfo/10497677.0/89.892.113.784.423.595/fig-sem-images-au-samples-ligament-size-103.webp)
Creep Mechanism
- Creep Mechanism for Uncoated Np-Au
- Creep Mechanism for Coated Np-Au
However, in this study, the dominant creep mechanism for uncoated np-Au can be predicted as dislocation-induced creep. The remaining candidate is dislocation creep, which seems reasonable to consider as the dominant creep mechanism for undoped np-Au. Right before the creep state, the dislocation density was increased for all np-Au samples.
Uncoated np-Au showed negligible increase in dislocation density to the right before creep condition for all ligament sizes. So the increase in the dislocation density was facilitated by increasing the ligament size for coated np-Au.
Effect of Surface Coating on Creep Behavior
It would be attributed to the stochastic mode of surface nucleation and initial sources at dL of 103 nm. It may imply that the dislocation mechanism is mostly switched to the initial sources of the surface nucleation, so that the increase of the dislocations after surface coating facilitated the plastic deformation. The increase in creep behavior for coated np-Au with dL of 417 nm can also be attributed to the increase in dislocation density after surface coating.
Therefore, after surface coating, the increase in creep behavior in the range of dL from 103 nm to 986 nm could be attributed to the increase in dislocation density, which also implies that the initial source stochastically acts as the dominant dislocation mechanism instead of the surface. nucleation in this dL range. Since the main dislocation mechanism is changed in initial sources, it could be reduced after surface coating due to the increase in dislocation density that could support the dislocation motion.
![Fig. 5-10. Ratio of spherical hardness (left axis with blue square) and activation volume (right axis with black circle) of coated np-Au to uncoated np-Au as a function of ligament size [31].](https://thumb-ap.123doks.com/thumbv2/123dokinfo/10497677.0/108.892.141.756.335.746/ratio-spherical-hardness-square-activation-uncoated-function-ligament.webp)
Ligament-size Effect
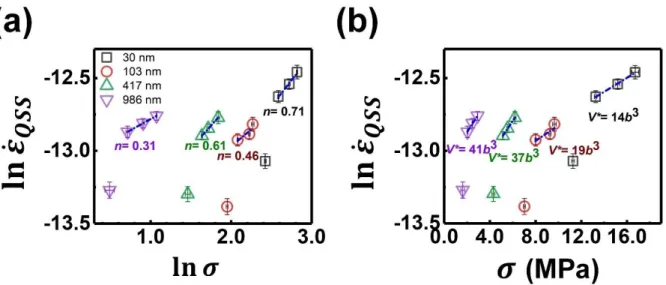
So, in the dL range from 103 to 986 nm, the creep behavior increases with increasing ligament size, as more dislocations are retained in larger ligament size. After surface coating, the creep behavior increased for a given ligament size due to the increase in dislocation density with the surface coating and follows the same trend as uncoated np-Au, which increases with increasing ligament size in the dL range from 103 to 986 nm. After surface coating, the value of n increased at the corresponding ligament size, which would be attributed to the increase in dislocation density after surface coating, while maintaining an independent trend of ligament size than the uncoated np-Au samples.
In the case of the activation volume V*, it tends to increase as the ligament size increases for both uncoated and coated np-Au. For coated np-Au with dL of 30 nm, limited dislocation nucleation at the surface could lead to a higher activation volume.
Conclusions
Conclusions
I hope that this research will allow a more accurate analysis of the mechanical properties of nanoporous materials, and I believe that this research can be used as a foundation for improving the mechanical properties of nanoporous materials. Zangari, Synthesis of Nanoporous Gold Structures by Decomposition of Electroplated Au-Ni Alloy Films, ECS Transactions. Jin, Explaining the unusual low strength and low stiffness of nanoporous gold: Quantification of network connectivity, Acta Mater.
Onck, Multiscale modeling of charge-induced deformation of nanoporous gold structures, Journal of the Mechanics and Physics of Solids. Lilleodden, A principle curvature analysis of the isothermal evolution of nanoporous gold: quantifying its characteristic length scales, Acta Mater.
![Fig. 2-3. SEM images of np-Au samples under various dealloying conditions [49].](https://thumb-ap.123doks.com/thumbv2/123dokinfo/10497677.0/22.892.129.764.325.749/fig-sem-images-au-samples-various-dealloying-conditions.webp)
![Fig. 2-4. Images of (a, b) leaf and (c) bulk samples for before and after dealloying. Volume is shrunk after dealloying [50]](https://thumb-ap.123doks.com/thumbv2/123dokinfo/10497677.0/24.892.185.713.192.334/fig-images-leaf-samples-dealloying-volume-shrunk-dealloying.webp)
![Fig. 2-6. TEM images for np-Au after dealloying. Large defects such as dislocations and stacking faults are generated in ligaments [50]](https://thumb-ap.123doks.com/thumbv2/123dokinfo/10497677.0/25.892.134.761.354.771/images-dealloying-large-defects-dislocations-stacking-generated-ligaments.webp)
![Fig. 2-8. (a) Critical potential for electrochemical dealloying [56]and (b) critical potential as a function of at.% of Ag in Au-Ag alloy [55].](https://thumb-ap.123doks.com/thumbv2/123dokinfo/10497677.0/28.892.231.659.227.813/critical-potential-electrochemical-dealloying-critical-potential-function-alloy.webp)
![Fig. 2-9. Surface images after dealloying and current density and potential as a function of dealloying time for potentiostatic (upper) and galvanostatic (bottom) dealloying methods [54, 55].](https://thumb-ap.123doks.com/thumbv2/123dokinfo/10497677.0/30.892.129.761.341.739/surface-dealloying-potential-function-dealloying-potentiostatic-galvanostatic-dealloying.webp)
![Fig. 2-11. Typical compressive stress-strain curve for open-cell foam [1].](https://thumb-ap.123doks.com/thumbv2/123dokinfo/10497677.0/36.892.205.696.328.691/fig-typical-compressive-stress-strain-curve-open-cell.webp)
![Fig. 2-12. Typical unit cell by Gibson and Ashby model under (a) uniaxial compressive loading and (b) uniaxial tensile loading [1].](https://thumb-ap.123doks.com/thumbv2/123dokinfo/10497677.0/37.892.154.746.312.669/typical-gibson-uniaxial-compressive-loading-uniaxial-tensile-loading.webp)
