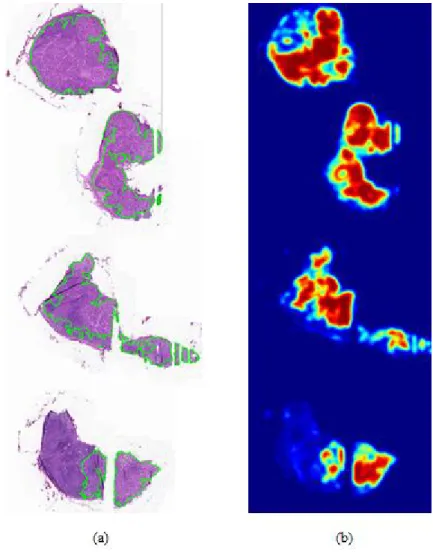
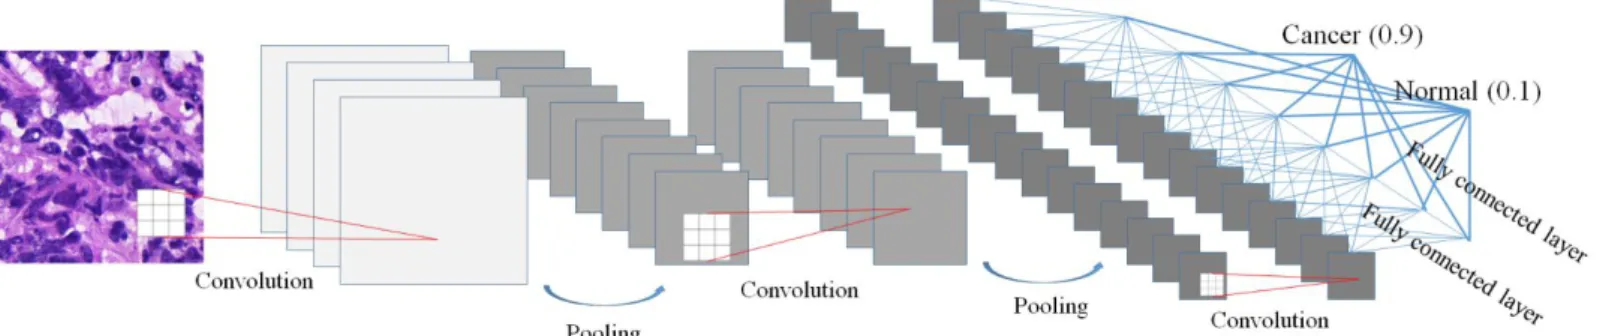
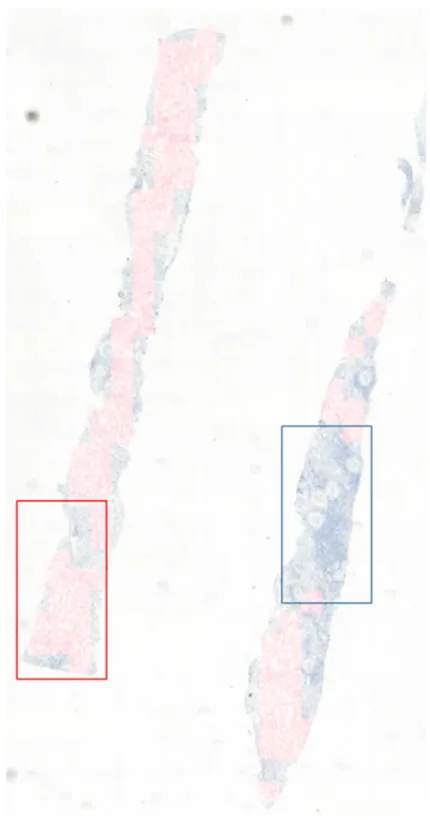
4 Figure 1-2 An example of the frozen tissue and the corresponding heat map. regions of metastasis annotated by borders colored against green. A heat map where red color shows high confidence of existence of the metastasis.··· 7 Figure 2-1. Typical CNN architecture for classification.
Introduction
A fully automated system for prediction of renal allograft rejection
C4d score, defined as the proportion of C4d-positive PTCs on immunostaining52, is one of the most important factors in the diagnosis of antibody-mediated rejection. The CNN detection model using augmented masks trained with margin sizes of 50 and 40 pixels outperformed those without augmented masks for detecting C4d positive and negative PTCs, respectively.
Metastases classification in sentinel lymph nodes on frozen tissue section
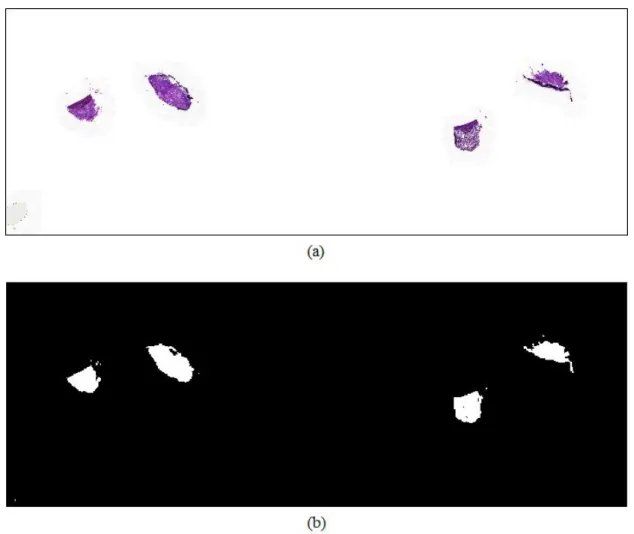
The red color of the heat map indicates high confidence of the existence of metastasis, while the blue color of the heat map means lack of confidence of the existence of cancer. An example of frozen tissue and corresponding heatmaps. a) WSI with regions of metastases marked by borders colored green.
Outline
Backgrounds
- Machine learning and deep learning
- Deep learning for CAD
- Open challenge with medical image
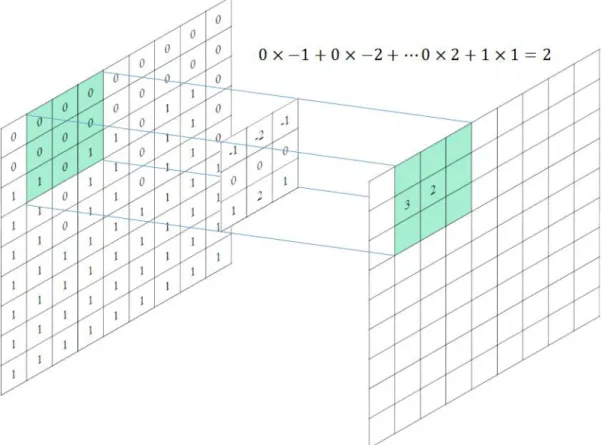
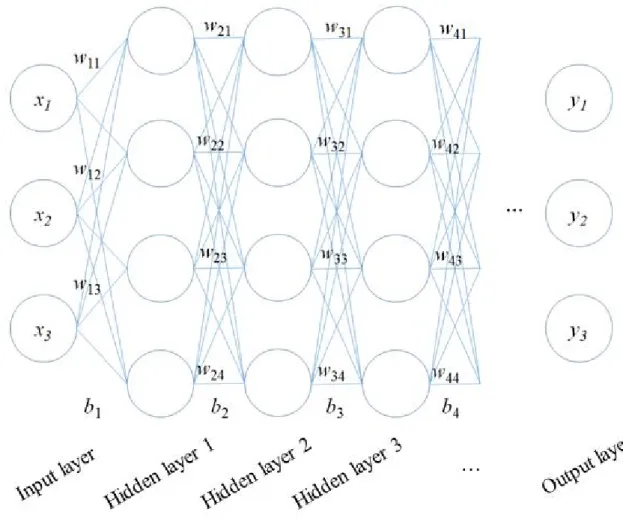
- Convolutional neural network
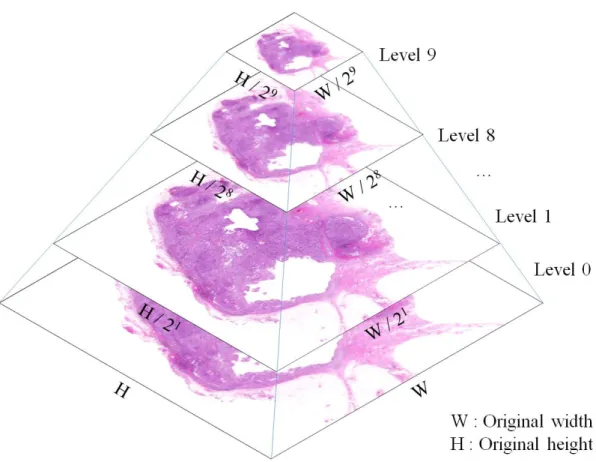
- Whole slide image
- Pre-processing
- Labeling tool
The deep learning has been adapted for the development of CAD systems such as radiology and pathology. The CNN-based deep learning architecture for classification tasks typically consists of sequential multiple layers, including convolution operations, pooling operations, and connected layers, as shown in Figure 2-1.
A fully automated system for prediction of renal allograft rejection
Materials and methods
- Subjects
- Methods
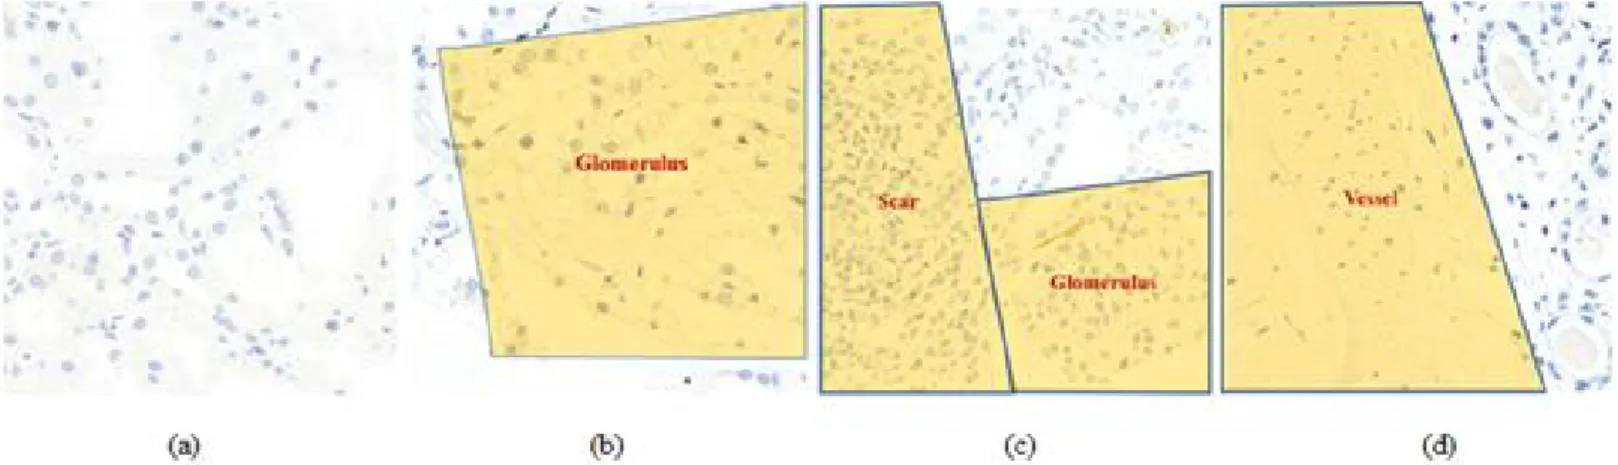
- Feasible ROI classification
- PTC detection
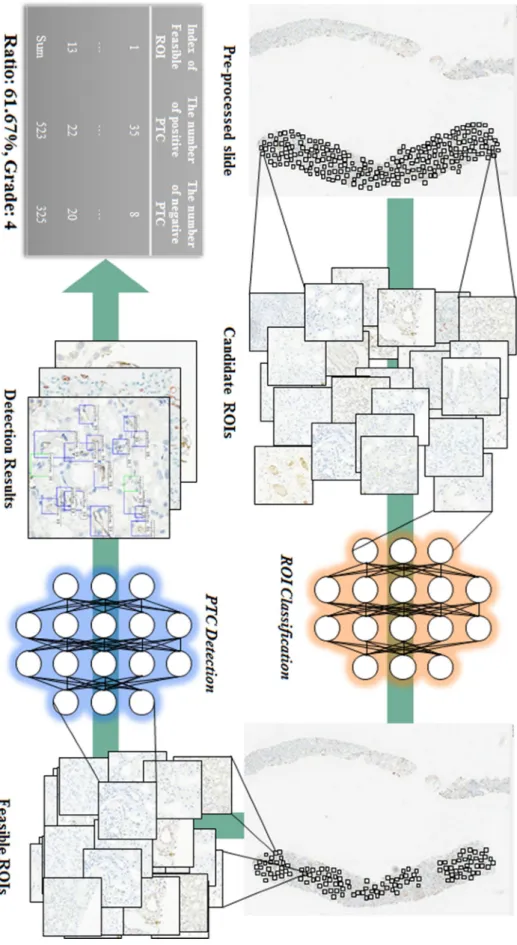
Three pathologists independently labeled C4d-positive and C4d-negative PTCs into viable ROIs of subset 1 by hand drawing using in-house software. PTCs were identified by manual labeling, including 549 C4d-positive and 1274 C4d-negative PTCs, while a total of 3836 PTCs were identified from deep learning-assisted labeling data, including 1597 C4d-positive and 2239 C4d-negative PTCs . These drawbacks can be overcome by using data through deep learning-assisted labeling instead of or in addition to manually labeled data.
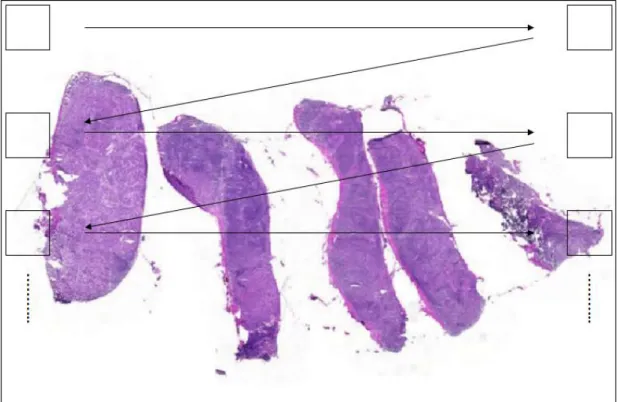
A Deeper model trained for detection can be used to firstly evaluate candidate objects, followed by confirmation or modification that involves little labor to obtain massive data, with the latter data called by deep learning-assisted labeling. The CNN classification model trained from subset 1 was used to identify feasible ROIs in subset 2 (Figure 3-4(c)), and the CNN detection model trained from subset 1 was used to identify candidate C4d positive and identify negative PTCs in all feasible ROIs. Finally, data were selected by deep learning-assisted labeling by confirming all candidate PTCs as C4d positive or C4d negative using an in-house relabeling tool (Figure 3-4(d)).
All slides are randomly divided in 6:2:2 as training, test and validation sets in subgroup 1 and 2. a) Training classification model with possible ROIs in subgroup 1. b).
Results
- Feasible ROI classification
- PTC detection
FROC scores and overall sensitivities for detection of C4d-positive and negative PTCs increased as margin sizes increased. FROC scores were highest for models trained with margin sizes of 50 and 40 pixels for detection of C4d positive and negative PTCs, respectively. The sensitivities and FROC scores for faster R-CNN detection of C4d positive and negative PTC with different margin sizes (0 to 70) at different mean number of false positives per possible ROI.
CNN detection models trained with 40-pixel margins for detecting C4d-positive and negative PTCs were tuned at maximum sensitivity to generate as much data by deep learning-assisted labeling as possible. Sensitivities and FROC scores for the fastest R-CNN and YOLO v2 detections of positive and negative C4d PTC with different detection models trained from different datasets in. The CNN detection models for detecting C4d positive and negative PTCs trained with different amounts of training data were compared as shown in Figure 3-9.
The performances in the detection of C4d positive and negative PTC were shown to saturate at approximately 300 slides.
Discussions
Classification of all tissue regions as viable or non-viable ROIs using the CNN classification model is practical, as pathologists cannot determine all viable ROIs in a tissue sample and have difficulty identifying negative PTCs. In contrast, the CNN classification model can accurately evaluate the entire sample, and the CNN detection model can accurately count the numbers of C4d positive and negative PTCs in all viable ROIs. Second, the performance was compared between models trained on data by manual labeling and data by deep learning-assisted labeling.
False positive reduction could be used to train the CNN model for glomerulus detection so that the predicted field could be excluded if they were detected in the glomerulus regions. Although it is also relatively larger than other studies related to pathological evaluation using a convolutional neural network, we will try to evaluate the performance of this more with a wild dataset from larger data. Further studies with more centers might be needed to assess the robustness of this method.
In addition, comparisons of the performance and results of this method with those of pathologists are needed to determine the clinical effectiveness of this system.
Metastases classification in sentinel lymph nodes on frozen tissue section
Materials and methods
- Subjects
- Reference standard
- Methods
- Challenge environment
- Challenge participants
- Fine-tuning
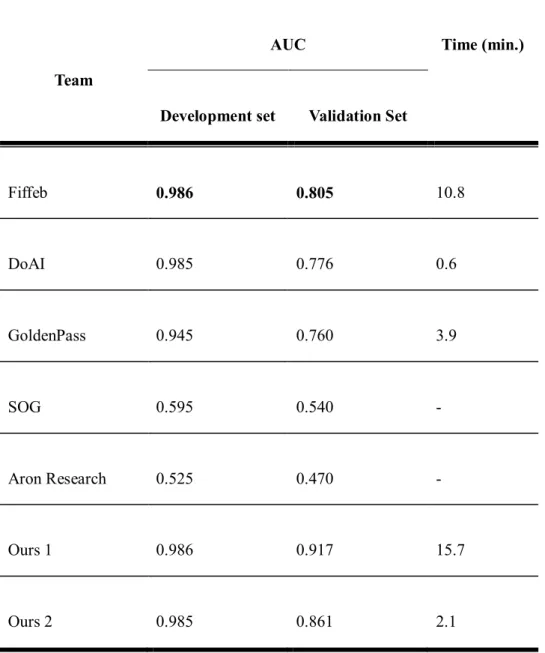
To train the CNN-based classification and segmentation model, the latest architectures, Inception v3128(Ours 1) and EfficientNet 131backbone based feature pyramid network132(Ours 2), were selected to compare performance. The probability of determining whether tumor regions were included in the digital slide was selected by the maximum confidence of the heat map. The challenge platform developed by Kakao was used to allocate two GPUs to each team.
All participants were only given access to paths to digital slides and corresponding mask images with the Kakao platform. All the participants only chose deep learning as the main architecture, such as Inception v3 and Inception-ResNet134 for classification of the tumor patch or U-net135 for segmentation of the tumor region. In one team which ranked high, random forest regression136 was used to infer confidence by extracting high-level features including the number of tumor regions, the percentage of tumor region over the entire tissue region, the area of the largest tumor regions, etc. The heat map was generated using the deep learning method.
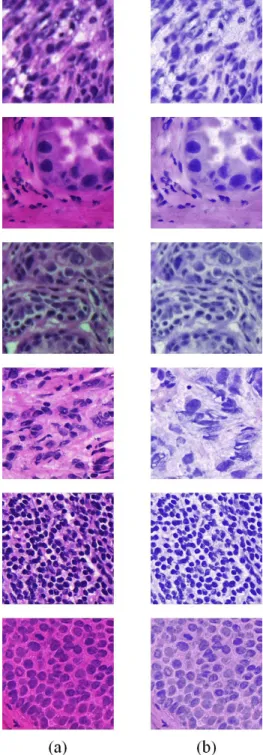
To prove the feasibility of using the pre-trained model, three types of seed weights such as random seed, ImageNet and CAMELYON were used to train or fine-tune the CNN-based classification models with different data ratio and 100% ).
Results
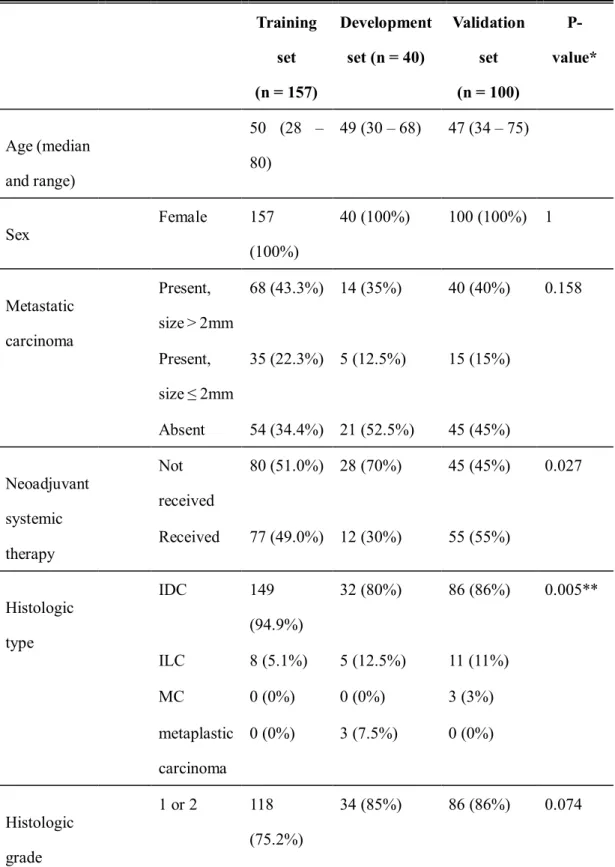
Based on histological type, all algorithms listed in Table 4-4 showed higher TPR and TNR in invasive lobular carcinoma. Similarly, all six false-negative slides were obtained from patients with invasive ductal carcinoma, i.e. The losses of the model based on the initial weight with 40% of the data set decreased faster than the model with 20% of the data set, as shown. in Figure 4-5 (a).
This tendency was observed in the case of the pre-trained ImageNet model, as shown in Figure 4-5 (b). The losses of the models based on the initial weight and the ImageNet pretrained model started at a loss of 0.8, while the losses of the models based on the CAMELYON pretrained model started at a loss of 0.5 or less, as shown in Figure 4-5 (c). . All losses, except that of 20% of the data set, were converged to the same losses for all models, as shown in Figure 4-6 (c).
In the case of using only 20% of the dataset, a model based on the CAMELYON pre-trained model showed higher AUC than that of others while AUCs of others with more than 20% of the dataset were comparable.
Discussions
The number of outputs of the classification network in this challenge is the same with the number of classes into which the model classifies input patch (i.e. 1 or 2) by encoding all input dimensions to compressed features for a precise decision. In our results, the first-placed team using only classification network showed 0.3 higher AUC than that of the second-placed team using only segmentation network, but too slow to deploy it in the actual clinical routine while the computation time of the second-placed team 18.8 took times faster than that of the first placed team. In the validation set, the top three teams showed better performances in lymph nodes with macrometastatic tumor, and which was consistent with manual examination and the CAMELYON16 study.
In addition, histological grade 1 or 2 tumors showed higher TPR in the top three groups but lower TNR in two of the three groups than histological grade 3 tumors, which requires further studies. In the case of using small datasets (40 WSIs), the losses of the model based on the CAMLEYON pre-trained model were lower than those without the CAMLEYON pre-trained model, and it showed higher AUC. Therefore, we suggest that studies of the deep learning algorithm with sentinel lymph nodes would be more practical if frozen sections are used.
Possibly due to the characteristics of our data set and the aforementioned limitations, even the top three algorithms in this study showed lower performance than the others rated first.
Discussions
In the second task, we investigated different types of deep learning methods to validate the feasibility of using deep learning methods. Deep learning based classification or segmentation methods can be useful in the frozen diagnosis of intraoperative, sentinel lymph node biopsy. The top three participant teams achieved very high AUCs in the development set while performing slightly lower AUC in the validation set.
Further studies are needed to increase the accuracy and reduce the time required to apply the deep learning algorithm in a clinical setting.
Conclusions
Bibliography
Paper presented at: Proceedings of the IEEE Conference on Computer Vision and Pattern Recognition Workshops 2017. Paper presented at: Proceedings of the IEEE Conference on computer vision and pattern recognition 2016. EfficientNet: Rethinking Model Scaling for Convolutional Neural Networks.