Therefore, the aims of this study were to investigate the levels, patterns, spatial distributions and identify the main sources of PCDD/Fs, PCBs and PCNs in bays located within or near industrial areas in South Korea. The concentrations of PCDD/Fs and PCBs are decreased compared to those obtained from previous studies in Korea. Based on this study, it may be possible to understand the spatial distributions and main sources of PCDD/Fs, PCBs and PCNs in industrial bays.
Ternary plot of the concentration of PCDD/Fs, PCBs and PCNs in the sediments of the four.
INTRODUCTION
Introduction of PCDD/Fs, PCBs, and PCNs
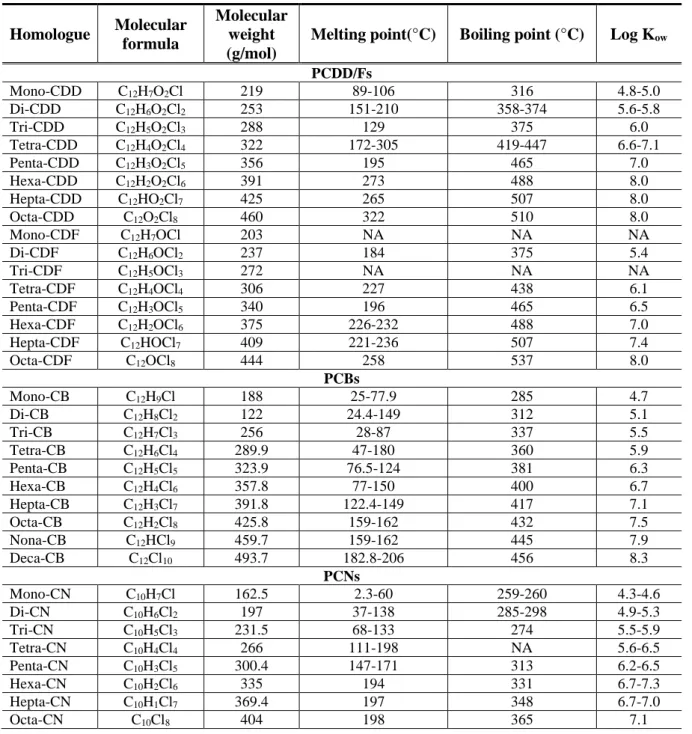
- Properties of PCDD/Fs, PCBs, and PCNs
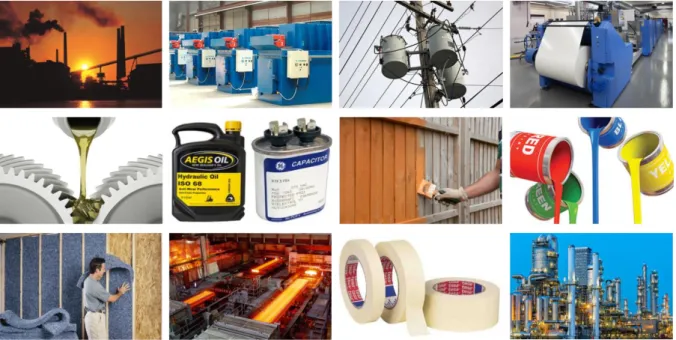
- Sources of PCDD/Fs, PCBs, and PCNs
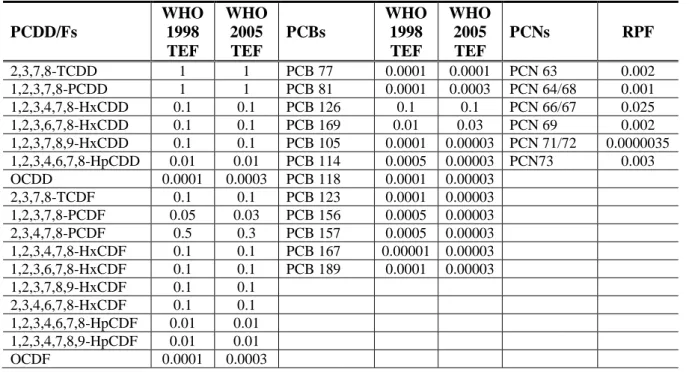
- Toxic equivalency of PCDD/Fs, PCBs, and PCNs
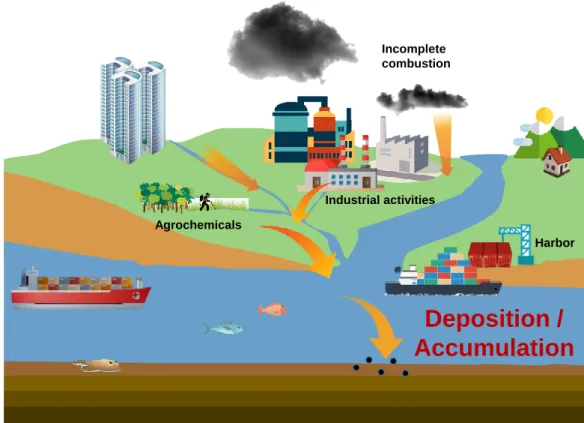
PCDD/Fs, PCBs and PCNs can be unintentionally produced by combustion and thermal processes of industrial complexes (e.g. combustion, steel production facilities, non-ferrous industries and chemical production) (Breivik et al. , 2004; Choi et al. , 2008a; Fiedler, 1996) (Figure 2). PCDD/Fs were produced as by-products of pesticides such as Pentachlorophenol (PCP) and Chloronitrophs (CNP) (Masunaga et al., 2001). Furthermore, sediments are important routes for the uptake of marine organisms; PCDDs/Fs, PCBs and PCNs ultimately enter the human body via the food chain (Choi et al., 2008b).
PCDD/Fs, PCBs and PCNs have acute and chronic toxicity, such as carcinogenicity, immunotoxicity, teratogenicity and reproductive effects (Fernandes et al., 2010; Safe, 1993).
Previous studies
Number of literature on concentrations of PCDD/Fs, PCBs and PCNs in sediments in South Korea. PCDD/Fs*Korea*sediment, PCB*Korea*sediment, PCN*Korea*sediment).

Objectives of this study
MATERIALS AND METHODS
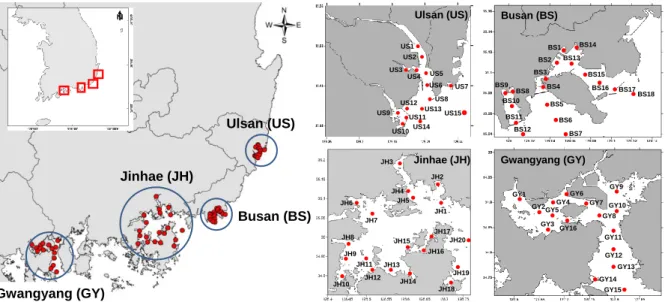
- Sampling area
- Sample preparation and instrumental analysis
- Quality assurance and quality control (QA/QC)
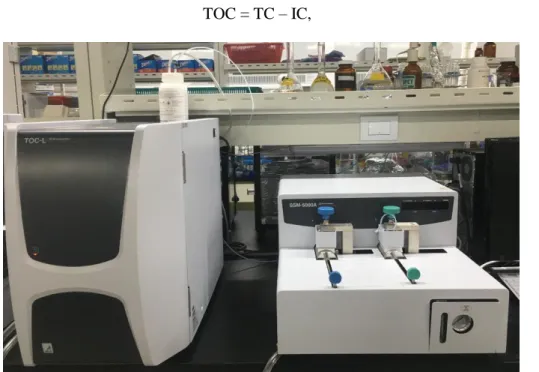
- Total organic carbon analysis
- Statistical analysis
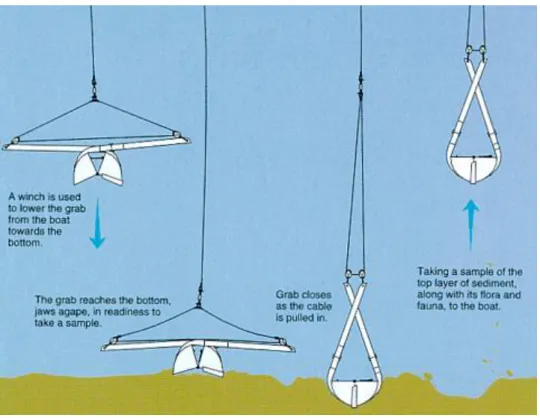
We collected 69 surface sediment samples (depth: 0-5 cm) from Gwangyang, Jinhae, Busan and Ulsan bays using Van Veen grabs (Figure 6-7). Freeze-dried sediment samples (10 g) were extracted with dichloromethane (DCM) using Accelerated Solvent Extractor (Dionex, Sunnyvale, CA, USA) (detail conditions are shown in Table 3). The extracts were concentrated to 2 ml by a TurboVap LV vaporizer (Capiler, Hopkinton, MA, USA) and the solvent was exchanged into hexane.
For the activated alumina column, samples were first eluted with 2% DCM in hexane (70 mL) for PCB and PCN analysis and then eluted a second time with 50% DCM in hexane (80 mL) for PCDD/F analysis. Finally, samples were concentrated to approximately 50 µL and 13C12-labeled internal standards (1613-ISS, 1668-ISS, ED-910) were added to the vials prior to instrumental analysis. After pretreatment procedures, 17 PCDD/Fs, 18 PCBs (indicator PCBs and dioxin-like PCBs), and 15 PCNs were analyzed by gas chromatography (GC, Agilent 7890A, USA) coupled with high-resolution mass spectrometry (HRMS, Auto Spec). Premier, Waters, USA) (Figure 9) by electron impact (EI).
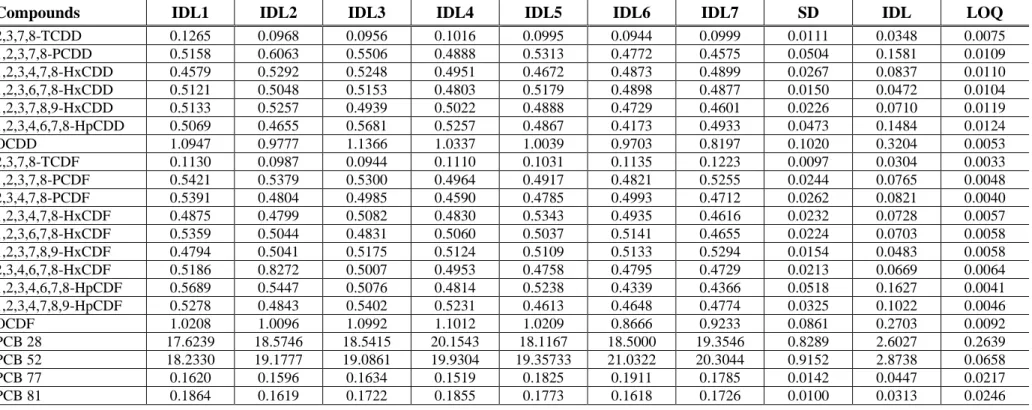
Instrumental limit of detection (IDL) and limit of quantitation (LOQ) were used for data accuracy. The results of instrumental detection limits (IDLs) and limit of quantitation (LOQ) for PCDD/Fs, PCBs and PCNs (unit: pg/g). During the TC analysis, the samples were heated to 900°C in the presence of an oxidation catalyst.
On the other hand, phosphoric acid was added to the inorganic carbon (IC) analysis, the samples were heated up to 200°C. Principal component analysis (PCA) was performed to identify sources according to joint distribution patterns, and spearman correlation analysis was used to test the relationship between TOC content and concentrations of PCDD/Fs, PCBs, and PCNs using IBM SPSS Statistics 20.
RESULTS AND DISCUSSION
Distribution of PCDD/Fs in sediments in industrial bays
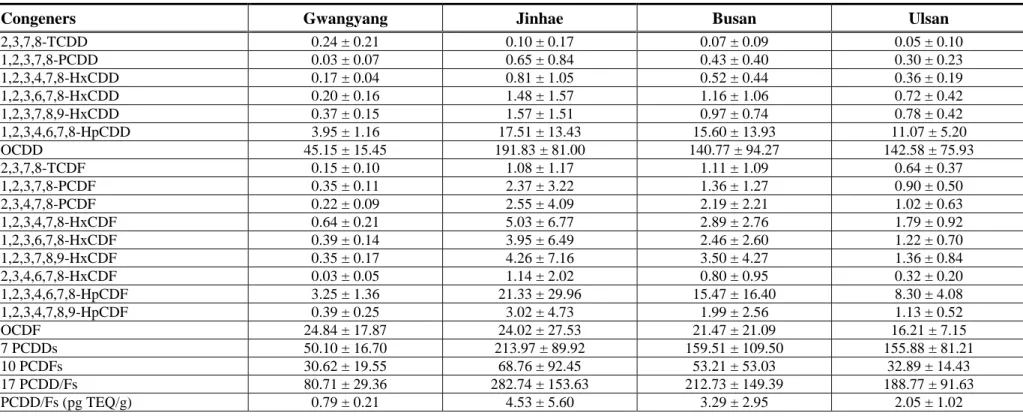
- Concentrations of PCDD/Fs
- Congener profiles of PCDD/Fs
- Source identification of PCDD/Fs
- TOC normalization concentration
Pesticide by-products, such as Pentachlorophenol (PCP) and Chloronitrophs (CNP), contain a large amount of OCDD (Masunaga et al., 2001). During thermal processes, PCDD/Fs are produced at high temperature (above 250°C) from the chlorine precursor by denovo synthesis (Dickson et al., 1992). The concentrations of PCDFs in the steel mill were higher than the concentrations of PCDFs in the previous study (Antunes et al., 2012).
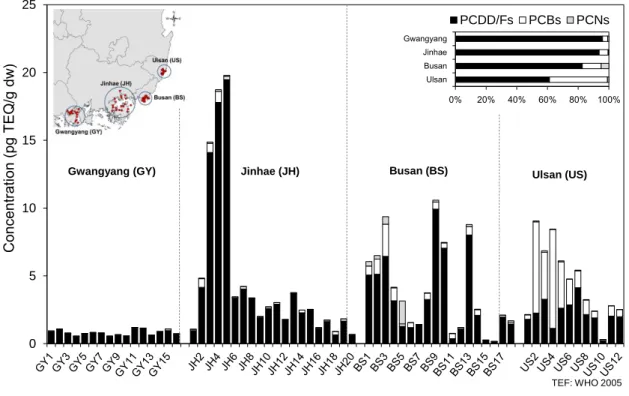
Since the steel production facility is located in Gwangyang Bay, it is estimated that PCDFs were greatly affected by the flue gases of this industry (Dickson et al., 1992). In addition, the samples divided into BS3, BS4, BS8, BS9 and BS10 are located in the inner part of Busan Bay where there is a port with small shipbuilding industries, therefore, these sites were characterized by PCDD/Fs with relatively lower chlorine. low molecular weight and Kow. PCA results of PCDD/Fs in sediment samples from the four bays: (a) dot plot and (b) loading plot.
Several different patterns were observed between PCDD/F concentrations and PCDD/F concentrations normalized to TOC. This indicates that PCDD/F concentration was strongly influenced by organic carbon content at several sites. The normalized concentration of PCDD/F to TOC at JH11 was significantly high due to the low organic carbon content (0.6%).
Overall, the TOC-normalized concentration of PCDD/Fs at this site was higher than at the other sites. Therefore, a significantly high concentration of PCDD/Fs was measured at BS13 due to organic carbon content. a) Concentrations and (b) TOC-normalized concentrations of PCDD/Fs in the four bays.
Distribution of PCBs in sediments in industrial bays
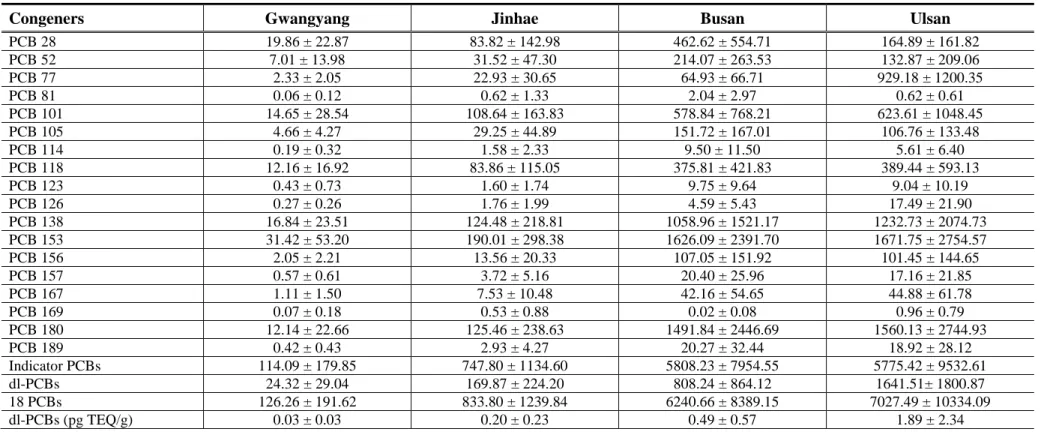
- Concentrations of PCBs
- Congener profiles of PCBs
- Source identification of PCBs
- TOC normalization concentration
These results in Ulsan Bay were consistent with those of a previous study (Moon et al., 2008). In addition, CB-118 and CB-77 were associated with volatilization from technical mixtures of PCBs (Masunaga et al., 2001). This indicates that combustion sources near the four bays may not affect PCB profiles in sediments.
Meanwhile, the sediment samples collected from Gwangyang and Ulsan bays had higher PC2 scores than those from the other bays, and these samples were correlated with dioxin-like PCBs. On the other hand, sediment samples in Busan and Jinhae bays had a lower value of PC2 in the score plot and were characterized by indicator PCBs such as CB-101, CB-118 and CB-52. It suggests that shipping activity and the shipbuilding industry may be the potential sources of PCBs in the bays.
PCA results of PCBs in sediment samples from the four bays: (a) dot plot and (b) loading plot. Similar to the concentration of PCBs, the highest TOC-normalized concentration of PCBs was found in US5 (1.2%). This site is located in the harbor with the automotive and petrochemical industries, leading to a direct flow of PCBs.
In Busan Bay, the TOC-normalized concentration of PCBs decreased at BS3 (45.82 ng/g TOC) due to high organic carbon content (2.6%). Therefore, this sediment sample at this site may be influenced by organic carbon content rather than the local sources. a) Concentrations and (b) TOC-normalized concentrations of PCBs in the four bays.
Distribution of PCNs in sediments in industrial bays
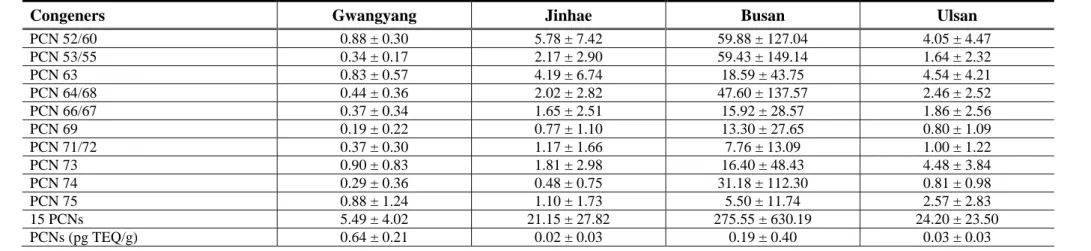
- Concentrations of PCNs
- Congener profiles of PCNs
- Source identification of PCNs
- TOC normalization concentration
- Full congener analysis
Therefore, burning appeared to be an important source of PCNs at almost every sampling site. CN71/72 accounted for 5% of the total PCN concentrations in the four bays. Since CN71/72 was known to be present in commercial mixtures of PCNs such as Halowaxes (Meijer et al., 2001), the effect of halowaxes in the four bay waxes is relatively small. PCA results of PCNs in the sediment samples from the four bays: (a) score plot and (b) loading plot.
Diagnostic ratio analysis was performed to determine the potential sources of PCNs in the sediment samples in the four bays (Figure 19). It indicates that the main source of PCNs in Busan Bay may be technical PCB mixtures. It indicates that the levels of PCNs may be more influenced by the sources than the content of organic carbon. a) Concentrations and (b) TOC-normalized concentrations of PCNs in the four bays.
The average concentrations of PCNs in Busan Bay were much higher than in the other bays. The concentration distribution of PCNs full congeners was almost similar to the distribution of 15 PCNs, except for BS3. The ratio of the concentrations of combustion indicator PCNs to PCN concentrations (tri-octa) was used to evaluate the major sources of PCNs.
If the concentration ratio is more than 0.5, the source of PCNs is related to combustion. The ratio was 0.1 in BS18, located in the outer bay compared to other countries, indicating that technical mixtures of PCNs may be the main sources of PCNs.
TEQ concentration
Ternary plot of concentration of PCDD/Fs, PCBs and PCNs in the sediments of the four bays (a) Concentrations (pg/g), (b) TEQ concentrations (pg TEQ/g). Interim Sediment Quality Guidelines (ISQGs) of Canadian Sediment Quality Guidelines (CSQGs) were 0.85 pg TEQ/g, and Probable Effect Level (PELs) of CSQGs were 2.50 pg TEQ/g (CCME, 2002). In this study, the TEQ concentrations of PCDD/Fs were higher than ISQGs of CSQGs.
In addition, the TEQ concentration of PCDD/F at JH5 (21.58 pg TEQ/g) was also higher than the CSQG PEL. Therefore, the negative impact of PCDD/F on the organism may not be large at almost all sampling sites except JH5.
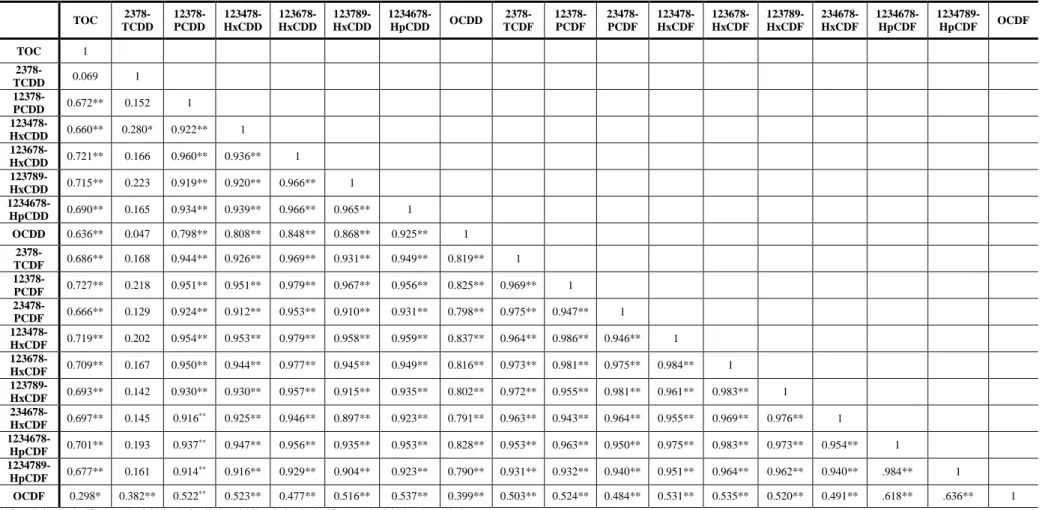
Correlation analysis with TOC
Correlation is significant at the 0.01 level (2-tailed) and *Correlation is significant at the 0.05 level (1-tailed). TOC PCDD/Fs PCDD/Fs (TEQ) dl-PCBs Indicator PCBs PCBs dl-PCBs (TEQ) PCNs PCNs (TEQ). Correlation analysis between TOC and the concentrations of PCDD/Fs, PCBs and PCNs for each bay.
Correlation analysis between TOC and PCDD/F, PCB and PCN concentrations for inner and outer Ulsan Bay.
CONCLUSIONS
Estimation and characterization of PCDD/Fs and dioxin-like PCBs from secondary copper and aluminum metallurgies in China. Characterization of the polychlorinated biphenyls in the sediments of Woods Pond: evidence for microbial dechlorination of Aroclor 1260 in situ. Atmospheric levels and distribution of dioxin-like polychlorinated biphenyls (PCBs) and polybrominated diphenyl ethers (PBDEs) in the vicinity of an iron and steel manufacturing plant.
Instrumental and bioanalytical measures of dioxin-like compounds and activities in sediments of the Pohang area, Korea. Survey on organochlorine pesticides, PCDD/Fs, dioxin-like PCBs and HCB in sediments of the Han River, Korea. Flood estimates and sedimentation of polychlorinated naphthalenes in the northern part of the Baltic Sea.
Congener-specific characterization and sources of polychlorinated dibenzo-p-dioxins, dibenzofurans, and dioxin-like polychlorinated biphenyls in marine sediments from industrialized bays in Korea. Congener-specific composition of polychlorinated naphthalenes, coplanar PCBs, dibenzo-p-dioxins and dibenzofurans in the halowax series. Patterns and sources of PCDD/Fs and dioxin-like PCBs in surface sediments from the East River, China.
Polybrominated, polychlorinated and monobromo-polychlorinated dibenzo-p-dioxins/dibenzofurans and dioxin-like polychlorinated biphenyls in marine surface sediments from Hong Kong and Korea. Occurrence of polychlorinated dibenzo-p-dioxins and dibenzofurans (PCDD/F), polychlorinated biphenyls (PCBs) and polybrominated diphenyl ethers (PBDEs) in Lake Maggiore (Italy and Switzerland).