Recent studies of leveraged buyouts (LBOs) have reported that corporate managers plan buyouts to maximize profits due to undervaluation or overvaluation of target firms; the management buyout (MBO) literature of the 1990s attributes the source of value enhancement to organizational change. In addition, since the mid-1990s, there have been various changes in the private equity (PE) industry, such as the junk bond crisis and the Sarbanes-Oxley Act. Altogether, there is doubt as to the validity of applying findings from historical studies advocating increased MBO effectiveness to the recent and current MBO industry.
Here we repeat the work of Ofek (1994) to re-examine what better explains the improved performance of recent MBOs between 1995 and 2012. We find that organizational change through MBOs contributes to the improvement of MBO performance, which is consistent with the findings of Ofek (1994). Our results support the robustness of the organizational change hypothesis regardless of recent changes in the PE industry.
Introduction
In the event of failed MBO transactions, there will be no changes in ownership or leverage following the cancellation of the MBO. If the organizational change hypothesis is correct, there will be no improvement in the performance of those firms. Such changes in the industry are well described by Kaplan and Strömberg (2009) and Renneboog and Simons (2005).
In this situation, many changes in regulations and economic conditions could have affected how managers achieved operational efficiency through MBOs in the 2000s. Therefore, no change in operational performance for a failed MBO trial is inconsistent with the organizational change hypothesis. Furthermore, we can see that there have been no changes in the MBO hypothesis since Ofek (1994), despite changes in the LBO industry.
Literature Review
In this analysis, the probability of endogeneity caused by selection bias in the sample may be high. Investigating the performance of failed MBO firms, we find that private management information does not induce managers to enter into takeover deals. In Section II, we review the existing literature explaining the performance of MBOs and present the debate between the organizational change hypothesis and the private information hypothesis, both of which explain the improved operating performance observed after MBOs.
Lichtenberg and Siegel (1990) investigate the effects of MBOs that occurred from 1983 to 1986 on plant productivity and find that plant productivity increases within three years of the buyout. Weir, Laing, and Wright (2005) also argue that management engages in buyouts to take advantage of the undervaluation of firms in the market. In the same vein, management has an incentive to exploit the undervaluation of firm values or to manipulate those values to lower the transaction price.
Schadler and Karns (1990) argue for a legal solution that would limit the use of inside information to promote managers' interests and promote efficiency in the financial market (see also Lowenstein (1985)). These authors find abnormally high discretionary expenses, abnormally low discretionary accruals, and losses on asset sales in the year before the MBO. Kaplan and Stein (1993) insist that the growth of the public junk bond market fueled LBO deals in the late 1980s.
Taken together, inconsistent explanations for MBOs' earnings gains have been proposed in the prior literature. These studies argue that the positive performance of VET firms comes from preliminary information about future performance. Moreover, in terms of information asymmetry, some studies report that managers can exploit the overvaluation of their companies in the market to create profit margins by selling their assets.
In contrast, other studies show that improved performance of MBO firms is achieved through organizational change through acquisitions, such as changes in governance and higher leverage.
Sample and Methodology
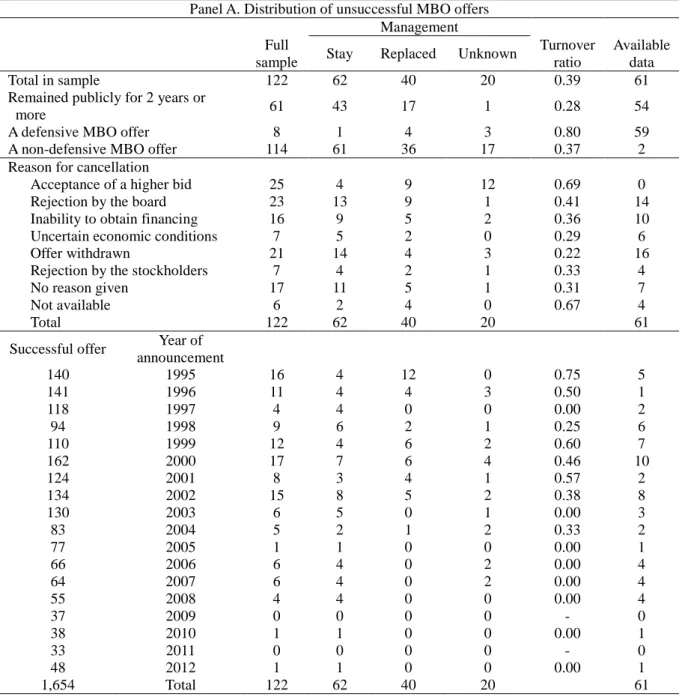
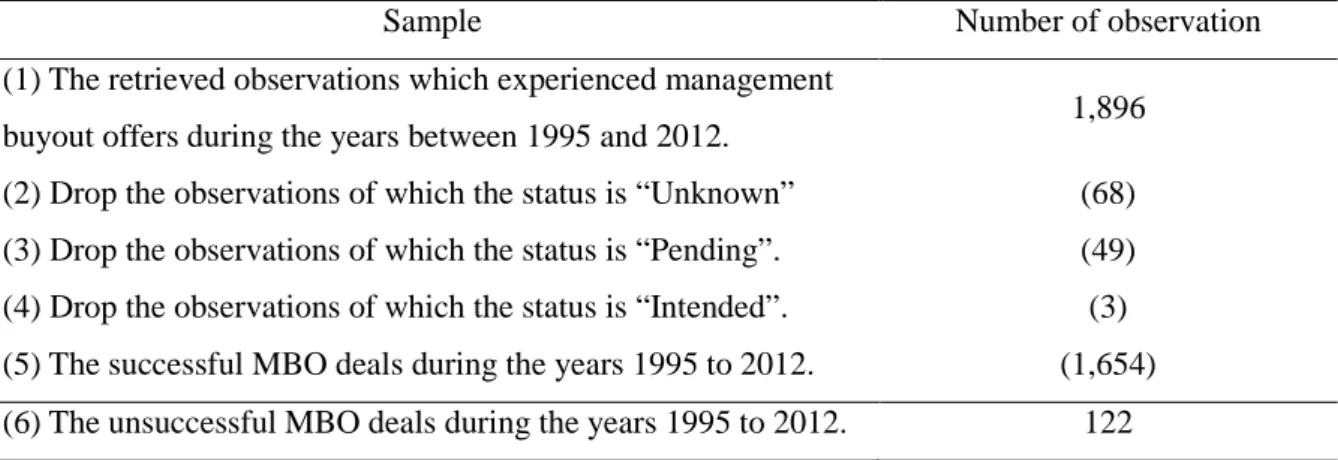
Unsuccessful deals resulting from the illiquidity of the credit market or the low reputation of providers on the credit market are classified under "Inability to obtain financing". Voluntary withdrawals of acquisitions by lead bidders are categorized as “withdrawn bids”. In the “No Reason Given” case, the main part of the divestment agreement between the target and the offeror is unclear due to the absence of a related statement in the SEC filings. In the case of “no reason given,” the prime broker of the severance agreement between the target and the offeror is unclear because there is no related statement in the filings. A defensive MBO bid emphasizes management's cooperation against an existing bid by another group to defend its business against hostile M&A.
Panel C presents the change in ownership of the failed MBO sample in the two years following the offer cancellation. However, 12 of the 25 observations in the subsample are unrelated to the management turnover rate calculation because many cases go private after accepting higher bid prices and fail to report filings. In essence, it is difficult to identify annual trends in managerial turnover due to the insufficient annual sample of failed MBOs.
We obtain the deal value from SDC Platinum or use an estimated value from the target companies' SEC filings. Panel C of Table II shows ownership changes for the sample in the two years following the withdrawal of the MBO offer. Liquidated” consists of businesses or segments that close due to poor performance and that sell off assets or equipment through a Chapter 7 filing.
As the default settings in Eventus, we use the returns that include dividends from the equally weighted indices and calculate abnormal returns in the market model. There is no consensus on the length of the estimation period in the M&A literature. If each manager owns more than 5 percent of the firm's equity, the indicator variables equal one.
AVERAGE OWNERSHIP indicates whether the average ownership of all managers is greater than 5 percent.
Reasons for Improved Operating Performance
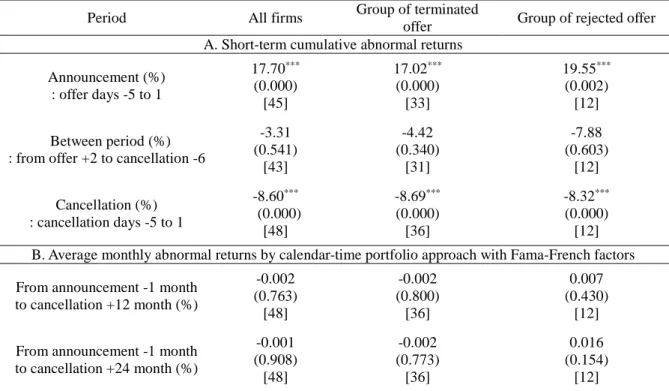
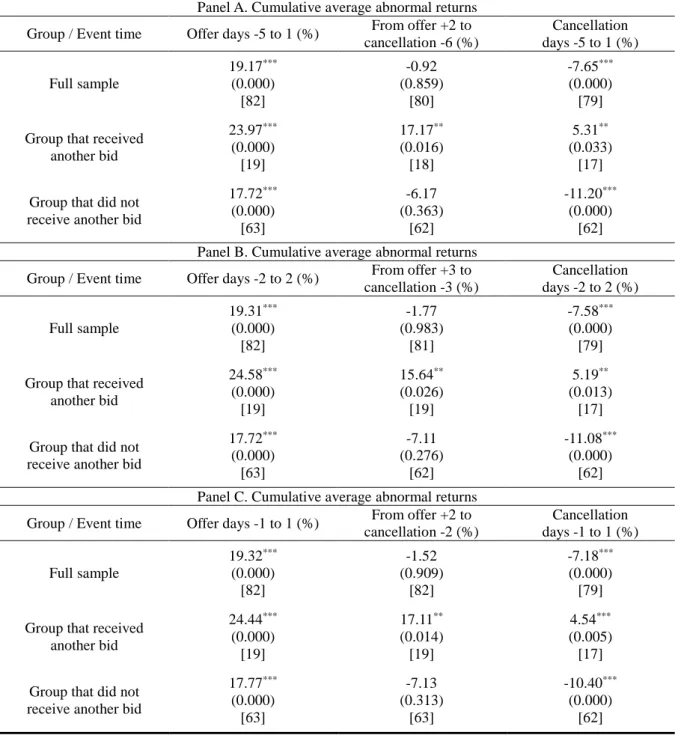
The characteristics of returns will differ depending on the probability of success of the post-announcement acquisition. The first group consists of the sample that received another bid between the offer announcement and the cancellation. Meanwhile, the group that did not receive another bid exhibits a significant decrease in abnormal returns at the time of the cancellation, which decreases the positive return at the time of the offer announcement.
Thus, we determine abnormal returns for firms that are not taken over by other bidders within two years of MBO cancellation in Table IV. As expected, the average CARs at the time of announcement and cancellation of the offer are 17.70 percent and -8.60 percent, respectively. In Panel A, the discontinued and rejected bid groups show average CARs of 17.02 and 19.55, respectively, at the time of announcement.
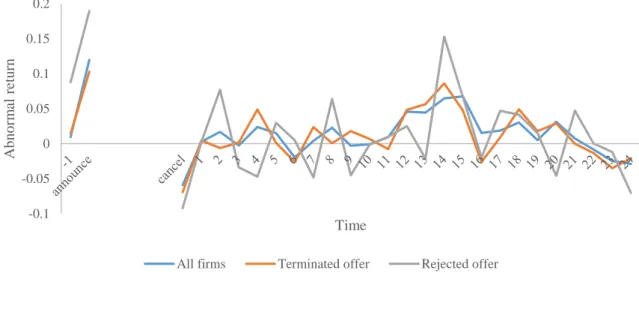
To help understand the long-term performance of stocks, Figure I shows the average monthly abnormal returns of the three groups in Table IV calculated by portfolio regression over calendar time. This is how we draw the unusual returns of the overlapping period: -1 month to the publication date and cancellation date to +24 months. This means that the variance of the monthly abnormal returns of the rejected offer group is much larger than that of the canceled group.
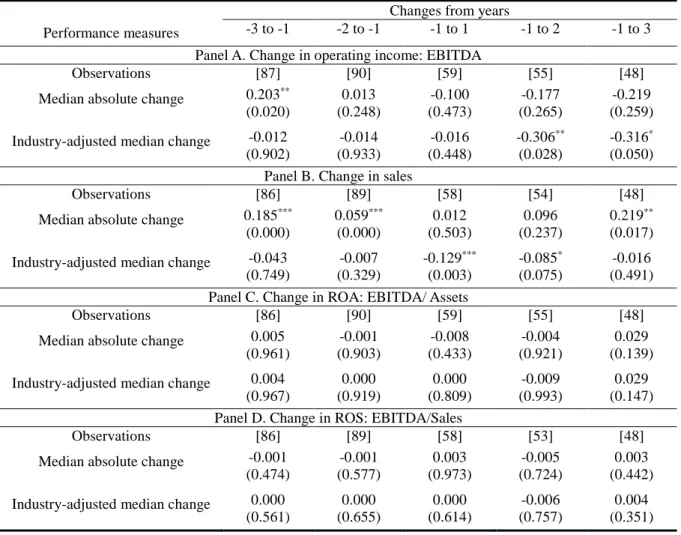
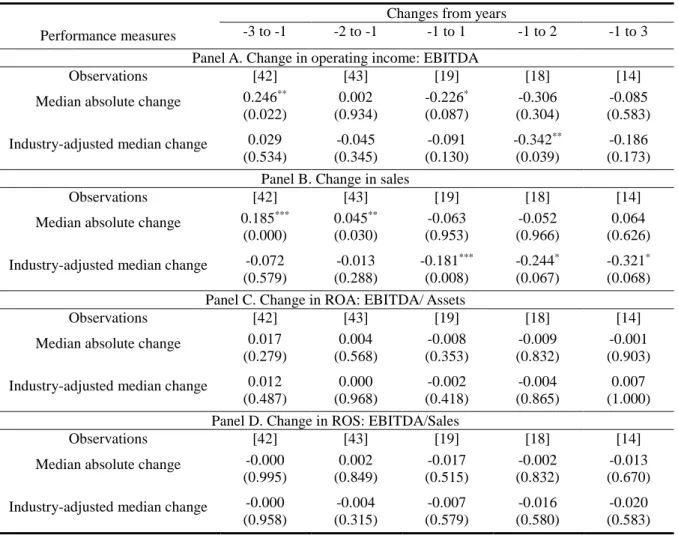
This section examines the business performance of companies that have experienced a failed MBO offer. 5 million at the end of year -1 firms are excluded from the calculations of the industry median change to avoid skewing the median values by undersized firms. Overall, there are no noteworthy changes in performance for all firms with unsuccessful bids.
Again, using the involuntary canceled sample, we analyze changes in the accounting performance of the subsample.
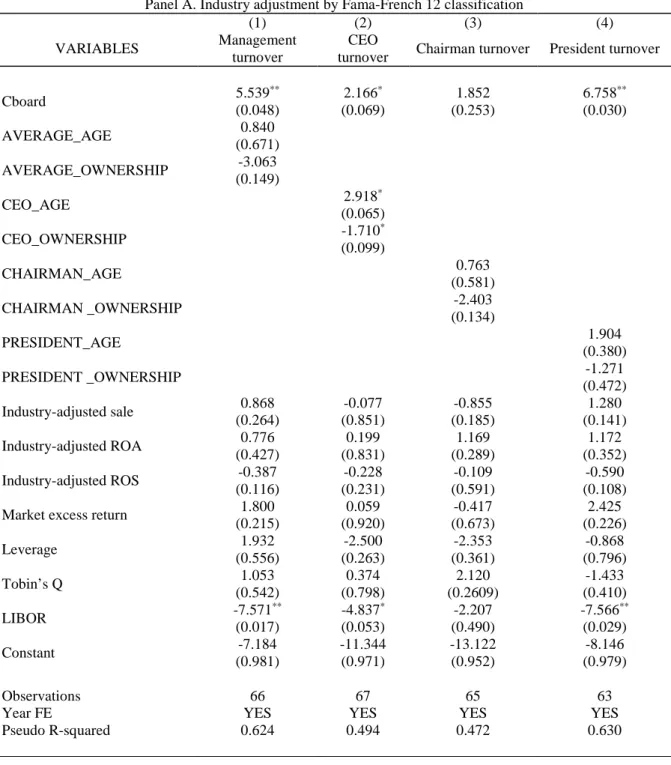
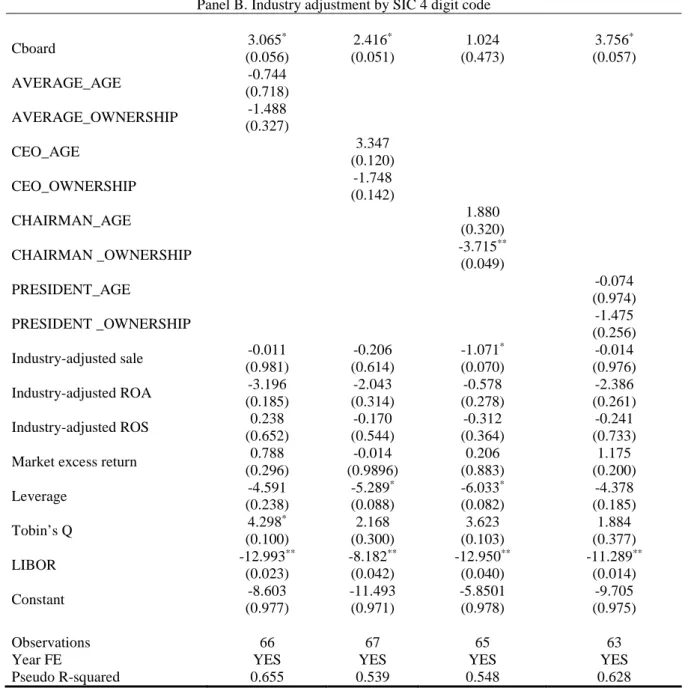
Management Turnover and Sample Selection Bias
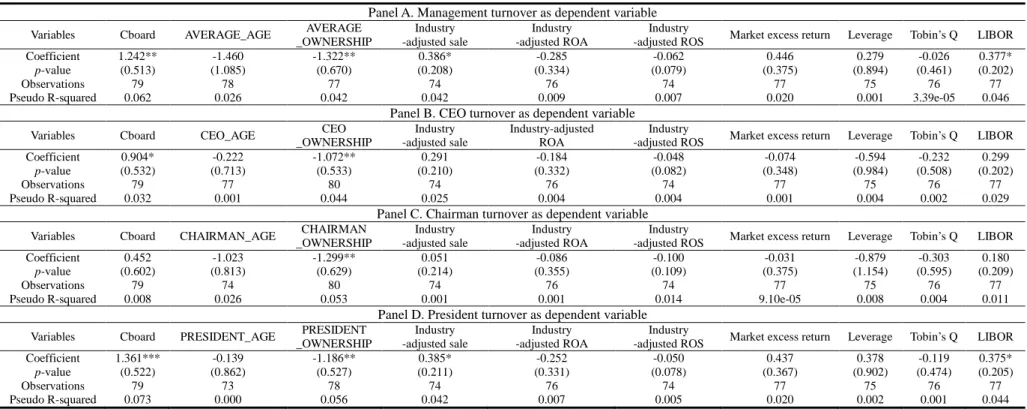
In Table VIII, the dependent variables are the same as those shown in Table VII. When considering the argument that staggered boards defend their independence against hostile M&As (Bebchuk, Cohen, and Ferrell (2009)), the significantly positive coefficient for Cboard reflects the conflict between the other board members and the management that participated in a buyout deal. In sum, favorable capital market conditions encourage management to engage in MBOs that involve a higher probability of managerial turnover.
AVERAGE_ OWNERSHIP means whether the average ownership of all management is greater than 5 percent. The management-changed sample in Panel A indicates a change in at least one of the top three managers. In Panels B to D, we decompose management into individual members: the CEO, chairman and president.
The full sample excludes observations in which management replacement is not known and is also divided into two groups in which management is replaced or not after the announcement of the MBO. In Table X, we reexamine the stock performance of failed MBO deals subject to management turnover in order to be removed. In the first column of Panel A, the average CAR around the MBO announcement for the management-changed sample is 27.77 percent and the CAR around the MBO cancellation is −13.15 percent.
The characteristics of the returns would not be different from those of the other group where management is not replaced. For the unchanged management sample, the average CAR around the offer announcement and cancellation is 16.50 percent and -5.27 percent, respectively. However, the magnitude of the negative CAR around cancellation for the sample with changed leadership is larger than that observed for the sample with unchanged leadership.
This finding suggests that the market reacts more negatively to management turnover in the failed MBO sample.
Conclusion
In terms of robustness, even if we use the subsample where management does not change, there are negative returns on the regret day.
Acknowledgement