The densification and grain growth behavior of pure UN powder during SPS was investigated over a wide range of temperatures (from 1500 to 1800 °C) and times (from 5 to 180 min) under a uniaxial pressure of 70 MPa. The thermal conductivity of SPSed UN/GdN and UN/Gd2O3 composite pellets was measured from 25 to 1000 °C using laser flash analysis (LFA).
INTRODUCTION
Motivation
Since previous studies have shown significantly improved oxidation resistance, it is thus becoming quite conceivable to utilize the FN fuel in LWR. Considering that the performance of nuclear fuel under irradiation is greatly affected by the fabrication characteristics such as fuel density, porosity, grain size and stoichiometry, a comprehensive study of the sintering behavior of FN fuel is necessary to closely control the properties of the fuel.
Objectives
Furthermore, a decrease in thermal conductivity in UN pellets with increasing Gd concentration is predicted in a similar manner to the decrease in thermal conductivity of (U1-x,Gdx)O2 with increasing Gd concentration [43,44].
LITERATURE REVIEWS
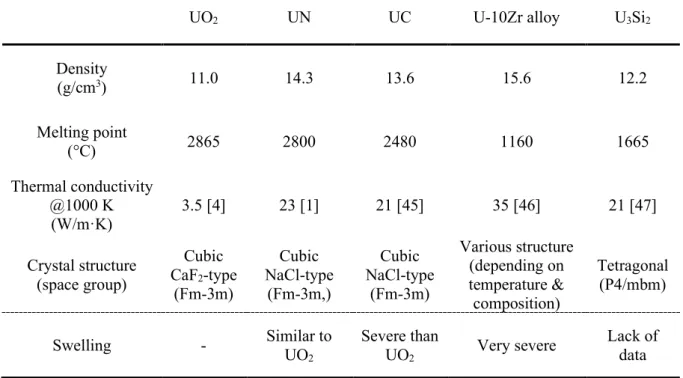
Characteristics of uranium nitride
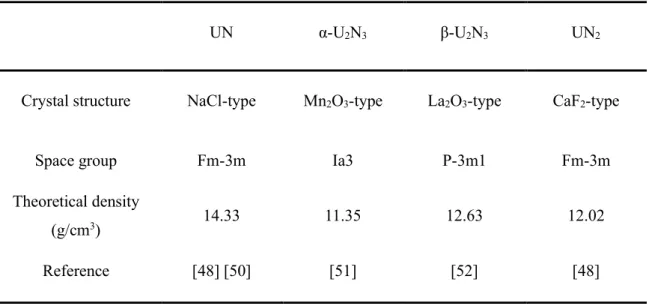
- Crystal structure
- Thermal properties
- Irradiation behavior
The origin of the high thermal conductivity of UN has been examined in several studies [69–. Thermal conductivities of representative nuclear fuels for comparison: U-10Zr and U-20Zr alloys from Ogata et al.
![Figure 2-1. Uranium-nitrogen binary phase diagram (reproduced from H. Tagawa [57])](https://thumb-ap.123doks.com/thumbv2/123dokinfo/10489318.0/23.892.133.779.149.681/figure-uranium-nitrogen-binary-phase-diagram-reproduced-tagawa.webp)
Fabrication of nitride fuels
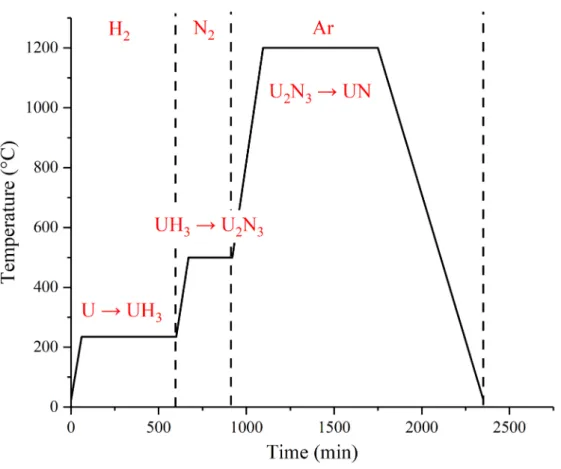
- UN powder synthesis
- UN pellet fabrication
The synthesized UN2 energy is then decomposed into UN powder in an inert atmosphere at 1100 °C. However, UN powder shows poor sintering than oxide or carbide powder due to the low diffusivity of uranium ions in UN.
Burnable absorber
- Burnable absorber element candidates
- Burnable absorber configurations
- Effect of BA presence on fuel thermal conductivity
On the contrary, UN's thermal conductivity is dominated by electronic conduction as previously described in section 2.1.2. Therefore, a thermal conductivity degradation behavior of UN rather follows that of the metallic fuels as shown in Equation 2-6.
![Table 2-2. General properties of burnable absorber elements [101]](https://thumb-ap.123doks.com/thumbv2/123dokinfo/10489318.0/38.892.115.787.165.457/table-2-general-properties-burnable-absorber-elements-101.webp)
EXPERIMENTAL
Sample preparation
- Powder synthesis
- Spark plasma sintering
- Thermal etching
Notably, the pure Gd2O3 pellet was prepared at a relatively low temperature of 1000 °C and 10 min due to the phase instability problem (described in Section 5.2.1). To avoid the use of the toxic etchant, a thermal etching method was used for the first time in this study.

Sample characterization
- Phase and microstructure analysis
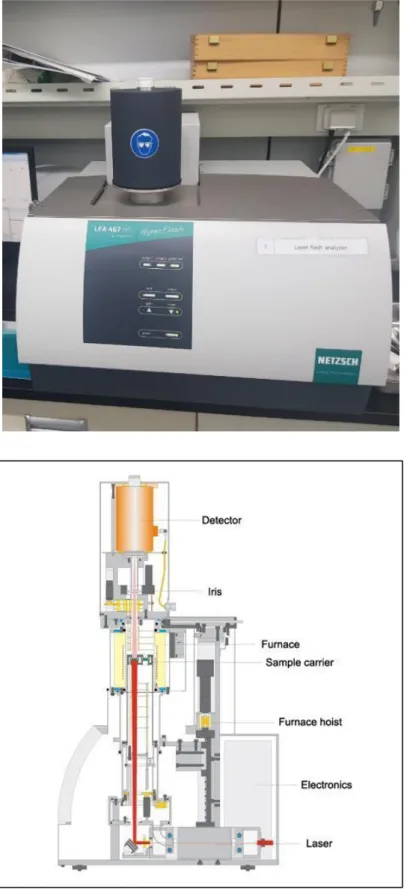
- Thermophysical property measurements
The density of the SPSed pellets was measured at room temperature using a densitometer (shown in Figure 3-8). The CLTE values of the samples were calculated using the reference data of the standard Al2O3 rod of the same dimension, which was previously measured under the same conditions. For the UN pure and composite pellets, no commercially available laboratory could be found that would accept those samples due to the radioactive nature of the uranium-containing samples.
First, a laser pulse of high intensity and short duration heated the bottom of the sample surface. The infrared (IR) detector then recorded the temperature change of the surface on the opposite side as a function of time. Both sides of the sample surfaces were coated with a thin layer of graphite to ensure complete absorption of the laser.
The heat capacity of the composite pellet was calculated by the Kopp-Neumann law, i.e., it is assumed that the heat capacity of the mixture depends on the composition of the elements and not on the microstructure. In this study, since most of the sample densities were close to 97% TD, the data were not corrected to single density using the Maxwell-Eucken correlation.
RESULTS
Pure UN pellets
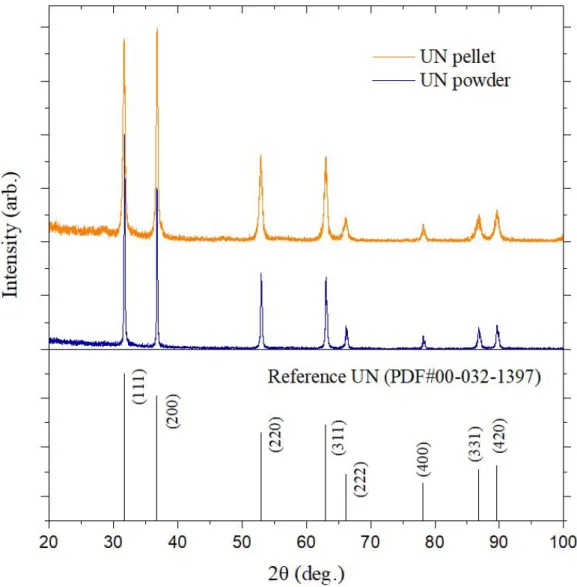
- XRD patterns
- Density
- Microstructure
- Grain size and grain growth rate
Density of the UN pellets SPSed for 10 minutes (gray) and 60 minutes (red) as a function of the sintering temperature. It is notable that sub-micron pores appeared to align on the pellet sintered at 1600°C for 10 minutes (see Figure 4-5b) and the pellet sintered at 1700°C for 60 minutes (see Figure 4 -8a). indicating that the continuous pore channels were formed along the grain boundaries during the rapid compaction. Most pores were located at grain boundaries and triple junctions (i.e., intergranular pores), but some pores were also present within the grains (i.e., intragranular pores).
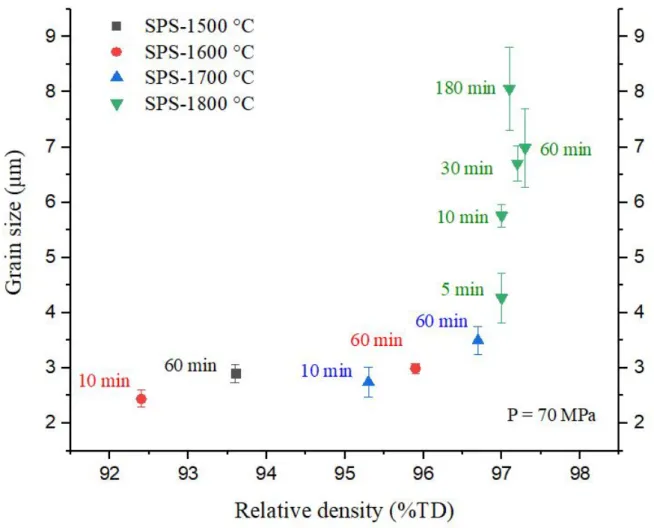
Large pores were widely observed at grain boundaries and triple junctions, which was consistent with the microstructural features of the polished pellet surface (Figure 4-10b). Notably, a trapezoidal void was presented in a pellet sintered for 60 minutes (indicated by the arrow in Figure 4-19b). The measured grain sizes of the UN pellets are shown in Table 4-2 and shown in Figure 4-21 as a function of sintering time.
In addition to the sintering temperature, the grain growth rate of pellets sintered at 1800 °C showed a decreasing tendency with increasing residence time. The average grain growth rate was 0.298 μm/min at an early stage of 5–10 min; however, the velocity decreased to 0.009 μm/min with increasing residence time up to 180 min, indicating the saturation of grain size in the later part of the SPS process.
Gadolinium added UN composite pellets
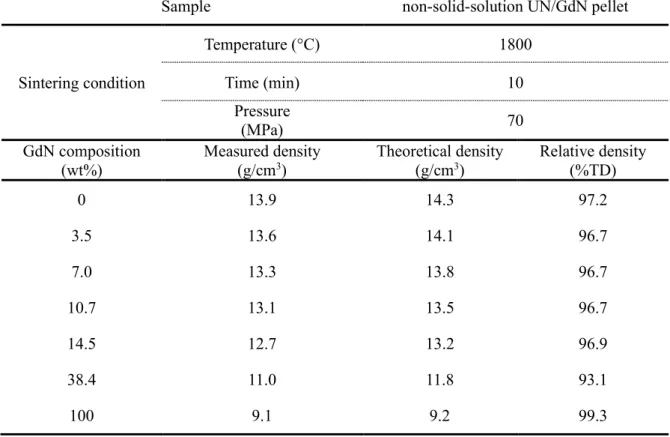
- Density
- Thermal expansion coefficient
- XRD patterns
- Lattice parameter
- Microstructure
- Specific heat capacity
- Thermal diffusivity
- Thermal conductivity
This is the clear evidence of the solid-solution (U1-x,Gdx)N phase formation in UN/GdN composite grains SPSed at 2000 °C. It is noted that the solid solution UN/GdN composite pellets (green triangle in Figure 4-29) follow Vegard's law up to 20 at%. The two-phase microstructures were clearly revealed by the contrast difference between the Gd2O3 and VN phases, i.e. the darker contrast for the Gd2O3 phase with lower atomic number (Z) density and the brighter contrast for the VN phase with higher Z density.
The microstructures of the non-solid solution VN/GdN grains are shown in the SEM/BSE images (see Figure 4-31). The non-solid solution granules, which were sintered at the relatively low temperature (1800 °C) for the short term (10 min), showed the GdN additive particles (darker) and UN matrix (brighter) phases. The solid-solution grains, sintered at 2000 °C, showed slightly different microstructures than those of non-solid-solution grains.
The boundary between the VN and GdN phases was becoming blurred with increasing GdN content compared to the previous non-solid solution VN/GdN samples. The difference between those values increased with increasing temperature: the thermal diffusivity of the non-solid solution UN- 10.7wt%GdN pellets was ~43% higher than that of the UN-10.0wt%Gd2O3 at 1000 °C. The solid solution UN-14.5wt%GdN pellet showed 20–65% higher thermal conductivity than the UN-15wt%Gd2O3.
In general, UN/GdN pellets in non-solid solution exhibited 16–25% higher thermal conductivity than the solid solution containing UN/GdN pellets.
DISCUSSION
SPS behavior of pure UN powder
- Crystal structure of SPSed UN pellets
- Effect of pore distribution on maximum density achieved
- Time- and temperature-dependent SPS behavior
- Effect of pressure and particle size on SPS behavior
Another possible consideration given to the maximum achievable VN grain density was the presence of the large trapezoidal void shown in Figure 4-19b (yellow arrow). The grain size-density trajectory graph clearly shows two distinct SPS stages in accordance with the sintering temperature. The effect of sintering pressure could be seen from the similar study [38], where UN granules were sintered under different pressures (45, 90 and 135 MPa) using SPS.
In the previous study, grain size increased with increasing pressure in a relatively low pressure region (< 90 MPa), while grain growth was suppressed at high pressure of 135 MPa. Thus, the large grain size (~31 μm) of the pellet was obtained under 90 MPa at a sintering temperature of 1650 °C for 15 min; however, this value is much larger than even the largest grain size (~8 µm) of this study, obtained at a sintering temperature of 1800 °C for 180 min under 70 MPa. Furthermore, the variation in the final grain size can be further explained by the effect of particle size distribution (PSD) on the microstructure of the sintered pellets.
122] demonstrated, from kinetic Monte Carlo modeling of solid-state sintering, that compacts sintered from a powder with a wider PSD exhibited a small grain size compared to that from a narrower PSD. Therefore, the wide range of OKB powder PSD (1–20 µm) used in this study may have resulted in the smallest grain size.
- Phase stability of Gd 2 O 3 in UN matrix
- Phase stability of GdN in UN matrix
- Thermal conductivity of UN-GdN composite pellets
The thermal conductivities of non-solid solution UN/GdN pellets (blue triangle in Figure 5-2) decreased almost linearly with increasing Gd composition at both 500 and 1000 °C, while the thermal conductivities of solid solution UN/GdN pellets are slightly off from the theoretical reference line. As shown in Figures 5-3 to 5-6, the thermal conductivity of non-solid solution UN/GdN pellets (violet diamond) was well matched with the effective thermal conductivity estimated by the Maxwell model (blue triangle). Therefore, the Maxwell model would slightly overestimate/underestimate the thermal conductivity of UN/GdN composites at low/high temperatures.
On the other hand, the different trend was observed in the thermal conductivity of the solid solution containing UN/GdN pellets (yellow triangle). All samples containing solid solution showed thermal conductivity values 15-20% lower than Maxwell's prediction or that of UN/GdN pellets not containing solid solution. 72] that the thermal conductivity of UN is mainly dominated by the thermal conductivity of the electrons rather than the thermal conductivity of the lattice.
Therefore, it is highly expected that the thermal conductivity of the solid solution containing UN/GdN pellets is much lower than that of its two-phase counterpart. Thermal conductivity of SPSed UN + 10.7wt%GdN composite pellet with values calculated by Maxwell model.
![Table 5-1. The solid to solid phase transformation temperatures of pure Gd 2 O 3 at ambient pressure [123]](https://thumb-ap.123doks.com/thumbv2/123dokinfo/10489318.0/123.892.106.767.187.401/table-solid-solid-phase-transformation-temperatures-ambient-pressure.webp)
CONCLUSIONS
Densification and grain growth behavior of UN during SPS
Thermal conductivity of gadolinium compounds added UN burnable absorber fuel pellets
The thermal conductivity of two-phase UN/GdN was 88% higher at 1000 °C than that of UN/Gd2O3, while UN/GdN pellets in solid solution showed slightly lower thermal conductivity than two-phase UN/GdN pellets. Although the solid solution phase between UN and GdN would hardly form at the proposed SPS temperature between C, considering that the solid solution phase could form later due to the increased atomic diffusivity under irradiation conditions, the centerline temperature of UN/GdN combustible absorber fuels could calculated conservatively based on thermal conductivity of UN/GdN pellets in solid solution. Myatt, Kinetics of oxidation of FN and U(CO) in carbon dioxide, steam and water at elevated temperatures, Corros.
Wallenius, Fabrication of fully dense uranium nitride grains using hydride-derived powders with spark plasma sintering, J. Watanabe, The effect of gadolinium content on the thermal conductivity of near-stoichiometric (U,Gd)O2 solid solutions, J .Kerrisk, Electrical and Thermal Transport Properties of Uranium and Plutonium Carbides: A Review of the Literature, 1976.
Serizawa, Formation of a nitrogen-rich α-U2N3+x phase by the reaction of uranium with an ammonia stream, J. Benedict, Solubility of solid fission products in uranium and plutonium carbides and nitrides Part I: Literature review in experimental results, euro.
Thermal diffusivities of samples measured
Thermal conductivity of samples measured