저작자표시-비영리-변경금지 2.0 대한민국 이용자는 아래의 조건을 따르는 경우에 한하여 자유롭게
l 이 저작물을 복제, 배포, 전송, 전시, 공연 및 방송할 수 있습니다. 다음과 같은 조건을 따라야 합니다:
l 귀하는, 이 저작물의 재이용이나 배포의 경우, 이 저작물에 적용된 이용허락조건 을 명확하게 나타내어야 합니다.
l 저작권자로부터 별도의 허가를 받으면 이러한 조건들은 적용되지 않습니다.
저작권법에 따른 이용자의 권리는 위의 내용에 의하여 영향을 받지 않습니다. 이것은 이용허락규약(Legal Code)을 이해하기 쉽게 요약한 것입니다.
Disclaimer
저작자표시. 귀하는 원저작자를 표시하여야 합니다.
비영리. 귀하는 이 저작물을 영리 목적으로 이용할 수 없습니다.
변경금지. 귀하는 이 저작물을 개작, 변형 또는 가공할 수 없습니다.
Master’s of Engineering
GEO-POLYMER CONCRETE SOLIDIFICATION OF FOUNDRY SAND AND FLY ASH: CHARACTERIZATION OF HEAVY METAL LEACHING AND
OPTIMIZATION OF COMPRESSIVE STRENGTH
The Graduate School of the University of Ulsan Department of Civil and Environmental Engineering
Venkatesan Mayandi
[UCI]I804:48009-200000014062 [UCI]I804:48009-200000014062
GEO-POLYMER CONCRETE SOLIDIFICATION OF FOUNDRY SAND AND FLY ASH: CHARACTERIZATION OF HEAVY METAL LEACHING AND
OPTIMIZATION OF COMPRESSIVE STRENGTH
Advisor: Professor Hung-Suck Park
A Thesis
Submitted to
the Graduate School of the University of Ulsan In Partial Fulfillment of the Requirements
for the Degree of
Master’s of Engineering
By
Venkatesan Mayandi
Department of Civil and Environmental Engineering University of Ulsan, South Korea
2017
GEO-POLYMER CONCRETE SOLIDIFICATION OF FOUNDRY SAND AND FLY ASH: CHARACTERIZATION OF HEAVY METAL LEACHING AND
OPTIMIZATION OF COMPRESSIVE STRENGTH
This certifies that the thesis of Venkatesan Mayandi is approved
Department of Civil and Environmental Engineering University of Ulsan, South Korea
November 2017
TABLE OF CONTENTS
ABSTRACT ... 7
1. INTRODUCTION ... 9
1.1 Background of study ... 9
1.2 Objective and scope ... 12
1.3 Thesis structure ... 12
2. LITERATURE REVIEW ... 13
2.1 Ordinary Portland cement (OPC) ... 13
2.2 Geo-polymer concrete (GPC) ... 14
2.2.1 Geo-polymerization process... 15
2.2.1 Mechanism of heavy metal immobilization ... 16
2.3 Foundry sand replacement in concrete review ... 17
2.4 Key components of GPC ... 21
2.4.1 Fly ash ... 21
2.4.2 Ground granulated blast furnace slag (GGBFS) ... 22
2.4.3 Waste foundry sand ... 23
2.5 Heavy metals in geo-polymer concrete ... 23
2.5.1 Lead (Pb) ... 24
2.5.2 Chromium (Cr) ... 24
2.5.3 Copper (Cu) ... 25
2.5.4 Zinc (Zn) ... 25
2
2.5.5 Nickel (Ni) ... 26
2.5.6 Iron (Fe) ... 26
2.6 D-Optimization ... 27
3. MATERIALS AND METHODS ... 29
3.1 Materials ... 29
3.1.1 Cement ... 29
3.1.2 Fly ash ... 29
3.1.3 GGBFS ... 30
3.1.4 Foundry sand ... 30
3.1.5 Fine aggregate ... 30
3.1.6 Coarse aggregate ... 30
3.1.7 Alkaline solution ... 31
3.2 Statistical experimental mixture design ... 31
3.3 Mixture design calculation of GPC ... 33
3.4 OPC and GPC Specimen ... 34
3.4.1 Specimen preparation ... 34
3.4.2 Curing ... 35
3.5 Physico-chemical characterization ... 37
3.5.1 Compressive strength ... 37
3
3.5.2 Crystal structure and chemical characterization ... 38
3.5.3 Determination of heavy metal content in incineration fly ash ... 39
3.5.4 Heavy metal leaching evaluation ... 40
4. EXPERIMENTAL RESULTS AND DISCUSSION ... 41
4.1 Heavy metal contents and leaching concentrations ... 41
4.2 Compressive strength ... 49
4.3 FE-SEM &XRD analysis ... 52
4.4 Response surface optimization ... 55
4.5 Statistical results ... 56
4.6 Analysis of responses ... 61
4.7 Implication of the results ... 65
5. Conclusion ... 67
REFERENCES ... 69
4
LIST OF FIGURES
Figure 1-1 Geo-sand mining in south India ... 10
Figure 2-1 Geo-polymerization process(adapted: Rao & Liu, 2015) ... 15
Figure 2-2 Heavy metal immobilization mechanism (adapted: Zhuang et al., 2016) ... 17
Figure 3-1 Cylindrical shaped mold for casting ... 35
Figure 3-2 Curing the specimen ... 36
Figure 3-3 Compressive test machine ... 37
Figure 3-4 Specimen after the compression ... 38
Figure 4-1 Heavy metal leaching for (a) Pb, (b) Cr, (c) Cu, (d) Fe, (e) Ni and (f) Zn ... 48
Figure 4-2 Compressive strength with compression of 7th and 28th day ... 51
Figure 4-3 FE-SEM images ... 53
Figure 4-4 XRD analysis to determine the patterns before solidification ... 54
Figure 4-5 XRD analysis to determine the patterns after solidification ... 54
Figure 4-6 represents the 7th day predicted VS actual compressive strength values ... 59
Figure 4-7 represent 28th day predicted VS actual compressive strength values ... 59
Figure 4-8 7th day normal plot of residuals ... 60
Figure 4-9 28th day normal plot of residuals ... 60
Figure 4-10 7th day contour plot ... 62
Figure 4-11 28th day contour plot ... 62
Figure 4-12 7th day response surface plot ... 63
Figure 4-13 28th day response surface plot ... 63
Figure 4-14 7th day fine aggregate and foundry sand component graph ... 64
Figure 4-15 28th day fine aggregate and foundry sand component graph ... 64
5
LIST OF TABLES
Table 2-1 Selected literatures for the application of Response Surface Methodology (RSM)
... 28
Table 3-1 Optimization mixture design (wt%) ... 32
Table 3-2 Mix design of GPC (Unit, Kg in 1m3) ... 34
Table 3-3 Chemical compositions of materials ... 39
Table 4-1 Heavy metals content and leaching concentration of fly ash, foundry sand, and GGBFS ... 42
Table 4-2 KSLP Leaching concentration of heavy metal in different mixing ratios ... 44
Table 4-3 Compressive strength of specimen for various tests and the conventional concrete ... 50
Table 4-4 Statistical analysis of compressive strength in solidified GPC on 7th day ... 57
Table 4-5 Statistical analysis of compressive strength in solidified GPC on 28th day ... 57
Table 4-6 Comparison of heavy metal leaching and compressive strength research finding in cured concrete ... 66
6
ACKNOWLEDGMENT
I am very Thankful to all the professors in the department of Civil and Environmental engineering. I have learnt a lot from them during course study and valuable discussions.
I am very thankful to my advisor Professor Hung-Suck Park for the financial help, encouragement, support, and valuable suggestions during the entire period of my study and research. His proper and timely guidance, kindness, teaching and motivation made this thesis to be written within due time. Without his guidance, it would not be possible for me to complete this thesis on time.
I am very thankful to all my laboratory members and members of Centre for Clean Technology and Resource Recycling, University of Ulsan for their help, valuable discussions, and providing family like environment during my entire study. I would like to special thanks to our previous lab manager, Mr. JinWoong Beak and lab member Dr.
Angelo Earvin Sy Choi, who always helped me whenever I got in trouble or needed help in my research.
I am very thankful to my family members for their prayers, encouragement, help, and motivation during my entire study period. I am very thankful to my elder brother; Nanda Kumar Venkatesan who always encouraged me for my higher studies.
I am very thankful to Dr.Dileep Kumar Appana, who recently completed his doctorate study from University of Ulsan. He was always very helpful during my stay here in Ulsan, South Korea. And I am very thankful to my Korean friend Anhyunji, she was always very helpful during my stay here in Ulsan, South Korea.
7
ABSTRACT
This research work evaluated the structural and environmental performance of partial fine aggregate replacement in low calcium fly ash in geo-polymer concrete (GPC), which consequently reduces its carbon footprint. The novelty of this research work is primarily in the utilization of waste foundry sand for partial replacement of fine aggregate in GPC. The brand name for a binder is Geo-Polymer (alkaline solution), which is emerging as an innovative environment-friendly construction material.
In this study, we examined the effect of mixture ratios of ground granulated blast furnace slag (GGBFS), waste foundry sand, and fly ash on GPC characteristics. The cylindrical GPC sample mould size 100×200mm was made based on the statistical experimental design with varying fine aggregate (30–55 wt%), foundry sand (15–40 wt%) and fly ash (20–30 wt%). The total heavy metal concentrations in the material ash are determined by the method defined by Baker and Amacher, while heavy metal leaching by the MBA method and Korean standard leaching method. Field emission-scanning electron microscopy and energy dispersive X-ray diffraction (XRD) were used for the morphological characterization and mineral phase analysis.
The optimum compressive strength of GPC was 19.0Mpa (7th day) and 22.2Mpa (28th day) from the mixture percentage of 51.9wt% fine aggregate, 24.8wt% foundry sand and 23.3wt% fly ash. Under the same experimental condition, this was higher than that of the conventional concrete which was 16.5Mpa (7thday) and 18.5Mpa (28thday), respectively. The compressive strength of GPC increased with the increase in curing time
8
from 7 to 28 days, respectively, which is due to the improved bonding of silicon dioxide and calcium oxide on GPC. Furthermore, cured GPC specimen achieved heavy metal immobilization in the range of 98-100% which is promising for environmental applications. The alkaline solution used for GPC converted the heavy metals compounds in the materials into highly insoluble metal hydroxide and simultaneously encapsulates the fly ash thermal residue. The leaching heavy metal concentration of cured GPC is Pb (0.019mg/l), Cr (0.013mg/l), Cu (0.013mg/l), Fe (0.6mg/l), Ni (0.067mg/l) and Zn (0.02mg/l).
These results ascertained that foundry sand can be used efficiently as an eco- friendly construction material in GPC by substituting raw materials which result in a cost carbon emission reduction. Though, this research shows the potential of substituting fine aggregate by foundry sand, further research are required to practically apply in the real field, considering the field condition and result of this fundamental experimental study.
9
1. INTRODUCTION 1.1 Background of study
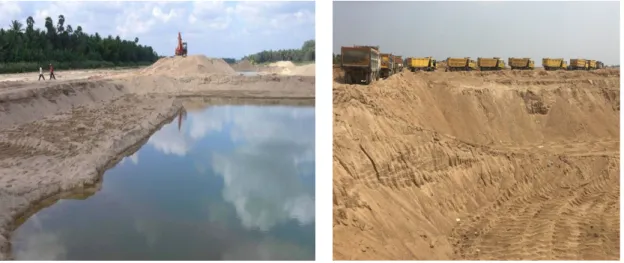
Fine aggregate (sand) is being depleted at a higher rate to meet the growing demand of large scale infrastructure construction. In Tamil Nadu, a state province in southern India, sand mining is increasing day by day to meet this demand. India's construction works planned to generate $165 billion of GDP in a financial year and therefore construction materials, especially concrete is required in large amount which consumes millions of tons of sand. New estimates by the researchers and media groups report that it this demand may increase further to 500 million metric tons annually to generate additional $ 50 billion a year approximately (Rajshekhar, 2017).
With such kind of exploitation of the river sand, the natural river water flow is being destroyed which may lead to devastating neighboring environment and damaging ecosystem. The consequences such as river water not reaching small reservoir and lakes, and therefore effecting farmer’s every day agricultural necessities are considerable. During sand mining, heavy metals are leached which degrades the quality of water. Therefore, sand performs an important role in protecting our ecosystem. Our ecosystem is very damaged by sand mining and is required to be protected (Saviour & Stalin, 2012). So this research focus on utilizing waste foundry to replaced fine aggregate. The foundry sand is a high quality silica sand by-product from the production of both ferrous and non-ferrous metal casting industry and creates environmental problems because of its improper
10
disposal. Thus, its usage in building material, construction and in other fields is essential for reduction of environmental problems. About 12 million tons of waste foundry sand is produced by these casting industries in the United States alone
Figure 1-1 Geo-sand mining in south India
Moreover, another problem associated with the construction sector is the consumption of cement. After water, the world’s most utilized resource or material is Portland cement. The Portland cement is most widely used in the construction sector and during the year 2016 alone, nearly 4200 million metric tons of cement was produced globally. Worldwide, China and India is the world’s largest producer of cement. Based on the cement usage and production for the year 2016 worldwide, China produced 2480 million metric tons while India produced 290 million metric tons of cement. So, worldwide 57.2% cement was produced in China, which means China was contributing to half of the production globally. According to Bassi et al. (1999), from cement production industry, 0.87 ton of carbon dioxide is emitted from 1 ton of cement production. As a
11
result, the construction industry needs alternative binding material to replace the Portland cement for achieving an eco-friendly and ecologically sustainable concrete. Further, studies can be found that have been done to partially or completely replace some material like fly ash, rice husk, GGBFS, etc., in Portland cement. So in this study Portland cement utilized low calcium fly ash (LCFA) and ground granulated blast furnace slag (GGBFS) were used in geo-polymer concrete. However, Geo-polymer cement is a new kind of cement which uses a different chemistry to that found in traditional OPC. A geo-polymer is made by activating amorphous alumino-silicate materials, such as fly ash and slag, with alkali-based chemicals such as sodium hydroxide and sodium silicate. Geo-polymer cement does not need to contain OPC to work. Geo-polymers have been known to be useful binders in concrete for over 60 years. Moreover, CO2 footprint is approximately 80%
lower than OPC cement (Abdel-Gawwad& Abo-El-Enein, 2016). The main advantage use of waste foundry sand and GPC is the reduction in environmental impact to move towards sustainable development which is defined as the optimum usage with the correct and efficient operation of basic and natural resource for providing the requirement of the future generation. Carbon dioxide (CO2) emission of geo-polymer concrete is 9% less than OPC
12
1.2 Objective and scope
The objective of this study includes:
1. To study the performance of partial fine aggregate replacement of waste foundry sand in low calcium fly ash (LCFA) based GPC.
2. To utilize the D-optimal mixing design; different combinations of the mixture i.e. fine aggregate, waste foundry sand and fly ash are generated.
3. The compressive strength of the proposed GPC specimen is measured and compared to the ordinary concrete.
4. Field emission-scanning electron microscopy and X-ray diffraction (XRD) are then carried out to find the heavy metal constituency with the use of fly ash, GGBFS, and foundry sand. Heavy metal leaching analysis is done on this mix to test the immobilization.
1.3 Thesis structure
In Chapter 1, a brief introduction and Chapter 2, the literature review of the GPC has been given and the motivation of the study is discussed. In Chapter 3, material and method has been explained. In Chapter 4, results obtained are explained. In Chapter 5, a conclusion has been made on basis of the experimental result and discussions are given.
13
2. LITERATURE REVIEW 2.1 Ordinary Portland cement (OPC)
The generally concrete is the mixed combination of Portland cement, fine aggregate, coarse aggregate, water and mixed together. Portland cement generally referred to as OPC. Worldwide construction and infrastructure area most commonly use OPC cement. OPC is made from grinding to a limestone powder (60-65%) and secondary materials such as sandstone, marl, shale, iron, clay, and fly ash. OPC is made up of four main compounds: tricalcium aluminate (3CaO · Al2O3), and a tetra-calcium alumino- ferrite (4CaO · Al2O3Fe2O3), tricalcium silicate (3CaO · SiO2), dicalcium silicate (2CaO · SiO2).The chemical composition of OPC is lime (CaO) 60-65% and the effect of lime is control strength and soundness, silica (SiO2) present in 20-25% and use of silica content is increasing the strength, alumina (Al2O3) present in 4-8% make to quick settling an excess amount ofAl2O3 cause lower strength, iron oxide (Fe2O3) 2-4% and its gives colors and helps to blend of compounds, magnesium oxide (MgO) 1-2% and this also gives color and hardness and excess amount of MgO make cracks, sodium oxide (Na2O) 0.1-0.5% its controls the residues and sulphur trioxide (SO3) 1-2% makes cement sounds. This emits highCO2 concentration which ranges from 0.66 to 0.82kg of CO2 emitted for every kilogram of OPC manufactured.CO2 potentially adds the threat towards global warming due to being one of the greenhouse gases. Moreover, the contribution of the production of OPC in general is approximately 5–7% of global anthropogenic CO2 emissions
14
(Mangialardi, Paolini, Polettini, & Sirini, 1999). But in recent years, the theory of concrete is not extended for the development of geo-polymer materials (Davidovits, 1994) has led researchers to ignore green (eco-friendly) concrete, commonly named GPC. GPC generally sources material of fly ash, rice husk, and alkali liquids (used for binders), water, coarse and fine aggregate which are then mixed together.
2.2 Geo-polymer concrete (GPC)
Geo-polymer concrete is a part of a group of concrete and that have been developed since early 1960.Geo-polymer binders may be made from a variety of alumino- silicate sources. The engineering aspects of geo-polymer concrete as described in this document relate to geo- polymeric materials based primarily on low calcium (or Class F) fly ashes, waste foundry sand and GGBFS. While the commercial availability of geo- polymer concrete is a new phenomenon globally, geo-polymer technology and its application in real projects are not new.
The geo-polymer binder is usually formed by the interaction of an alkaline solution i.e. activating solution (or activator) with a reactive alumino-silicate powder. In commercial geo-polymer production, this is usually a mixture of fly ash (waste from coal combustion) and blast furnace slag i.e. wastes from iron-making. The solid powder (binder) partially dissolves into water. The dissolved components rearrange into an alumino-silicate gel which then cross-links and hardens to form the geo-polymer cement. This cement can replace hydrated Portland cement in concrete production. When mixed with coarse and
15
fine aggregates, a high-performance and lowCO2 concrete can be produced. This research is carried out to produce a low-cost and eco-friendly GPC.
2.2.1 Geo-polymerization process
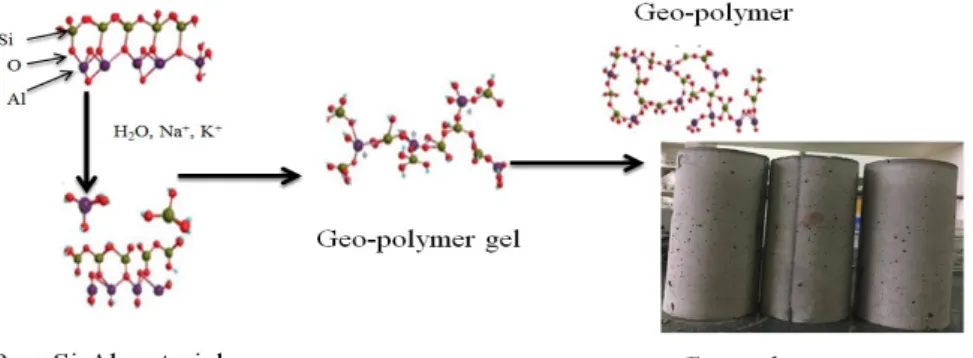
In the first step of geo-polymerization, aluminate and silicate tetrahedral monomers are generated by alkali dissolution of solid alumino silicate precursors. While in the next stage, the monomers form oligomers which lead to the dissolution of more precursor materials so that the solution is saturated with a complex mixture of silicate, aluminate and alumino-silicate species, which polymerize into an amorphous gel. As shown in Fig 2-1, this gel is then consolidated and hardened into geo-polymers (Rao & Liu, 2015)
Figure 2-1 Geo-polymerization process(adapted: Rao & Liu, 2015)
Geo-polymers are new materials for fire- and heat-resistant coatings and adhesives, mechanical applications, high-temperature ceramics, new binders for fire-resistant fiber composites, toxic and radioactive waste encapsulation and new cements for concrete. Geo- polymers are a class of synthetic inorganic alumino silicate materials generally formed by the reaction of an alumino silicate with a silicate solution under strongly alkaline conditions. In these conditions, free SiO4 and AlO4 tetrahedral units are generated and
16
linked to yield polymeric precursors (–SiO4–AlO4–, or –SiO4–AlO4–SiO4–, or –SiO4– AlO4–SiO4–SiO4–) by sharing all oxygen atoms between two tetrahedral units, while water molecules are released (Roviello et al., 2013). The alkaline solution of sodium hydroxide and sodium silicate act as the geo-polymer gel. This gel increases the capacity of the GPC strength.
2.2.1 Mechanism of heavy metal immobilization
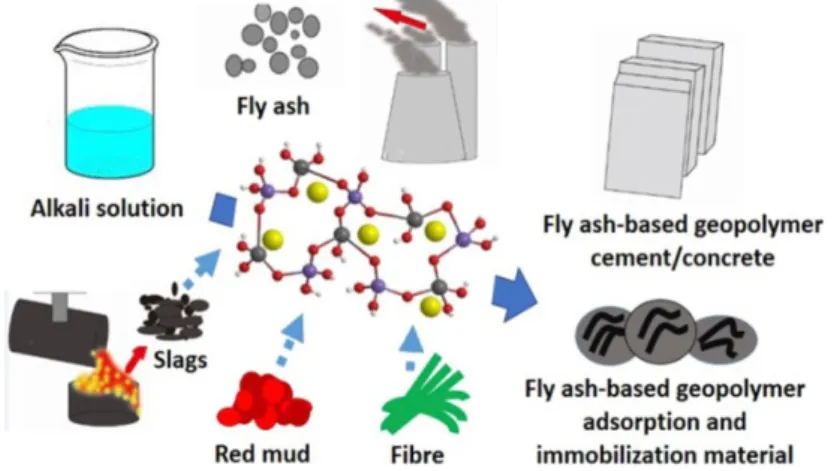
Geo-polymerization is the alternative method to immobilize soluble heavy metals from slag, fly ash, or any other industrial waste. The fly ash GPC hazardous materials (Pb, Cr, Fe, Cu, Zn and etc.,) are tightly attached to the three dimensions structure. The main mechanisms of metal immobilization in fly ash-based geo-polymer are physical encapsulation and chemical stabilization. The physical encapsulation occurs after the heavy metals immobilization treatments, the waste forms resulted towards a low permeable barrier in the contaminations. This then decreases the exposed surface of wastes.
The chemical stabilization then happened in the heavy metals which are converted into more stable and less soluble in the metal-bearing phase (Guo, Liu, Yang, & Zhang, 2017).
The GPC alkaline solution acted as a geo-polymer gel that immobilizes the heavy metals.
The heavy metals were interlocked in alkaline solution so the leaching of metal concentration is reduced in GPC.
Concerned with the environmental issues, the concrete mixture should be checked whether the heavy metals present in fly ash are immobilized through geo-polymerization.
Guo et al. (2017) investigated the 3Pb component behaviors alone when dissolved in
17
sodium hydroxide solution to establish a geo-polymer interface, and confirmed its immobilization. Zhuang et al. (2016) discussed how the mechanism of geo-polymerization (see Fig.2-2) can be improved by fine tuning Si/AI ratios along with alkali solutions, curing conditions and adding slag, fiber, rice hush-bark, ash and red mud.
Figure 2-2 Heavy metal immobilization mechanism (adapted: Zhuang et al., 2016)
2.3 Foundry sand replacement in concrete review
In United States alone, nearly 3000 foundries utilize 100 million tons of sand in its production leaving waste foundry sand as residue (Siddique, Schutter, & Noumowe, 2009;
Torres-Carrasco & Puertas, 2015;Bhardwaj & Kumar, 2017). Such over exploitation has risen to alarming levels especially at vulnerable locations. Due to which several governments have imposed a restriction on sand mining and have raised its price. These limitations directly impact the construction industries with increased production costs.
Therefore, potential replacements are being investigated with partial or complete replacement of concrete material fine aggregate (Dolage, et.at., 2013). As such, ten selected literatures are reviewed as follows:
18
1) Gurumoorthy & Arunachalam (2016) investigated the mechanical and micro structural properties of waste foundry sand as a replacement of fine aggregate to improve the strength of ordinary concrete.
2) Siddique & Noumowe (2008) and Siddique & Singh (2011) utilized this industrial by product waste as controlled low-strength materials for managing the scarcity of land-filling. By conducting durability tests they found waste foundry sand and fine aggregate to have similarity in strength and conducted it as an effective replacement.
Concrete is widely used in built environment. Efforts are made to preserve the performance of the embodied energy of concrete with the consideration of environmental and cost aspects (Calle, Alho, & Benito, 2017).
3) Mangialardi, & Sirini, (1999)utilized waste foundry sand as a partial replacement of fine aggregate in geo-polymer concrete. The percentage of replacement are 0%, 5%, 10%, 15%, 20% and 25% by weight of fine aggregate by waste foundry sand. In this study, 7 day and 28 day compressive strength, split tensile strength and flexural tensile strength of samples was found out.
4) Moonet al. (2005) investigated two types of waste foundry sands like clay-bonded sand (CLW) and silicate bonded sand (COW) as a fine aggregate for concrete basic properties such as air contents, setting time, bleeding, workability and slump loss of the fresh concrete, waste foundry sand were tested and compared with those of the concrete mixed without waste foundry sand. Also, compressive strength and tensile strength of hardened concrete was measured. The compressive strength decreased with increasing the replacement of silicate bonded sand and clay-bonded sand. They
19
further demonstrate the use of waste foundry sand as a partial replacement by fine aggregate in concrete. An experimental investigation was carried out on a concrete containing waste foundry sand in the range of 0%, 20%, 40%, and 60% by weight for M-25 grade concrete. The material was produced, tested and compared with conventional concrete in terms of workability and strength. These tests were carried out on standard cube of 150x150x150mm for 7, 14 and 28 days to determine the mechanical properties of concrete. Through experimental result, they conclude that the compressive strength increases with increase in partial replacement of waste foundry sand and split tensile strength decreases with increases in the percentage of waste foundry sand. Studies showed positive impact of mixing concrete with waste foundry sand, GPC.
5) Bakharev, (2006)the following are some of the basic properties of fly ash based GPC. A compression value of GPC depends upon time and type of curing i.e. the age of curing and temperature to which moulds are subjected. There is an increment in compressive strength with increment in a time of curing and temperature. Geo- polymer moulds have better greater durability and thermal strength characteristics.
6) Siddique et al.(2009) utilized waste foundry sand as partial replacement in ratios of 10%, 20 % and 30% in self-compacting concrete, where the final concrete specimen is subjected to compressive strength, splitting-tensile strength, flexural strength, and modulus of elasticity were determined at 28, 56, 91, and 365 days. Test results indicated a marginal increase in the strength properties of plain concrete by the inclusion of waste foundry sand as partial replacement of fine aggregate.
20
7) Aggarwal & Siddique (2014) waste foundry sand with fine aggregate and bottom ash partially with cement in conventional concrete. The replacement ratios for waste foundry sand were 10 to 50%, and bottom ash was 5 to 30 %. Moreover, the concrete strength was observed that the greatest increase in compressive, splitting tensile strength, and flexural strength compared to that of the conventional concrete was achieved by substituting 30% of the natural fine aggregates with waste foundry sand.
8) Madhavan & Vijayprakash (2016) OPC is replaced by 20, 40 & 60% replacement of Fly ash and 30% of fine aggregate is replaced by the waste foundry sand in M25grade concrete with Conplast 430 admixture. During Phase-I, the compressive strength and split tensile strength of concrete mix at 7th, 14th and 28th day of curing period is determined along with the workability property of fresh concrete and results are analyzed and compared with the conventional concrete and the result was 30% waste foundry sand and 40% fly ash is found to be the optimum percentage at which the cement and fine aggregate can be replaced.
9) Associate & Budhgaon (2017) replaced waste foundry sand by varying it from 0-50%
in steps of 5% by fine aggregate in ordinary concrete. The compressive strength test was carried on 7th and 28th day and the compressive strength was increased after replacing the fine aggregates with the certain percentage of foundry sand.
10) Torreset al. (2017) utilized waste foundry sand ratios of 10%, 20% and 30% partial replacement of fine aggregate in plain cement concrete. Similarly, splitting tensile strength, flexural strength, compressive strength, and modulus of elasticity tests
21
were executed on 7th, 14th and 28th day to ensure the specimens strength. The result has shown the no impact on the mechanical performance of plain cement concrete up to 30% for individual replacement or 20% combined.
2.4 Key components of GPC
2.4.1 Fly ash
Fly ash (FA) is a by-product from thermal power generation plants. These plants use different type of coal such as lignite, sub-bituminous, bituminous, and anthracite. Coal used in these power plants is mainly comprised of carbon, oxygen and hydrogen, nitrogen and sulfur (small components) and 10~40% of non-combustible impurities that are present such as clay, quartz, feldspar, shale, and lime. The combustible element of the coal is burnt off by coal as it passes through the high-temperature zone of coal hotspots, while mineral impurities of coal molecules produce various crystalline phases of melted ash. The molten ash cools rapidly when the molten ash is entrained into flue gases leaving the combustion zone from 1500°C~2000°C and in several seconds it is rounded to glassy particles. Utmost of certain particles fly away among the flue gas stream and are therefore called fly ash (Madhavan & Vijayprakash, 2016; Calle et al., 2017).
According to the coal type used, two types of the fly ash are produced. Residue from Anthracite and bituminous coal are classified as class F. Bituminous coal is a thick sedimentary rock, normally looks black, but sometimes its looks dark brown, frequently
22
with great-defined bands of bright and dull material. Its density is medium hard, moisture content is less and carbon content within 34 ~ 86%.
Less than 6% of the content of calcium oxide (Cao) class F fly ash is referred to as low calcium ash and does not have self-hardening capability and generally reveals pozzolanic properties. It is used to produce air entrained concrete to improve freezing- thawing durability. It usually requires water and reduced hydration heat. Class F fly ash concrete also reveals resistance to Sulfate attack(Khan, et al., 2016). Burning of lignite or bituminous coal generates class C fly ash. Class C fly ash, usually containing 15% Cao, also is called high calcium ash. Class C Fly ash is not just pozzolanic in nature, but self- cementitious (Jiang & Malhotra, 2000; Bakharev, 2006).
2.4.2 Ground granulated blast furnace slag (GGBFS)
Ground granulated blast furnace slag is sometimes referred to as (GGBFS). The GGBFS is byproduct from steel casting industry. It is obtained by quenching molten iron slag from a blast furnace in water or steam, dried and ground into a fine powder. Blast furnace slag is composed of silicates and alumino silicates of lime (Pavani, et al., 2016). It is a latent hydraulic product which can be activated with lime or Portland cement. GGBFS can increase the abilities to prevent water penetration and chloride penetration, and it can improve the durability of concrete structures. It is an excellent binder to produce high performance cement and concrete.
23 2.4.3 Waste foundry sand
Waste foundry sand is a major by-product of the metal casting industry and has been successfully utilized as a land filling material for many years. But the use of waste foundry sand for land filling is becoming a problem due to the rapid increase in its disposal cost. Waste foundry sand primarily consists of high-quality uniformly sized silicon sand, which is bonded to the molds for ferrous (steel and iron) and non-ferrous (brass, aluminum, copper) metal casting. Molding and casting operations utilize high- quality silica foundry sand. The molding sands are reused and recycled many times during the casting method. However, the recycled sand deteriorates to the limit that it can no longer be reused in the casting method and it is removed from the foundry and called as waste foundry sand. The automotive manufacturing and its component suppliers are the main generators of foundry sand (Siddique et al., 2009;Associate & Budhgaon, 2017;
Bhardwaj & Kumar, 2017).
2.5 Heavy metals in geo-polymer concrete
The rapid increase in toxic heavy metal ions such chromium (Cr), iron (Fe), copper (Cu), lead (Pb), nickel (Ni), and zinc (Zn) their release into the environment and impact on human health is well known. Therefore, these are considered major environmental problems throughout the world as exposure to high levels of toxic heavy metal ions can cause schizophrenia, neurological disorders, cancer, kidney failure, skin disorders, and lung disease, while damaging the function of arteries, DNA, and liver. Considering this danger, many strategies have been established to control levels of toxic heavy metal ions
24
in various systems via establishing scientific toxicity standards and exposure guidelines such as those from the World Health Organization (WHO) and Environmental Protection Agency (EPA) of United States. In this study the fly ash used contains large amounts of heavy metals such as Pb, Cr, Cu, Fe, Ni, and Zn. The characteristics of each heavy metal are as follows.
2.5.1 Lead (Pb)
Lead is a bluish-white bright metal. It is soft, very thin, flexible, and a comparatively poor conductor of electricity. It is highly resistant to corrosion but tarnishes on-air exposure. The final isotopes are the final products of each of the three sequence of naturally occurring radioactive organs.
Lead is the leading component of lead-acid batteries used in car batteries. It is the traditional base metal for element process pipes, and it is used in electrolysis operation.
The computer and television screens have its mainstream application. Other uses are in cables, patches, and lead crystal glassware, ammunition, bearings and sports equipment.
2.5.2 Chromium (Cr)
Chromium is an annoying, fragile and dense metal. Its colour is silver grey and very shiny. When it is heated it pollutes the air which creates green chromium oxides.
Chromium is weak in oxygen, which quickly generates a permeable oxide layer. Many environmental and health problems have been associated with Cr in the past as well.
25 2.5.3 Copper (Cu)
Copper is a red metal with a cubic crystal structure in the face. It was found in periodic table I B group, and silver and gold are accompanied. Copper has low chemical efficiency. In the wet air, a green cover film is formed. This cover shields the metal from additional attack. Most copper compounds will settle and be bound to either water sediment or soil particles. Soluble copper compounds form the largest threat to human health. Usually water-soluble copper compounds occur in the environment after release through application in agriculture.
2.5.4 Zinc (Zn)
Zinc is a glossy blue-white metal. It is found in the periodic table in II B group. It is fragile and crystalline at normal temperatures, but when it is hot between 110°C and 150°C it is perforated and thin. It is a highly reactive metal that acts with dilute acids to produce the hydrogen that connects with oxygen and other non-metals.
It is mainly used for iron storage, 50% of metal zinc goes into steel galvanic, but it is important in producing some alloys. It is used for the negative plates in any electric batteries and to roofing and gutters in building construction. Zinc is a trace element that is essential for human health. When people absorb too little zinc they can experience a loss of appetite, decreased sense of taste and smell, slow wound healing and skin sores. Zinc- shortages can even cause birth defects.
26 2.5.5 Nickel (Ni)
Nickel is a silver-white, hard, thin and flexible metal. It is one among the iron group and it gets tremendous shine. With heat and electricity it is a very good conductor.
Nickel's main application is in the production of alloys. Nickel alloys are classified by toughness, flexibility, and resistance to heat and corrosion. Approximately 65% of the western world is used nickel to produce the alloy and its mixture may vary but 12% of nickel goes to super alloys. The remaining 23% consumption includes alloy steels, rechargeable batteries, catalysts and other chemicals, coin, foundry products and plating.
2.5.6 Iron (Fe)
Iron is a lustrous, ductile, malleable, silver-gray metal (group VIII of the periodic table). Pure iron is a silver-white, textured and malleable metal, which can be made of thinner tubes than cigarette paper. Iron is divided into pure iron, steel and cast iron. Iron is very rare in the natural world and it is difficult to make it by smelting. Iron has been reported to be involved in the inhabitation of fatigue and infection as well as in the development of growth and cognitive ability by being required for the various physiological regulation ability of the human body. Iron can be found in meat, whole meal products, potatoes and vegetables. The human body absorbs iron in animal products faster than iron in plant products. Iron is an essential part of hemoglobin; the red coloring agent of the blood that transports oxygen through our bodies.
27
2.6 D-Optimization
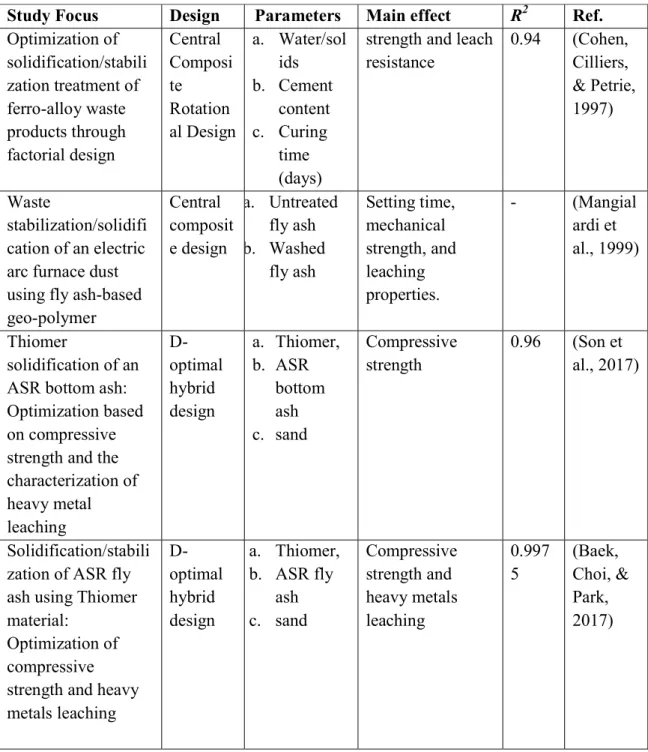
D-optimal mixture design utilize the response surface methodology (RSM) and can provide multivariate mixture design of construction materials for statistical analysis of concrete mixture optimization (Eriksson, Johansson, & Wikström, 1998; Muteki, MacGregor, & Ueda, 2007). The statistical program of Design-Expert with version 6.0.8 is utilized to derive optimized conditions according to the blending design cost. 14 design blend ratios were designed. Among the 14 compounding ratios set out, 10 items were analyzed according to the above mentioned compressive strength test method, except for overlapping items, and the optimum compounding ratio and predicted compressive strength were investigated. Optimization of the blending ratio was achieved by selecting the mixing ratio of each material through the Cubic model (Choi et al., 2014; Son, Baek, Choi, & Park, 2017; Subramonia Pillai, Kannan, Vettivel, & Suresh, 2016)
28
Table 2-1 Selected literatures for the application of Response Surface Methodology (RSM) Study Focus Design Parameters Main effect R2 Ref.
Optimization of solidification/stabili zation treatment of ferro-alloy waste products through factorial design
Central Composi te Rotation al Design
a. Water/sol ids b. Cement
content c. Curing
time (days)
strength and leach resistance
0.94 (Cohen, Cilliers,
& Petrie, 1997)
Waste
stabilization/solidifi cation of an electric arc furnace dust using fly ash-based geo-polymer
Central composit e design
a. Untreated fly ash b. Washed
fly ash
Setting time, mechanical strength, and leaching properties.
- (Mangial
ardi et al., 1999)
Thiomer
solidification of an ASR bottom ash:
Optimization based on compressive strength and the characterization of heavy metal leaching
D- optimal hybrid design
a. Thiomer, b. ASR
bottom ash c. sand
Compressive strength
0.96 (Son et al., 2017)
Solidification/stabili zation of ASR fly ash using Thiomer material:
Optimization of compressive strength and heavy metals leaching
D- optimal hybrid design
a. Thiomer, b. ASR fly
ash c. sand
Compressive strength and heavy metals leaching
0.997 5
(Baek, Choi, &
Park, 2017)
29
3. MATERIALS AND METHODS
This chapter describes the materials used in concrete, statistical experimental mixture design, OPC and GPC specimen, and physico-chemical analyses.
3.1 Materials
The following materials are used in OPC and GPC specimen.
3.1.1 Cement
There are different standards of Portland cement available for various purposes.
There are also different classes of cement being in OPC. OPC can be categorized such as 33grade, 43 grades, or 53 grades. 53 grades OPC can be collected from any construction material shop which is used for the experimentation. The specific gravity of cement is 3.08.
3.1.2 Fly ash
Fly ash is a by-product from thermal power plants. Based on the composition of coal, two types of fly ash are produced i.e. class C and class F. Low calcium fly ash is collected from incineration plant at Ulsan, Korea. Fly ash which used to replace cement and the following tests were carried out on fly ash. The specific gravity of fly ash is 2.23.
30 3.1.3 GGBFS
The blast furnace slag which is a by-product of the iron manufacturing (i.e., GGBFS) is collected from Ulsan Steel Mill Company, Ulsan, South Korea. GGBFS which is also used to replace the cement and the specific gravity of GGBFS is 2.97.
3.1.4 Foundry sand
Waste foundry sand is a high-quality Silica sand of uniform size having bonds of ferrous and non-ferrous metal castings. Foundry was collected from Busan Susek Company, Ulsan, South Korea respectively. Waste foundry sand was used to replace as fine aggregate and the specific gravity of foundry sand is 2.71.
3.1.5 Fine aggregate
In the present investigation, the river sand available near Ulsan was used as fine aggregate. And the sample two tests were carried out sieve analysis and specific gravity test. The fineness modulus and specific gravity of fine aggregate is 2.71.
3.1.6 Coarse aggregate
In the present investigation, locally available crushed blue granite stone aggregate of size 12.5mm was used and the sample two tests were carried out sieve analysis and specific gravity test. The fineness modulus of course aggregate is 6.56 and specific gravity of coarse aggregate is 2.75.
31 3.1.7 Alkaline solution
In the present study we have used a combination of sodium hydroxide (NaOH) and sodium silicate (Na2SiO3) solutions. The sodium hydroxide solids were technical grade in flakes form (3 mm) with 98% purity was collected from OCL Company Ltd., (Korea). The sodium hydroxide solution was prepared by dissolving either the flakes or the pellets in the portable water. The sodium hydroxide solution was dissolved into portable water. The mass of sodium hydroxide solution is modified depending on the concentration of the solution conveyed in terms of molarity (M). Molar concentrations or molarities are commonly defined as solute in per liter of solution. To use in wide applications, it is defined by an amount of solute per unit volume of solution (Madhavan, 2016; Pavani et al., 2016).
3.2 Statistical experimental mixture design
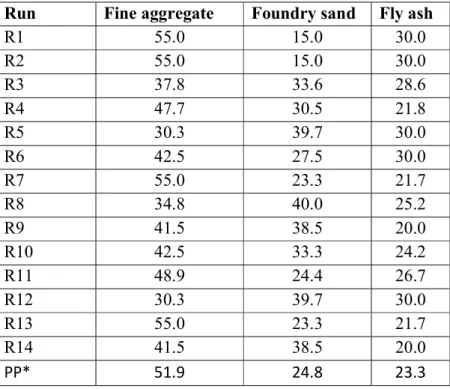
The D-optimal design process for mixture designs works exactly the same way as that described for RSM design. The design points are selected to minimize the variance associated with the estimates of the coefficient in the specified model. The design space is defined by the low and high-level constraints on each factor and any multifactor constraints. The design of GPC mix is tabulated in Table 3.1. In order to reduce the usage of the fine aggregate, the proposed method included the usage of them as a partial replacement. To maintain the compressive strength of the final concrete mix, the
32
percentage of fly ash, fine aggregate, for the 830.4 kg/m3 to be used is tested at different mixture combinations (Bakharev, 2006).
Table 3-1 Optimization mixture design (wt%)
Run Fine aggregate Foundry sand Fly ash
R1 55.0 15.0 30.0
R2 55.0 15.0 30.0
R3 37.8 33.6 28.6
R4 47.7 30.5 21.8
R5 30.3 39.7 30.0
R6 42.5 27.5 30.0
R7 55.0 23.3 21.7
R8 34.8 40.0 25.2
R9 41.5 38.5 20.0
R10 42.5 33.3 24.2
R11 48.9 24.4 26.7
R12 30.3 39.7 30.0
R13 55.0 23.3 21.7
R14 41.5 38.5 20.0
PP* 51.9 24.8 23.3
*PP – Point Prediction
The design expert 7.0.0 used to optimize the design mixtures compound, fine aggregate (A: 30-55 wt%), WFS (B: 15-40 wt%) and fly ash (C: 20-30% wt%) over the compression strength (Y: KN) in GPC casting. The design mixture has an entirety of 14 test runs which comprise ‘lack of fit estimation’ (4 runs), ‘replicates’ (4 runs), and
‘minimum model points’ (6 runs). The quadratic model obtained from the regression analysis shown in equation 1, defines the relationship between the minor and major variables.
33
iXi ijXiXij
Y ………....Eq (1)
Where, βi and βij are the interacting factors and the coefficient extended. The statistical result is investigated using the analysis variance (ANOVA). Using the D- optimal design software, this can determine the optimal combination of the three materials in the mixture. This is tabulated in Table 3-1. The standard procedure for solidification can be referred to past literature (Bakharev, 2006; Torres-Carrasco & Puertas, 2015; Vijai et al., 2010).
3.3 Mixture design calculation of GPC
In this design, GPC comprises of 75 to 77% of the combined aggregate. The combined aggregate is a combination of foundry sand, fine aggregate and coarse aggregate.
The OPC concrete also have the combined aggregate with similar percentage. Normally OPC and GPC have 30% fine aggregate and 45% coarse aggregate, but for this research study foundry sand is being replaced partially with 15 -40 % of the total weight of fine aggregate. The OPC and GPC unit weight of concrete density was found to be 2400kg/m3. The ratio of alkaline liquid to fly ash was found to 0.4. The ratio of sodium silicate solution to sodium hydroxide solution was fixed as 2.5 to obtain the mass of sodium hydroxide and sodium silicate solution (Jiang & Malhotra, 2000). An alkaline solution is prepared by sodium hydroxide solution of 8 molarity (8M) with weight of 320 gram (8×40 i.e. molarity × molecular weight) of sodium hydroxide was dissolved into one liter of water. For GPC casting, one day prior preparation of sodium hydroxide solution is
34
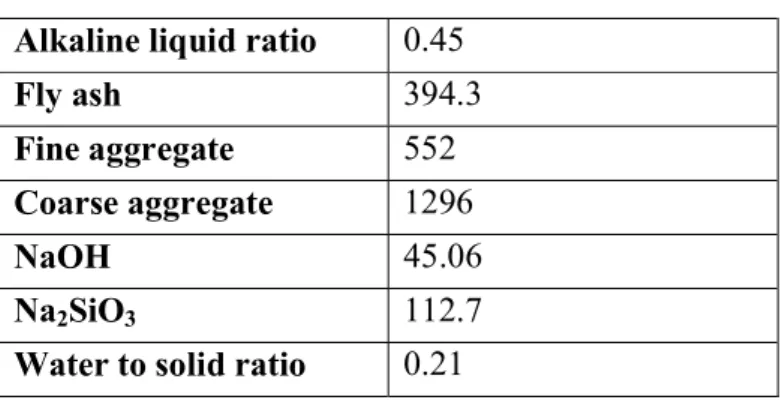
required. Later, the prepared sodium hydroxide solution was mixed with sodium silicate solution. The trial mixture (fly ash 16.4%, fine aggregate 23.0%, coarse aggregate 54.0%, NaOH 1.9%, and Na2SiO3 4.7% is designed as below and overall values are tabulated in Table 3-2.
Table 3-2 Mix design of GPC (Unit, Kg in 1m3) Alkaline liquid ratio 0.45
Fly ash 394.3
Fine aggregate 552 Coarse aggregate 1296
NaOH 45.06
Na2SiO3 112.7
Water to solid ratio 0.21
3.4 OPC and GPC Specimen
3.4.1 Specimen preparation
The GPC solids compounds of fly ash, foundry sand, fine aggregate, GGBFS and coarse aggregate were mixed in a pan mix for 2 to 3 minutes. After dry mix, the alkaline solution is added; water is added continuously until the dry mix changes to wet mix. Such wet mix is blended for around 4 minutes The OPC dry mix has been mixed about 2minutes.
Later water is added and continuously mixed another 5minutes for the dry mix to change to wet mix by following the method employed by past studies The mixture was pour into the cylindrical GPC plastic mould size 100×200mm, and table vibrator also used for
35
settling the concrete via (compaction) (Vijai, Kumutha & Vishnuram, 2010; Madhavan&
Vijayprakash, 2016; Torres et al, 2017; Guo et al., 2017).
3.4.2 Curing
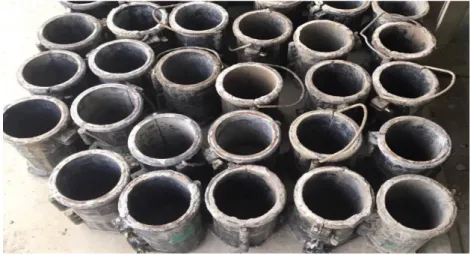
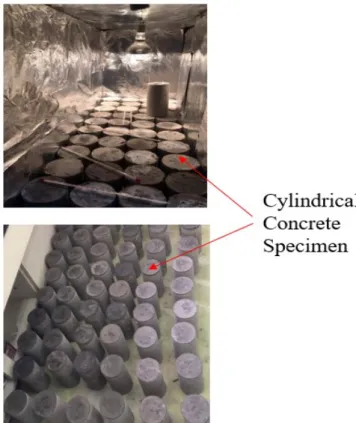
Hot curing and water bath curing were used in the GPC and OPC. After casting GPC specimen were kept in ambient hot temperature room at 24 hours. The ambient room temperature was maintained 60oC to 70oC. After 24hours the GPC specimen was taken from ambient room temperature and the specimen was remolded. Later it is kept at room temperature (23oC to 30oC) until further testing the specimen is done. The specimen was tested on 7th and 28th day. After 24 hours the OPC specimen which is remolded is put into water bath curing until testing the specimen as done previously (Khan et al., 2016). In figure 3-1 the cylindrical moulds used for casting can be seen. Figure 3-2 the procedure used for curing ((a) hot temperature (b) room temperature) is shown.
Figure 3-1 Cylindrical shaped mold for casting
36
Figure 3-2 Curing the specimen
37
3.5 Physico-chemical characterization
3.5.1 Compressive strength
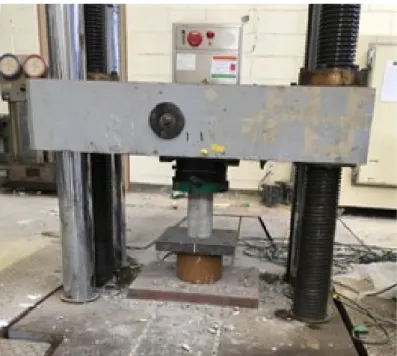
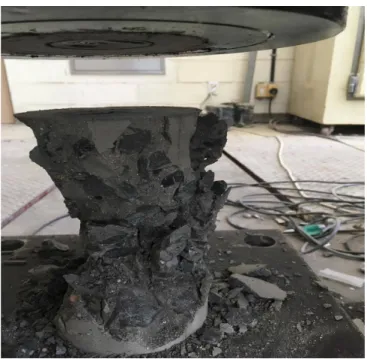
Two types of cylinder specimen are utilized, one is using controlled concrete and the other one is using GPC. The cylinder specimens of size 100mmx200mm are tested by compression testing machine after 7 and 28 days of curing. Samples were weighed before being put in the compression testing machine. The Load was then applied until failure and the crushing load (KN) was noted. The compressive test machine is shown in figure 3-3.
The specimen after the compressive strength test is shown in figure 3-4.
Figure 3-3 Compressive test machine
38
Figure 3-4 Specimen after the compression 3.5.2 Crystal structure and chemical characterization
In this study, crystal structure and chemical properties of each sample were analyzed according to mixing design ratio. The crystal structures were compared and analyzed by FE-SEM / EDS in order to understand the binding state, elemental analysis and distribution of each sample by GGBFS concrete. The magnifications of SEM and EDS were set to 100 times and 500 times, respectively. After solidification, samples were placed in a mortar and thoroughly pulverized, and then the particles of the powder were analyzed using an X-ray diffractometer. Table 3-3 shows chemical compositions of various materials in fly ash, foundry sand and GGBFS.
39
Table 3-3 Chemical compositions of materials
Chemical composition
Fly ash (wt. %) (Khan et al., 2016)
Foundry Sand (wt. %) (Siddique et al., 2009)
GGBFS (wt. %) (Khan et al., 2016)
SiO2 66.56 87.91 31.52
Al2O3 22.47 4.7 12.22
Fe2O3 3.54 0.94 1.14
CaO 1.64 0.14 44.53
MgO 0.65 0.3 4.62
Na2O 0.58 0.19 0.21
K2O 1.75 0.25 0.33
TiO2 0.88 0.15 1.03
SO3 0.1 0.09 3.24
Loss on ignition (LOI) 1.66 0.02 0.79
3.5.3 Determination of heavy metal content in incineration fly ash
The total heavy metal concentrations in the fly ash are determined by utilizing the method defined by Baker and Amacher (Baker &Amacher, 1982; Hseu et al., 2002; Jin Woong Baek, et al., 2016). The method consists of digestion of fly ash samples in a mixture of HF–HNO3–HClO4–H2SO4. Around 1 gram of fly ash was put in a 250mL beaker and mixed continuously by adding 4mL of hydrofluoric acid, 5mL of hydrochloric acid, 5mL of nitric acid and 2mL of perchloric acid. Then the mixture was mixed and heated to 220 °C. The sample was then allowed to be evaporated. Thereafter, the mixture was subjected to filtration using a 1.0μm glass fiber filter paper in a 50mL round flask.
After which the filtration solution was dissolved into 50mL HCl 0.1M to yield a solution to measure the total metal concentrations. An atomic absorption spectroscopy (AAS) was used to measure the entire heavy metal concentration in the acid solutions state. All these trials were conducted in triplicates and, the average value was taken.
40 The heavy metal concentration can be formulated as
Heavy metal concentration (mg/kg) =
W Cb)xVxF -
(Ca …….…….……...Eq (2).
Ca= the mean concentration
Cb= the concentration of metal in original sample (mg/kg) V= the volume of the digested solution made (ml)
W= the dry weight of sample (g)
F= the dilution factor if needed (1= in cause of no further dilution) 3.5.4 Heavy metal leaching evaluation
To understand mobility of the heavy metals from the above solidification, in this study Korean Standard Leaching Procedure (KSLP) method (Osada, Tanigaki, Takahashi,
& Sakai, 2008; Son et al., 2017) were performed and the results were compared. A 30 g of uniformly grounded samples with less than 5mm particle size and a solvent with pH 5.8~6.3 using diluted HCl was separately prepared. The grained sample was mixed together using a solid to liquid ratio of 1:10 to a total volume of 50mL. The mixture was kept in a container for 6 hour at 200 rpm with 4-5 cm shaking widths. The mixture was then to subjected to a centrifuge at 3000 rpm for 20 min and filtered using a 0.45 μm membrane filter. The heavy metals (Cu2+, Zn2+, Pb2+, Cr3+and Cd2+) in the filtrate solution were analysed by atomic absorption spectroscopy (AAS) to evaluate its potential leachability. All experimental runs were done in triplicates and the averaged value was taken for the results represented in this study.
41
4. EXPERIMENTAL RESULTS AND DISCUSSION 4.1 Heavy metal contents and leaching concentrations
The total heavy metal content of fly ash, waste foundry sand, and GGBFS were analyzed. Table 4-1 shows the result of heavy metal contents from MBA and leaching concentration by KSLP method. The heavy metal contents of the fly ash are Zn 11,687.5mg/kg, Fe 14,575mg/kg, Cu 35mg/kg, Ni 220mg/kg and Cr 2412.5mg/kg, and Pb 46mg/kg. The theoretical maximum leaching concentration values are also tabulated.
Theoretically, among the highest leaching metal concentration are Fe (291.5mg/l) and Zn (233.75mg/l) while the lowest leaching metal concentration are Cu (0.7mg/l) and Pb (0.92mg/l). Table 4-1 further shows the leaching concentration of heavy metals in the fly ash, foundry sand and GGBFS. These were measured by the KSLP method. The KSLP method presented an initial concentration of fly ash leaching concentration in the order of Fe (1.55mg/l), Pb (0.21 mg/l), Ni (0.18mg/l), Cu (0.02mg/l), Zn (0.024mg/l) and Cr (0.04mg/l). The initial heavy metal concentrations are differing in the fly ash material for MBA and KSLP due to differing acidic state. The MBA method showed higher heavy metal contents in Fe and Zn but the KSLP method indicated higher leaching metal concentration in Fe and Pb. Therefore, future studies regarding these methods are recommended. For foundry sand, the initial heavy metal concentration was measured through the KSLP method. This showed concentrations of Fe 0.19mg/l, Zn 0.014mg/l, Cu 0.018mg/l, both Cr and Ni 0.02mg/l, and Pb 0.08mg/l. Furthermore, the initial
42
concentration of GGBFS in all its metal concentration is substantially lower except for Fe in comparison with the other materials. In the aspect of the Korean regulatory limit, the materials after the leaching test were all below the set limitation which proves to show that this solidification method is safe for the environment. Based on the total heavy metal content of fly ash, 77-100% heavy metal concentration were immobilized. Specifically, the heavy metal immobilized efficiency is as follows: Pb 77%, Cr 99.9%, Cu 97%, Fe 99.4%, Ni 96%, and Zn 99.9%.
Table 4-1 Heavy metals content and leaching concentration of fly ash, foundry sand, and GGBFS
Materials Pb Cr Cu Fe Ni Zn
Fly ash (MBA) (mg/kg)
Range (45- 47.5)
(2410- 2415)
(30-40) (14500- 14650)
(210- 230)
(11525- 11850) Average 46 2412.5 35 14575 220 11687.5 Theoretical
Maximum Leaching (mg/l)
Range (0.90- 0.95)
(48.2- 48.3)
(0.6-0.8) ((290- 293)
(4.2-4.6) (230.5- 237) Average 0.92 48.25 0.7 291.5 4.4 233.75 Fly ash
(KSLP) (mg/l)
Range (0.18- 0.24)
(0.02- 0.04)
(0.021- 0.03)
(1.4 -17)
(0.18- 0.20)
(0.03- 0.045) Average 0.21 0.04 0.02 1.55 0.18 0.024 Foundry
sand (KSLP) (mg/l)
Range (0.07- 0.1)
(0.01- 0.02)
(0.015- 0.022)
(0.18- 0.20)
(0.02- 0.02)
(0.013- 0.015) Average 0.08 0.02 0.018 0.19 0.02 0.014 GGBFS
(KSLP) (mg/l)
Range (0.01- 0.05)
(0.006- 0.007)
(0.003- 0.006)
(0.12- 0.15)
(0.025- 0.03)
(0.014- 0.018) Average 0.03 0.007 0.004 0.135 0.031 0.016 Korean regulatory
limit:
3.0 1.5 1.0 - - 3.0
43
Table 4-2 and Fig. 4-1 show the GPC solidification of the 14 runs after heavy metals leaching concentration under the KSLP method in different mixing ratios of foundry sand, fly ash and GGBFS. In GPC, the average heavy metals leaching concentration is Cu 0.014mg/l, Cr 0.013mg/l, Pb 0.019mg/l, Zn 0.02mg/l, Fe 0.06mg/l and Ni 0.067mg/l. These heavy metals leaching result are also well within the Korean regulatory limit. Moreover, the heavy metals concentration in the mixture of fly ash, foundry sand and GGBFS materials has the highest leaching capacity in the order of Cu and Cr > Pb > Zn > Fe > Ni. The highest leaching concentration in Pb is R2 (0.2mg/l), this is attributed to a higher content of foundry sand which leads towards low leaching results in Pb. The lowest leaching concentration in Pb is in R10 (0.17mg/l) this is due to a higher foundry sand mixture ratio. Moreover, Cr has the highest leaching concentration in R1, R2, R5, R6, and R12 of 0.02mg/l and all other runs has a low concentration of 0.01mg/l. A low Cr leaching outcome is observed when the fly ash gets lower and foundry sand gets higher.
The Cu leaching result in R4, R5 and R13 have the highest leaching concentration due to more foundry sand and less fly ash ratios. On the other hand, the fly ash ratio is lower in the leaching of Fe as seen in R4 and R9 (0.5mg/l). Ni has the lowest leaching concentration in R7, R9, and R14. When the fly ash ratio gets lower and foundry sand get higher, the Ni leaching concentration is reduced. Furthermore, when the foundry sand and fly ratio is in the average interval, the Zn leaching concentration get decreased as seen in R7 and R13. Based on the overall results, the increase in foundry sand ratio decreases the heavy metals leaching concentration. This is due to the presence of silica in foundry sand as reported in Siddique & Noumowe (2008). A higher foundry sand ratio gives more silica
44
content that aids heavy metals immobilization (Rao & Liu, 2015). In the GPC specimen, the achieved heavy metals immobilization ranges from 92.1 to 99.98% which is promising for environmental applications based on the total heavy metals content of fly ash.
Specifically, after the GPC solidification, the heavy metals immobilized percentages were Pb 93.3 – 95.9%, Cr 99.8-99.9%, Cu 92.1-96.6%, Fe 99.3-99.5%, Ni 95.7-96.8% and Zn 99.97-99.98%. Based on the overall results of the heavy metals leaching, the addition of GGBFS with foundry sand and fly ash can potentially reduce heavy metals leaching from the concrete in any ratios.
Table 4-2 KSLP Leaching concentration of heavy metal in different mixing ratios Run
FS/FA/GGBFS%
Pb (mg/l)
Cr (mg/l)
Cu (mg/l)
Fe (mg/l)
Ni (mg/l)
Zn (mg/l) Run1
25.3/50.
6/24.0
Range (0.015- 0.023)
(0.016- 0.024)
(0.01- 0.014)
(0.67- 0.73)
(0.07- 0.09)
(0.018- 0.022) Average 0.019 0.02 0.012 0.7 0.08 0.02 Run2
25.3/50.
6/24.0
Range (0.012- 0.028)
(0.017- 0.023)
(0.011- 0.013)
(0.6- 0.8)
(0.072- 0.088)
(0.018- 0.022) Average 0.02 0.02 0.012 0.7 0.08 0.02 Run3
44.0/37.
4/18.6
Range
(0.015- 0.025)
(0.007- 0.013)
(0.011- 0.017)
(0.68- 0.72)
(0.065- 0.075)
(0.017- 0.019) Average 0.02 0.01 0.014 0.7 0.07 0.018 Run4
45.8/32.
8/21.4
Range (0.014- 0.026)
(0.005- 0.015)
(0.014- 0.022)
(0.42- 0.58)
(0.052- 0.068)
(0.017- 0.023) Average 0.02 0.01 0.018 0.5 0.06 0.02 Run5
47.3/35.
7/17.0
Range (0.011- 0.029)
(0.015- 0.025)
(0.012- 0.022)
(0.4-0.7) (0.08- 0.1)
(0.018- 0.022)
45
Average 0.02 0.02 0.017 0.55 0.09 0.02 Run6
38.3/41.
8/19.9
Range (0.016- 0.024)
(0.017- 0.023)
(0.007- 0.017)
(0.47- 0.77)
(0.079- 0.081)
(0.017- 0.023) Average 0.02 0.02 0.012 0.62 0.08 0.02 Run7
39.3/36.
6/24.0
Range (0.012- 0.028)
(0.008- 0.012)
(0.011- 0.017)
(0.43- 0.77)
(0.047- 0.053)
(0.009- 0.011) Average 0.02 0.01 0.014 0.6 0.05 0.01 Run8
50.3/31.
7/17.9
Range
(0.017- 0.021)
(0.007- 0.013)
(0.011- 0.013)
(0.3- 0.78)
(0.052- 0.068)
(0.014- 0.026) Average 0.019 0.01 0.012 0.54 0.06 0.02 Run9
52.9/27.
5/19.6
Range (0.14- 0.02)
(0.009- 0.011)
(0.013- 0.015)
(0.49- 0.51)
(0.043- 0.057)
(0.014- 0.018) Average 0.017 0.01 0.014 0.5 0.05 0.016 Run10
46.4/33.
7/19.9
Range (0.01- 0.024)
(0.006- 0.014)
(0.014- 0.016)
(0.52- 0.68)
(0.05- 0.07)
(0.012- 0.022) Average 0.017 0.01 0.015 0.6 0.06 0.017 Run11
37.3/40.
9/21.8
Range (0.013- 0.021)
(0.008- 0.012)
(0.01- 0.014)
(0.65- 0.75)
(0.068- 0.072)
(0.014- 0.024) Average 0.017 0.01 0.012 0.7 0.07 0.019 Run12
47.3/35.
7/17.0
Range (0.012- 0.022)
(0.018- 0.022)
(0.01- 0.014)
(0.57- 0.63)
(0.089- 0.091)
(0.013- 0.017) Average 0.017 0.02 0.012 0.6 0.09 0.015 Run13
39.3/36.
6/24.0
Range (0.014- 002)
(0.009- 0.011)
(0.014- 0.022)
(0.48- 0.56)
0.042- 0.058)
(0.009- 0.011) Average 0.017 0.01 0.018 0.52 0.05 0.01 Run14
52.9/27.
5/19.6
Range (0.015- 0.019)
(0.008- 0.012)
(0.011- 0.013)
(0.46- 0.6)
(0.035- 0.045)
(0.011- 0.019) Average 0.017 0.01 0.012 0.53 0.04 0.015
46 Run
*PP 39.8/37.
4/22.9
Range
(0.016- 0.02)
(0.008- 0.012)
(0.01- 0.014)
(0.47- 0.53)
(0.066- 0.074)
(0.015- 0.019) Average 0.018 0.01 0.012 0.5 0.07 0.017 Average 0.019 0.013 0.014 0.06 0.067 0.02
*PP – Point Prediction,
*FS- Foundry sand, *FA- Fly Ash
0 0.005 0.01 0.015 0.02 0.025
R1 R2 R3 R4 R5 R6 R7 R8 R9 R10 R11 R12 R13 R14 PP*
Pb concentration (mg/l)
(a)
Runs0 0.005 0.01 0.015 0.02 0.025
R1 R2 R3 R4 R5 R6 R7 R8 R9 R10 R11 R12 R13 R14 PP*
Cr concentration (mg/l)
(b)
Runs47
0 0.002 0.004 0.006 0.008 0.01 0.012 0.014 0.016 0.018 0.02
R1 R2 R3 R4 R5 R6 R7 R8 R9 R10 R11 R12 R13 R14 PP*
Cu concentration mg/l
(c)
Runs0 0.1 0.2 0.3 0.4 0.5 0.6 0.7 0.8
R1 R2 R3 R4 R5 R6 R7 R8 R9 R10 R11 R12 R13 R14 PP*
Fe concentration (mg/l)