The rapid increase in computing power and the development of effective machine learning techniques in recent days allow us to apply machine learning to various fields of research. The prediction of local dynamics based on the local structural information is a long-standing problem in glass physics. Recent studies reveal that the local dynamics are indeed predictable by using the support vector machine (SVM) and the local structural information.
In my thesis, I reproduce the result of previous research using SVM and compare it with the result of a neural network.
Introduction
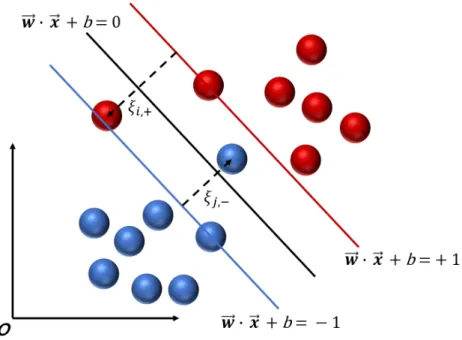
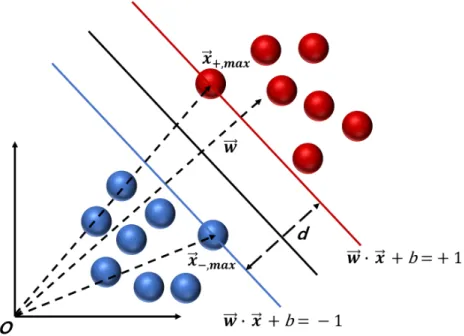
Support Vector Machine
- C-SVM
- Kerenl SVM
In C-SVM, data points may exist on the outside of the correct decision boundary. From the above equations, we can obtain the relationship between the variables of the primary problem and the Largrange multipliers. This means that the data points that have ξi = 0 are located on the decision boundaries of the C-SVM.
It is important to note that we can avoid calculating the mapping function.
Simulation method for glassy liquid system
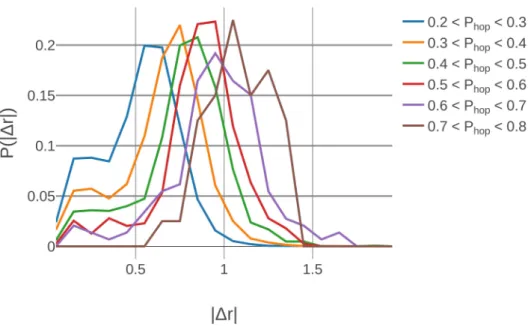
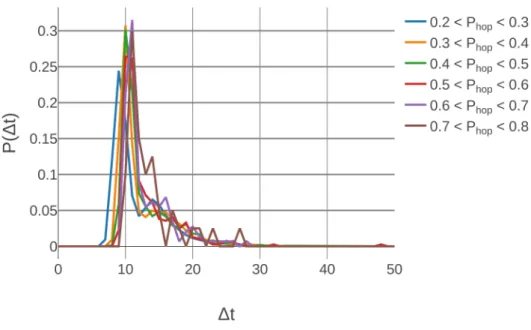
Identifying particle rearrangements through P hop
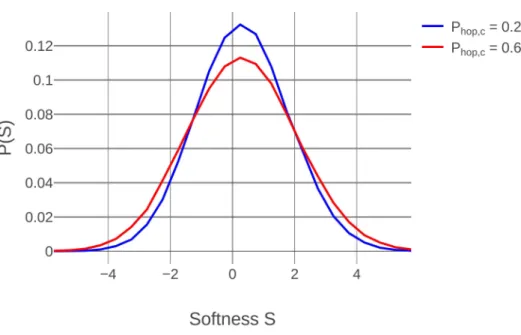
Training method and result of the support vector machine
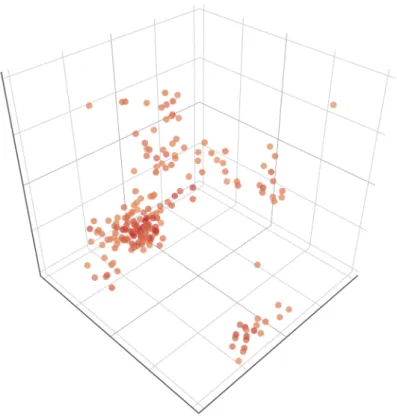
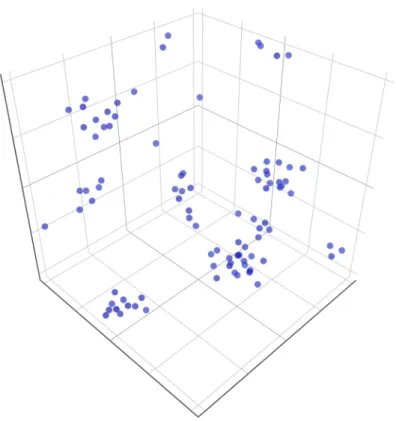
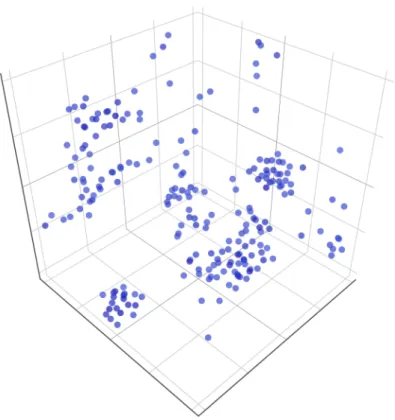
It is clear that increasing the Phopthreshold for the soft label increases the variance of the softness distribution.
Comparing SVM with Neural Network
Conclusion
The dynamics of the transition is generally considered to be the key to a characterization of the nature of the transition [1, 2]. The signature behavior describing this irreversible transition is a slowing of structural relaxation as the temperature decreases. The relaxation time increases exponentially with the relative configurational entropy, which is proportional to the number of CRRs and their sizes, which explains the Vogel-Fulcher-Tammann (VFT) formula [29].
Since the vibrational entropy is more or less the same at low temperature, the configurational entropy is responsible for most of the difference. Computer simulation is usually a good complementary approach to obtain direct ensemble measurements, but the non-equilibrium, non-ergodic nature of glass systems makes this rather difficult due to a lack of statistical rigor. It was later found that soft spots (low-lying modes) essentially consist of correlated motions of particles that have temporarily high mobility.
In fact, these highly mobile particles exhibit cooperative string-like motion, which is claimed to be a more fundamental microscopic mechanism [35,36]. 32] demonstrated that string-like behavior is only a result of highly correlated motions of a small number of particles, which facilitates a local structural rearrangement of their neighbors. According to this finding, the super-Arrhenius relaxation does not come from an increase in the size of the CRR at lower temperature, but from a decrease in the local excitation density.
Despite the success of these works in proving the general features of the glassy behavior, the local facilitation dynamics are still a mystery. The microscopic understanding of the local dynamics will shed light on the fundamental nature of the slow and hierarchical relaxation of glassy fluids.
Results
Origin of the heterogeneity
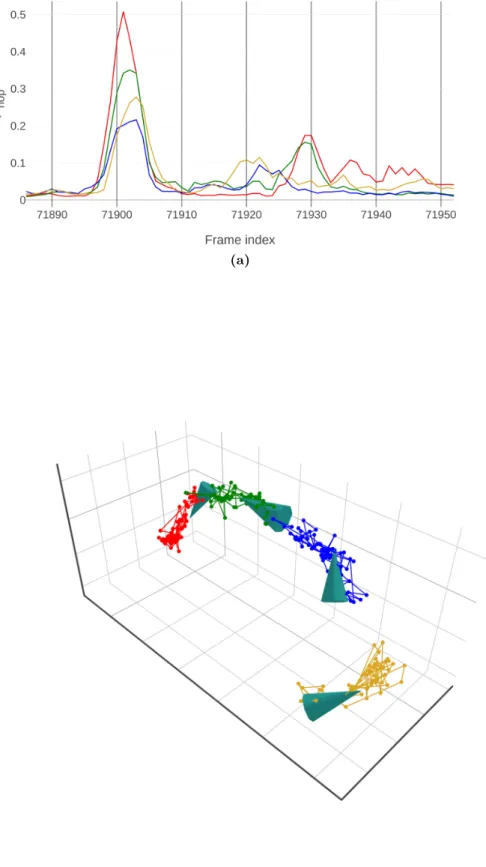
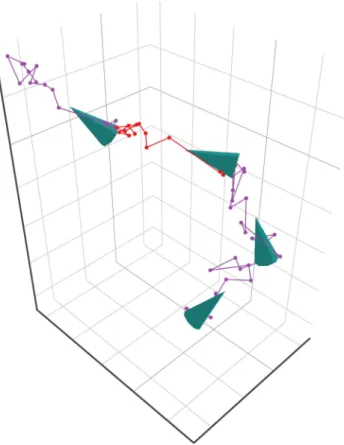
I find that the rearrangement of soft domains is initiated by a small number of "primary particles" that correspond to the softest particles in the machine learning classification. They are separated by only one particle diameter or less, implying that they are directly correlated with each other. These primary particles sometimes exhibit some lower follow-on peaks that are more or less synchronized.
These peaks reflect that the primary particles agitate local domains by jumping between local basins several times during the realignment time. That these primary peaks are due to the collective movements of their neighbors is plausible, but they appear seemingly on random occasions. The time interval of subsequent small follow-up peaks within the soft domain is much shorter than the time interval between primary peaks.
After the peaks of the primary particles, 10 ~ 20 follow-up particles exhibit smaller peaks within small distances from the softest primary particle. The spatial and temporal proximity leads us to postulate that these follow-on mobile particles are induced as responses to the motion of the primary particles. The total consecutive rearrangement lasts several times longer than the lifetime of the local intrinsic structure.
Moreover, the peak heights of the tracer particles decrease very rapidly, and their locations are limited to a few radial distances from the primary particles. In the long run, soft particles can facilitate the local structural rearrangement of their neighbors, but due to the large timescale difference, the locality assumption is still valid for the analysis of the excitation dynamics.
Decomposition of instanton time
Rationalize the local excitations: Change in structure as response to the
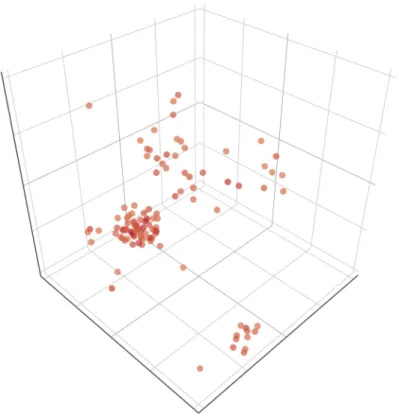
In fact, non-linear rearrangement occurs only due to direct contact with primary particles, while the other particles react linearly to them. Because the response of the particle displacement is linear, I assume that the total displacement is a superposition of linear responses of the primary particles beyond the nonlinear region. To show this, I apply a fictitious process to each primary particle while fixing all other particles, then calculate a superposition of the displacements.
This superposition is compared to the displacement by the fictitious process, with the positions of all primary particles fixed. Particles in the MD final state are drawn as large spheres and particles in the fictitious state are marked as dots. In the short displacement region (a < 0.25), nonlinear response is observed, while linear elastic response is observed in the longer displacement region.
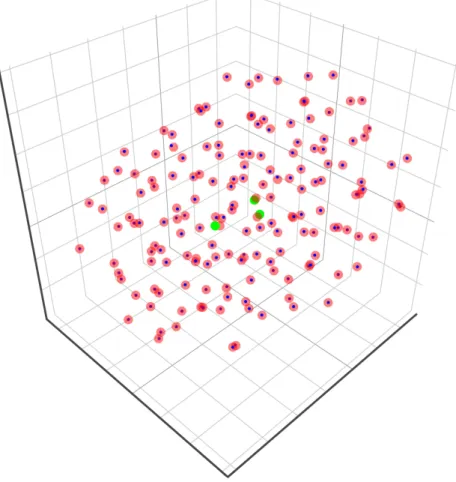
Relation between softness and inherent structure of particles
Green spheres correspond to tor0, cyan spheres correspond to r0, and yellow spheres correspond tor1, respectively.
Conclusion
The deformation of the liquid surface under the external electric field reported more than a century ago [42, 43]. Wilson and Taylor [44] described the stability limit of the soap bubble under the uniform external electric field. In the 1960s, quantitative experiment and mathematical modeling for the surface stability limit under the external electric field developed [45,46].
In the 1990s, the stability limit of the liquid surface with external electric field was estimated using a numerical method. They estimate the equilibrium cone shape of a droplet with a fixed contact angle and a fixed contact line case, respectively, under the different intensity of the external electric field with a fixed droplet volume. 49] performed electrohydrodynamic (EHD) simulation to reproduce the observed experimental results, such as cone shape formation, jet emission, and point flow of the liquid droplet.
The simulation results confirmed that if the liquid droplet is a perfect conductor or insulator, then tip leakage will not occur. Berozet al.[50] the stability limit of liquid droplet with uniform external electric field is measured experimentally. While the contact line is fixed, they slowly increased the volume of the liquid droplet to measure the stable critical shape of the droplet.
In this chapter, I focus on deriving the time evolution equation for the droplet shape as it evolves towards the stability limit. In the later part of this chapter, I will use Onsager's principle to obtain the time evolution equation of the droplet shape using the variational method.
Onsager’s principle
The next task is to compare this time evolution equation with ∂R/∂Vi = 0, after defining the RayleighianR in the following way,. For the last equation, I applied the reciprocal relation, ζij =ζji and the time evolution equation (Eq.3.5). Because the friction coefficient tensor is positive definite, the Rayleighian has a unique global minimum when ∂R/∂Vi = 0.
This method, which minimizes the Rayleighian with respect to Vito to obtain the time-evolution equation of the generalized coordinatesXi, is called the Rayleigh's principle of least energy dissipation. Onsager later extended this Rayleigh's principle of least energy dissipation to the irreversible system. S˙(Xi, Vi)−W (Xi, Vi) (3.10) where S is the entropy of the irreversible system, and the resulting time evolution equations are shown to be valid for the non-equilibrium state [55],[56 ] .
In Doi's adaptation, the above Onsager's principle, assuming an isothermal situation, is modified as follows. where Xi are the generalized coordinates describing nonequilibrium states and A is the free energy of the nonequilibrium state. This is my starting point for applying Onsager's principle to the droplet problem. With this new formalism, it can be shown that the instantaneous force acting on a slow variable whose relaxation time is longer than that of others is expressed by the following approximation equation. 3.14).
During the evolution that the system spontaneously approaches an equilibrium, one can assume Fi = 0, and this means that the time evolution equation for slow variables can be approximated by P. To put it another way, the real Rayleighian always exists for slow variables at least approximately, and the corresponding time evolution equation can be found by applying the variational principle.
Profile evolution of the droplet
Dissipation function
This may be the case because the radial length scale is in variation about O(100) times longer than the height length scale.
Free energy variation
Note that the liquid-solid boundary is not taken into account, so the interfacial tension at the bottom does not change during evolution.
Results
Conclusion
Harrowell, Predicting long-term heterogeneity of dynamics in a supercooled fluid from short-term heterogeneities, Physical Review Letters. Yodh, Measurement of correlations between low-frequency vibrational modes and particle rearrangements in quasi-two-dimensional colloidal glasses, Physical Review Letters. Bonn, Connecting Structural Relaxation to the Low Frequency Modes in a Hard Sphere Colloidal Glass, Physical Review Letters.
Liu, Identification of structural flow defects in disordered solids using machine learning methods, Physical Review Letters. Liu, Relationship between local structure and relaxation in out-of-equilibrium glass systems, Proceedings of the National Academy of Sciences. Reichman, Spatiotemporal hierarchy of relaxation events, dynamical heterogeneities and structural reorganization in a supercooled liquid, Physical Review Letters.
Gado, Soft modes and nonaffine rearrangements in the inherent structures of supercooled liquids, Physical Review Letters. Yodh, Heterogeneous activation, local structure and softness in supercooled colloidal fluids, Physical Review Letters. Inscribed, Axisymmetric Shapes and Stability of Charged Droplets in an External Electric Field, Physics of Fluids A: Fluid Dynamics.
Scriven, Axisymmetric shapes and stability of suspended and sessile drops in an electric field, Journal of Colloid and Interface Science. Shen, Structure and charge of hydrophobic material/water interfaces studied by phase-sensitive sum-frequency vibrational spectroscopy, Proceedings of the National Academy of Sciences.