KEEI Research Report 17-26
Measures to Improve the Subsidy Program for Electric Vehicle Purchases in South Korea
Seungmun Lee
Research Staff
Head Researcher: Seungmun Lee, Research Fellow
Research Associates: Seongjae Lee, Specialized Researcher
Outside Participants:
Prof. Jiung Lee, Pukyong National University
Dr. Ogyu Kwon, National Institute of Mathematical Sciences
ABSTRACT 1. Research Purpose
The subsidy policy for purchasing electric vehicles is a necessary policy for the activation of electric vehicles. In order to revitalize the early electric vehicle market, the electric vehicle purchasing subsidy policy is considered to play the most important role.
The purpose of this study is to analyze the trends of domestic and foreign electric vehicle purchase subsidies and to find out the problems of Korean electric vehicle purchase subsidies. Second, through surveys, we investigate consumers’ the perception and preference of Korean electric vehicles. Third, we examine the effects of subsidies for purchase of electric vehicles on the diffusion of electric vehicles and the dynamic path of subsidies for purchasing electric vehicles through simulation. Fourth, we suggest ways to improve subsidies for purchasing electric vehicles for spreading electric vehicles.
2. Summary
In order to investigate the preference of electric vehicles, a questionnaire survey was conducted. First, there is a need to expand the charging facility. In order to supply electric vehicles, the expansion of electric vehicle rapid charging facilities is recognized as the most important. The expansion of the charging infrastructure and the expansion of the electric vehicle increase the virtuous cycle indirect network effect. Second, there is an increase in benefits for environment friendliness.
The main reason consumers purchase electric vehicles is the environmentally friendly normative nature rather than the economic reasons. It is necessary to calculate the effect of the improvement of the environment caused by the electric car and to implement the policy so that it can be returned to the buyer of the electric car. Third, it is inducing a decline in initial purchase costs. The high price of electric cars is one of the reasons why electric cars are not popular, and the price of automobiles is the most important factor when purchasing cars. When the electric vehicle subsidy ends, the price of the electric car should be lowered a lot. Fourth, improvement of mileage and charging time. Technical factors related to electric vehicles, such as long charge time and short mileage, are also important factors in the non-purchase of electric vehicles.
There is a need for a technical solution to solve this problem. Fifth, the importance of the spread of various cars. According to the survey, the willingness to purchase electric cars for high-income households is lower than the intention to buy electric cars for middle- and low-income households. The reason is that there are no electric cars that the high income class wants.
In order to expand the supply of electric vehicles, it will be necessary to supply medium-sized electric cars and SUV-type electric vehicles.
Simulation results show some implications. First, in order to establish a long-term plan for an electric vehicle purchase subsidy, consideration should be given to the total amount of the electric vehicle purchase subsidy to be paid to the consumer for sizing the initial subsidy. Second, in order to set the initial subsidy amount, the total subsidy amount and the drop in electric vehicle prices should be considered. Third, the purchase subsidy policy is important in itself, but it can be more effective when implemented with other policies. Fourth, it is important to expand the choice of consumers through diversification of vehicle types. Fifth, it is necessary to increase the indirect network effect in the electric vehicle market.
3. Policy suggestions
This study aims to look at the improvement direction of the Electric Vehicle Subsidy Policy in four aspects based on the problems of the Electric Vehicle Subsidy System in Korea and the implications through questionnaires and simulations.
First, the electric vehicle subsidy system should be improved in such a way as to increase the direct network and indirect network effect of the electric vehicle market. This could be connected with the question of who needs the most grants and whether subsidies can create markets for them. Currently, consumers and private contractors are required to subsidize the electric car market in Korea. In other words, if an electric vehicle purchase subsidy can be passed on to both consumers and private charging companies, a virtuous cycle system intended for electric vehicle purchasing subsidies is expected to work. Second, the electric vehicle subsidy system should be able to solve the moral hazard problem which is the most important cause of failure of the subsidy policy. If the electric vehicle subsidy improves fuel efficiency, improves battery charging time, and improves the environmental performance by 1%, the effect of electric vehicle proliferation is the biggest improvement in fuel efficiency. Another consequence of moral hazard is that product prices do not easily fall. One way to lower the price of subsidized products is to increase competition for those products. Third, the electric vehicle purchasing subsidy system must have a long-term plan to gain consumer's trust. Long-term planning also involves setting up total
subsidies and setting initial subsidies. In order to operate the electric vehicle purchasing subsidy efficiently, the appropriate initial subsidy amount should be set. The size of the initial subsidy should be determined taking into account the time the total subsidy is depleted and the rate of decline in electric vehicle prices. The phase out of the subsidy should also take into account the rate of decline in electric vehicle prices. This should be designed so that the effective price that the consumer pays for the subsidy does not rise. Fourth, the electric vehicle subsidy system should ensure that positive externalities generated from the use of electric vehicles return to electric vehicle users. The lack of reliable estimates of social costs is a natural way to implement carbon pricing. If the carbon tax is applied, the carbon tax is applied. If the emission trading system is implemented, the market price of the emission right is adopted. In Korea, which carries out emission trading system, it would be natural to use the market price of carbon credits as an alternative to the SCC required for subsidy calculation.
Table of Contents
Chapter 1. Introduction ... 10
Chapter 2. Literature Review and Case Studies of Subsidy Successes and Failures ... 11
1. Literature Review ... 11
2. Successful Subsidy Policy Programs ... 12
A. Warm Front Scheme, United Kingdom ... 12
B. EV Market Growth in Norway ... 12
3. Failed Subsidy Programs ... 12
A. Energy Industry Subsidy Program, China ... 13
B. SunEdison, United States ... 13
C. Agricultural Subsidies, United States ... 13
D. Film Industry Subsidy in Michigan, United States ... 13
E. Green Deal, United Kingdom ... 14
F. Cause of Subsidy Failures ... 14
Chapter 3. EV Subsidy Trends in Korea and Worldwide ... 15
1. EV and Charging Infrastructure of EVs ... 15
A. EVs in Circulation ... 15
B. EV Infrastructure ... 18
2. EV Subsidy Policies Worldwide ... 20
A. United States ... 23
B. China ... 23
C. Japan... 23
D. United Kingdom ... 24
E. France ... 25
F. Germany ... 25
G. Norway ... 26
H. Netherlands ... 27
3. EV Subsidization Policy in South Korea ... 29
Chapter 4. Consumers’ Vehicle Preference Survey ... 32
1. Survey ... 32
2. Survey Results ... 34
A. Demographics, Miscellaneous Attributes, Environmental, and Technological Characteristics of Respondents (Survey Sections I and V) ... 34
B. Consumer Ownership and Use of Vehicles (Survey Section II) ... 38
C. EV Preferences (Survey Section III) ... 42
D. Implications... 50
3. Choice of Vehicles ... 51
A. Conjoint Method ... 51
B. Conditional Logit Model ... 52
Chapter 5. Simulated Analysis ... 57
1. Model Design... 57
A. Consumer Module ... 58
B. Automaker Module ... 63
C. Fuel Supplier Module ... 66
D. Government Module ... 66
2. Execution of the Model... 67
3. Scenario Analysis ... 69
4. Implications ... 73
5. Shortcomings and Contributions... 74
Chapter 6. Suggestions for Improving EV Purchase Subsidies ... 75
1. Increasing Network Effects ... 76
2. Addressing the Ethical Problems ... 78
3. Long-Term Planning ... 79
4. Transferring Positive Externalities to Consumers ... 79
A. Substituting Part of Purchase Subsidies with Emission Rights ... 79
B. Rewarding EV Drivers with Emission Rights ... 81
Chapter 7. Conclusion ... 83
References ... 84
Appendix ... 88
List of Tables
Table 3-1. Distribution of EVs in South Korea by Region ... 18
Table 3-2. Availability of Public Charging Stations as of June 2017 ... 20
Table 3-3. National EV Distribution Targets ... 21
Table 3-4. China’s EV Subsidies in 2017 ... 23
Table 3-5. UK EV Subsidization System ... 24
Table 3-6. UK Auto Driving Tax Schedule (Updated in April 2017) ... 24
Table 3-7. Dutch Auto Driving Tax Schedule by Year ... 28
Table 3-8. National Subsidies for EVs in South Korea ... 29
Table 3-9. Local Subsidies for High-Speed EVs in South Korea ... 29
Table 3-10. Tax Breaks for EVs in South Korea ... 30
Table 3-11. Subsidies for the Installation of Slow-Charging Stations ... 30
Table 4-1. Sections and Questions of the Consumer Survey ... 31
Table 4-2. Key Attributes of Hypothetical Vehicles for Selection ... 32
Table 4-3. Survey Overview ... 33
Table 4-4. Indirect Utility Function Estimates ... 52
Table 4-5. Indirect Utility Function Estimates (Late Adopters)... 53
Table 4-6. Indirect Utility Function Estimates (Slow Majority) ... 53
Table 4-7. Indirect Utility Function Estimates (Early Majority) ... 54
Table 4-8. Indirect Utility Function Estimates (Early Adopters) ... 54
Table 5-1. Distribution of Sizes of Domestic Vehicles Sold in Korea ... 58
Table 5-2. Default Settings for Estimating the Probabilities of Choosing Compact Vehicles ... 59
Table 5-3. Default Settings for Probabilities of Choosing Small Vehicles ... 62
Table 5-4. Prices of Parts for HEVs, PHEVs, and BEVs (2017) ... 65
Table 6-1. Suggested Improvements for EV Purchase Subsidies ... 77
List of Figures
Figure 2-1. Performance of the Green Deal Program (Introduced in 2013)... 14
Figure 3-1. Cumulative Numbers of EVs (BEVs and PHEVs) Sold ... 16
Figure 3-2. Shares of EVs (BEVs and PHEVs) in Domestic Vehicle Markets ... 16
Figure 3-3. Cumulative Numbers of EVs (BEVs and PHEVs) in Operation as of 2016 ... 17
Figure 3-4. Distribution of Commercial and Public Charging Stations (EVSE) ... 19
Figure 3-5. Distribution of Commercial and Public Fast and Slow Charging Stations as of 2016 ... 19
Figure 3-6. National Subsidies (in USD) for Purchases of BEVs ... 22
Figure 3-7. National Subsidies (in USD) for Purchases of PHEVs ... 22
Figure 3-8. Prices of Eco-Friendly and ICE Vehicles in France (in EUR 1,000s) ... 25
Figure 3-9. Prices of Eco-Friendly and ICE Vehicles in Germany (in EUR 1,000s) ... 26
Figure 3-10. Prices of Eco-Friendly and ICE Vehicles in Norway (in EUR 1,000s) ... 27
Figure 3-11. Prices of Eco-Friendly and ICE Vehicles in the Netherlands (in EUR 1,000s)... 27
Figure 4-1. Distribution of Respondents by Region ... 34
Figure 4-2. Distribution of Respondents by Age ... 34
Figure 4-3. Distribution of Respondents by Completed Level of Education ... 35
Figure 4-4. Distribution of Respondents by Average Monthly Household Income (After Taxes) ... 35
Figure 4-5. Distribution of Respondents by Driving Experience ... 36
Figure 4-6. Respondents’ Interest in Environmental Issues ... 36
Figure 4-7. Openness of Respondents to the Latest Technologies ... 37
Figure 4-8. Distribution of Respondent-owned Vehicles by Fuel Type... 38
Figure 4-9. Considerations When Making a Vehicle Purchase ... 38
Figure 4-10. Respondents’ Average Daily Driving Distance ... 39
Figure 4-11. Respondents’ Main Purposes for Driving ... 39
Figure 4-12. Respondents’ Estimated Timeframe Until Their Next Vehicle Purchase... 40
Figure 4-13. Important Considerations When Purchasing a Vehicle ... 40
Figure 4-14. Respondents’ Preferred Fuel Type for Their Next Vehicle Purchase ... 41
Figure 4-15. Reasons for Avoiding EVs (Two Reasons Per Respondent) ... 42
Figure 4-16. Reasons for Choosing EVs (Two Reasons Per Respondent) ... 42
Figure 4-17. Respondents’ Preferred EV Charging Time ... 43
Figure 4-18. Respondents’ Preferred Single-Charging Driving Distances for EVs ... 44
Figure 4-19. Preferred Modes of EV Charging ... 45
Figure 4-20. Preferred Station-to-Station Distances ... 45
Figure 4-21. Preferred Price Differences Between ICE Vehicles and EVs... 46
Figure 4-22. Respondents’ Timeframe for EV Purchases ... 46
Figure 4-23. Reasons for Future EV Purchase Timing (Two Reasons per Respondent) ... 47
Figure 4-24. Number of EV Purchasers Needed Before Respondents Would Purchase Their Own EV ... 48 Figure 4-25. Market Share of EVs in the New Vehicle Market Required for Respondents to Purchase Their Own EV. 48
Figure 4-26. Respondents’ Forecasts of EV Share of the New Vehicle Market by 2040 ... 49
Figure 5-1. Model Structure ... 56
Figure 5-2. Total Number of Owned Vehicles and Number of New Vehicles Sold (in Millions) ... 57
Figure 5-3. Distributions of Charging Station Accessibilities... 61
Figure 5-4. Automaker Module ... 63
Figure 5-5. Trend in Battery Pack Prices (USD/kWh) ... 64
Figure 5-6. Government Module ... 66
Figure 5-7. Basic Logic Flow of Model ... 67
Figure 5-8. Trends in the Growth Rate of EV Demand Under Different Scenarios ... 69
Figure 5-9. Cumulative Numbers of EVs Sold by 2030 by Scenario ... 70
Figure 5-10. Effects of Additional Scenarios on EV Demand Under Scenario 5 ... 71
Figure 5-11. Effects of Additional Scenarios Under Scenario 5 on EV Demand ... 72
Chapter 1. Introduction
In June 2016, the South Korean government announced plans to raise subsidies for the purchase of electric vehicles (EV) from KRW 12 million to KRW 14 million as part of its Special Measures for Particular Matter Control. The increased subsidy plan, which was approved at the 10th Trade and Investment Promotion Meeting held in July 2016, enables each consumer intent on purchasing an EV to receive up to KRW 14 million in government aid.1
The EV subsidy is a crucial part of boosting the EV market in Korea; in fact, subsidies have played a critical role in promoting the early growth of EV markets worldwide. A comparison of five countries in northwestern Europe (Norway, the Netherlands, France, Germany, and the United Kingdom) with relatively well-established EV markets showed that the pace of EV distribution was much faster in countries with government subsidies than in those without. Of the five countries, in those with government subsidies, it took 12 to 18 months for EVs to occupy 0.5 percent of the new auto market share.
However, it took more than three years for EVs to occupy the same market share in Germany, a country with no government subsidies available to EV consumers.2
In an effort to catch up with other countries in the region, the German government introduced a systematic and long-term plan in May 2016 for subsidizing the purchases of EVs. In April 2016, the German government set aside subsidy funds of EUR 1.2 billion for the enactment of plan, effectively reversing its previous stance on providing direct subsidies to EV consumers. In accordance with this plan, the German government has been subsidizing up to EUR 4,000 of the cost of each new EV purchased since May 2016. The subsidies will be provided until the end of 2020, benefitting approximately 400,000 purchases. Plug-in hybrid vehicles (PHEVs) and hybrid electric vehicles (HEVs) whose carbon dioxide emissions are 50 grams per kilometer or less are eligible for a subsidy of EUR 3,000 each.3
The EV purchase subsidies offered in Korea are currently the third highest in the world, second only to Singapore and France. Despite this, EVs purchases in Korea represent only 0.3 percent of all new vehicle purchases (as of 2016).4 This may suggest that the EV subsidy program implemented today in Korea is somehow inefficient or ineffective. Since EV subsidies in Korea have failed to promote the growth of the domestic EV market to the extent that they have in other countries, it is time to analyze the possible causes for this failure and redesign policy solutions as needed.
There are a number of objectives that guide this study. First, this study aims to analyze EV purchase subsidy trends worldwide with a view of identifying the problems plaguing EV subsidies in Korea. Second, this study uses the findings of an opinion poll to analyze and determine Korean consumers’ opinions and perceptions of EVs. Third, simulations are run to identify the effects of EV subsidies on EV distribution, focusing particularly on the reduction of subsidy amounts in stages. Fourth, measures are proposed to improve the EV subsidy program and boost the growth of the EV market in Korea.
This study is structured as follows. Following the Introduction (Chapter 1), Chapter 2 provides a literature review and presents case studies of successful and failed policy programs worldwide. Chapter 3 provides an analysis of global EV subsidy trends and discusses their implications for Korea. Chapter 4 presents the results of an opinion poll on Korean consumers’ attitudes toward EVs. Chapter 5 provides a simulation-based analysis of the likely effects of differing amounts of subsidies on EV market growth, implementing a long-term and dynamic perspective. Chapter 6 offers suggestions for improving the EV subsidy program in Korea based on the information and analyses provided in earlier chapters. Chapter 7 provides a summary of the findings and presents the conclusion of this study.
1 Ministry of Trade, Industry, and Energy (MOTIE), 2016, “Unveiling Measures to Foster the Development of New Products to Lead Korean Exports,” press release, July 7, 2016.
2 Bloomberg (1, February, 2016a), p. 2.
3 Korea Automobile Research Institute (KARI, 2016), Weekly Brief, No. 726, p. 4.
4 IEA, 2017 p. 49.
Chapter 2. Literature Review and Case Studies of Subsidy Successes and Failures
In this chapter, we will review existing literature on the effects of policy subsidies and discuss the successes and failures of subsidy policies worldwide.
1. Literature Review
David et al. (2000) reviewed existing literature at the time to determine whether government subsidies for R&D investment supplemented and increased private-sector investment or crowded it out. The authors found literature from the preceding 35 years that supported both the supplementary and crowding-out effects of government R&D subsidies. More specifically, firm-level studies primarily supported the crowding-out effect, while industry-level studies supported the supplementary effect. In other words, subsidies provided for firms enabled the subsidy beneficiaries to monopolize R&D investments and set up higher barriers, making it difficult for new market entrants. Subsidies provided for industries, on the other hand, created a synergy effect between companies and served to foster R&D investments in the private sector.
The authors, however, warned against generalizing their conclusion due to the wide diversity of firms, industries, and national governments providing subsidies.
Goolsbee and Guryan (2006) analyzed how subsidizing public schools to provide students with internet access influenced students’ academic performance. The E-rate Policy was introduced in the United States in 1998, providing subsidies for public schools and libraries so that more students could have access to the internet. Under the program, USD 2.26 billion was provided to recipient schools each year, subsidizing 20 to 90 percent of relevant internet costs (Goolsbee and Guryan, 2006, p. 1). The authors of the study sought to determine the outcomes of the E-rate Policy by analyzing whether raising subsidies also proportionally raised investments in internet-related technologies. They also sought to determine whether increased internet access had a positive effect on students’ academic performance in all public schools. The study focused on public schools in the state of California from 1996 to 2000. In 1997 and 1998, prior to the introduction of the E-rate Policy, only 55 percent of all public school classrooms in the state of California had access to the internet. The policy significantly raised the internet access rate to 85 percent in 2000-2001 (Goolsbee and Guryan, 2006, p. 6). In term of each school’s sensitivity to the increased internet access (whether or not it increased internet-related investments and saw better student performance), the results of the study varied by school. Elementary schools, in general, tended to be more sensitive than middle and high schools, and high schools were less sensitive than middle school. Urban schools and schools with relatively larger black and Latin American student populations were also more sensitive. The authors, however, concluded that the improved internet access made possible under the E-rate Policy failed to significantly improve students’ academic performance.
Kim (2008) sought to determine the premium effect of government and public-sector R&D subsidies on business performance. In his study, Kim divided the R&D investment of firms into two groups: investments made by the firm itself and subsidies from the government and public sector. He also analyzed whether receiving government subsidies affected the scale of the firm’s own investment in R&D and the firm’s performance (as measured in terms of labor productivity and current operating income rate). In terms of firm performance, Kim’s results for the premium effect of public subsidies were inconclusive, in part because his data was limited to a three-year span, and the production function model he used was somewhat unrealistic. However, Kim did affirm that government subsidies had the general effect of promoting firms’ own investment in R&D, particularly for “venture-type” startups.
Hussinger (2008) performed an empirical analysis of the effects of R&D subsidies provided by the German government to increase additional private-sector R&D investments in the manufacturing sector. In 1999, manufacturing firms in Germany invested a total of EUR 35.73 billion in R&D, and firms that received public R&D subsidies invested EUR 13.76 billion (Hussinger, 2008, p. 742). The author found that public subsidies in Germany had the effect of increasing private- sector R&D investment by at least 30 percent, and thus concluded that government subsidies supplemented, rather than crowded out, private-sector investment.
Kosters (2010) analyzed whether government subsidies for startups generated any positive externalities, particularly in terms of mitigating imperfections in capital market due to information asymmetry. The study further sought to determine whether such subsidies helped create jobs and/or enhance the survival prospects of startups. The analysis specifically targeted startups in their third year of operation in Thuringia in east Germany. Of the 162 startups analyzed, 45 percent received government subsidies. The author’s analysis of the effect of the subsidy policy in terms of propensity scores showed that the subsidies did not mitigate imperfections in capital market, but rather caused them to worsen, and neither improved the survival prospects of startups nor helped them create jobs. The author concluded that the policy subsidies artificially increased the competitiveness of inefficient firms, leading to greater market distortion and deadweight losses.
Catozzella and Vivarelli (2014) analyzed whether government R&D subsidies led Italian firms to increase their own
investment in R&D and contributed to increased production innovation, thereby improving the sales performance of the targeted firms. The authors asked firm representatives whether they had received government subsidies for product development, etc., from 1998 to 2000. They then analyzed whether the subsidy beneficiaries had succeeded in producing innovative products by 2000. The authors concluded that, while government subsidies did increase firms’ own investment in R&D, they adversely influenced product innovation. The authors argued that internal investment, rather than external investment (such as through government subsidies) had a greater positive impact on product innovation.
Yang et al. (2016) categorized the EV purchase subsidies of countries with well-established EV markets by payout method and duration, and analyzed how these subsidies lowered the actual costs of EVs compared to the costs of conventional vehicles of the same class and segment. The authors also analyzed how these subsidies influenced the growth of the EV market in each respective country, with a view of finding the most efficient way to design an EV subsidy program. The authors concluded that, in order to boost EV market growth, EV subsidies must be made available to consumers at the time of EV purchase. They further argued that consumers must be made aware of the detailed benefits of purchasing an EV using a subsidy in terms of income, displacement, emissions, and battery capacities. The authors also suggested that subsidies should be made available to diverse auto markets (private purchases, government/public purchases, taxis, car- sharing, lease markets, etc.) and that governments should make the exact timeline of each subsidy clear to consumers.
2. Successful Subsidy Policy Programs5 A. Warm Front Scheme, United Kingdom
The Warm Front Scheme was introduced in the United Kingdom with the goal of subsidizing insulation installation costs, etc. to help energy-poor households save on heating and energy. The program was initially introduced in June 2000 as part of the New Home Energy Efficiency Scheme but was renamed the “Warm Front Scheme” in February 2001. The program provided subsidies of up to GBP 2,700 per household for insulation and the installation of central heating (Hulme, 2008, p. 1). Hulme (2008, p. 5) found that this program not only helped lower-income households save on heating costs, but also led to an estimated 0.49 Mt Co2 decrease in carbon emissions every year from June 1, 2000, to March 31, 2008. The United Nations Economic Commission for Europe (UNECE, 2015, p. 27) also affirmed that this scheme helped lower the nation’s energy intensity from 0.63 gigajoules per square kilometer (GJ/m2) in 2001 to 0.41 GJ/m2 in 2011.
B. EV Market Growth in Norway
Norway has the highest market share of EVs in the world. EVs were quickly adopted in Norway thanks to the construction of an extensive charging network and groundbreaking tax breaks, which made the prices of EVs as competitive as internal combustion engine (ICE) vehicles. The Norwegian government pioneered EV policy by introducing consumption tax exemptions for EV purchases as early as 1990, and by lowering value-added taxes (VATs) on EV purchases by 25 percent in 2001. These tax breaks substantially reduced EVs prices. Along with these tax breaks, EV drivers in Norway can also charge their vehicles for free, drive on roads toll-free, enjoy free parking, and even ride ferries for free. EV drivers, moreover, are also allowed to drive alone in faster, bus-only lanes.6 In addition to these policy supports, which have contributed to EV market growth in Norway, most families in Norway live in detached homes, making it relatively easy for them to install private charging facilities in their home garage. Due to this unique combination of factors, Norway (which only has a population of five million or so7) has the fourth highest number of EVs currently in use and has the highest EV usage rate worldwide ((as of 2016, based on information provided by the International Energy Agency (IEA), 2017, pp. 49-51)).
3. Failed Subsidy Programs
5Many thanks to Dr. Unam Seong of the Korea Corporate Governance Service (KCGS), who shared numerous examples of successful and failed subsidy policies at the advisory board meeting.
6“Zero Tax, Zero Charging Fee, Zero Parking Fee: Norway Becomes Paradise of EVs,” published in The Joongang Ilbo, dated November 20, 2014.
7Population of 5.233 million as of 2016 (retrieved through Google on November 21, 2017).
A. Energy Industry Subsidy Program, China8
Hanergy TFP, a photovoltaic (PV) cell manufacturer in China listed on the Hong Kong Stock Exchange (HKSE) since 1996, saw its stock price soar from HKD 2 (KRW 304) in May 2014 to HKD 9 (KRW 1,368) in early 2015. The company’s rise in stock price was so dramatic that, in February 2015, it briefly made the company’s chairman the richest person in China, outranking even Jack Ma of Alibaba. The company’s stock price, however, plummeted on May 20, making the company’s stocks untradeable on the HKSE. The company’s chairman stepped down in May 2016 due to management and financial difficulties. Wuxi Suntech, another PV cell manufacturer, declared bankruptcy in 2013, while Yingli Solar also defaulted on the payment of debts twice, in October 2015 and May 2016.
The fall of PV manufacturers in China can be attributed to the oversupply of PV products, mainly caused by the Chinese government’s indiscriminate subsidy policy. The Chinese government distributed immense amounts of subsidies to companies in order to foster new industries, giving birth to innumerable startups and excessive investments. Wind energy, too, suffers from the nation’s problem of oversupply, with CNY 18 billion-worth of electricity generated by wind turbines going to waste each year (as of 2015). In the early half of 2015 alone, the amount of wind energy wasted was equivalent to approximately 15 percent of all electricity generated in China.
B. SunEdison, United States9
SunEdison is a PV energy company in the United States that was established in 2003. Under the new and renewable energy policies introduced by the Bush Administration, the company received subsidies and tax breaks from the federal government totaling USD 650 million. This earned SunEdison 13th place on the list of companies that have received the largest amount of federal subsidies since 2000. In addition to federal support, SunEdison also claimed subsidies from the state government and made use of other available policy support programs, including federal loans, credit guarantees, and untaxable federal bonds. Using these subsidies, SunEdison rapidly expanded its operations, completing mergers and acquisition deals worth a total of USD 2.6 billion in just under 19 months. However, the company then delayed the disclosure of its annual report twice in 2015 and ultimately defaulted on debt payments amounting to USD 1.4 billion.
C. Agricultural Subsidies, United States10
Agricultural subsidy programs were first introduced in the United States in the 1930s as part of efforts to protect farmers against fickle weather and climate conditions. Today, however, these agricultural subsidies mainly benefit gigantic food corporations and wealthy business people. In 2014, recognizing the shift of the subsidies away from their original purpose, the US Congress amended relevant laws, reducing the amounts of subsidies directly paid to farmers and raising insurance coverage for crop damage. Today, the US federal government provides farmers with nearly USD 20 billion a year in insurance benefits and subsidies. The excessive generosity of these agricultural subsidies, however, encourages unethical behavior among some farmers. The promise of insurance benefits, for example, can act as a disincentive for farmers to cultivate crops in good soil or increase productivity using necessary fertilizers and/or pesticides. Recent statistics on household incomes show that 10 to 15 percent of all farming households in the United States claim 85 percent of all federal agricultural subsidies; the income for these relatively few families is several times larger than that of the representative taxpaying household of the United States. Since a few farmers claim the majority of benefits, struggling farmers with a genuine need for subsidies are denied policy benefits.
D. Film Industry Subsidy in Michigan, United States11
The state legislature in Michigan enacted a statute in 2008 introducing subsidies for the local film industry, making Michigan the most advantageous state for filmmakers in the United States. Under the statue, filmmakers were provided with up to 42 percent of their filmmaking costs; however, much of the resulting benefits of these film subsidies were reaped
8 “Enlarged by Government Subsidies, Felled by Bad Business: Oversupply in the Chinese Energy Industry Highlights Policy Shortcomings,” published in Chosun Biz, dated June 6, 2016.
9 “SunEdison’s Subsidy-Fueled Collapse” in the National Review (April 4, 2016).
10 “Should Washington End Agriculture Subsidies?”, published in The Wall Street Journal, dated July 12, 2015.
11 Mackinac Center (2015), Subsidies Halted for Michigan’s Film Industry (August 4).
by larger film studios based in other states. The finance committee of the Michigan upper-house legislature reported that, in 2011, the state paid USD 125 million in film industry subsidies, but only saw a state-wide revenue of USD 13.5 million the same year. Moreover, even though USD 475 million of taxpayers’ money was spent on subsidizing the state’s film industry, the number of jobs in the local film industry decreased from 1,663 in 2008 to 1,561 in 2014. The state legislature thus repealed the film industry subsidy on July 10, 2015.
E. Green Deal, United Kingdom12
The UK government introduced the Green Deal Program in an effort to improve the energy efficiency of residential buildings—the largest source of greenhouse gas emissions. Under the program, homeowners could invest in energy- efficient facilities and insulation and receive reimbursements over time from the government based upon the amount of energy saved by the energy-efficient facilities and insulation. The program specifically targeted worn-down buildings in need of new boiler systems and insulations and/or PV panels. The program intended to encourage the owners of these buildings to install insulation and switch to condensing boiler systems and other such efficient facilities. Policymakers hoped that the program would help households save on energy costs and significantly reduce greenhouse gas emissions.
Figure 2-1. Performance of the Green Deal Program (Introduced in 2013)
Source: The Guardian (April 14, 2016), quoting the Department of Energy and Climate Change (DECC), National Audit Office analysis.13
The program exerted little of the anticipated effect. While the UK government estimated that the program would benefit 1.4 million households, only 14,000 households ended up participating in program. Although the program reduced initial installation costs for homeowners, the interest rate for program loans was seven percent, which imposed a significant financial burden on participating households. Furthermore, the GBP 400 million that went toward subsidizing initial investments failed to significantly reduce greenhouse gas emissions, mainly because the program was unable to attract a sufficient number of participants due to limited advertising. With the limited number of participants, it would have taken 25 to 30 years for the program to show the anticipated results, notwithstanding the substantial amounts of financial resources that were initially invested.
F. Cause of Subsidy Failures
A survey of existing literature and failed subsidy policies worldwide leads us to conclude that unethical behavior is the primary cause of failed subsidy programs. In the case of the agricultural subsidies in the United States, for example, the subsidies acted as a disincentive for farmers to plant their crops in good soil and carefully manage their farms. Likewise, R&D investment subsidies for firms led firms to rely too much on money and reduced their active efforts to innovate and increase their competitiveness. These subsidies instead caused them to overproduce their products, leading to market distortions and deadweight losses of fiscal resources. In general, each of the subsidies reviewed tended to benefit people without any real need, while passing over those who could truly benefit from it. In order to avoid the unethical behaviors that typically arise with the provision of subsidies, it is crucial for policymakers to thoroughly research and carefully design an optimal subsidy program. One of the ways policymakers can do this is by gleaning lessons from the real-life subsidy programs that have succeeded and failed all across the world.
12 Korea Energy Economics Institute (KEEI, 2016), Energy Market Insight: Current Issue Analysis, pp. 7-8.
13 No primary source for the cited “DECC, National Audit Office analysis” could be found.
Chapter 3. EV Subsidy Trends in Korea and Worldwide 1. EV and Charging Infrastructure of EVs
A. EVs in Circulation14
Nearly two million EVs, including battery-operated vehicles (BEV) and plug-in hybrid vehicles (PHEV), were distributed worldwide as of 2016. The number of EVs sold worldwide was about 16,000 in 2010, and this number rose steeply thereafter due to active subsidization by governments in various countries. The number of EVs sold grew by an average of 122.0 percent per year from 2010 to 2016, with the cumulative number of EVs sold annually increasing by more than twofold each year. Accordingly, EVs made up over one percent of all vehicles sold worldwide in 2016.
The United States led the early boom of EV distribution. The Nissan Leaf and the Tesla Model S led EV market development in the U.S., with sales volumes quickly increasing until 2013. China, a latecomer to the world EV market, increased its numbers of EVs rapidly as a result of the Chinese government’s rigorous environmental and subsidization policies. These policies helped create the fastest recorded growth rate of EVs since 2014. By 2016, China’s cumulative number of EVs sold eclipsed the United States’ sales, and China became the world’s largest domestic EV market. In 2016 alone, 336,000 EVs (including 250,000 BEVs) were sold in China, which was double the number of EVs sold in the United States. By 2016, China’s cumulative number of EVs sold reached 650,000. In contrast, the United States sold only 565,000 EVs during the same time period. More specifically, battery-operated electric vehicles have consistently been more popular than PHEVs worldwide, despite the former’s generally higher prices. This is in part because governments worldwide have subsidized the higher costs of acquiring BEVs, and also because the BEV market in China grew so rapidly. BEVs in operation throughout China as of 2016 outnumbered PHEVs by over 300,000, while more PHEVs than BEVs are in operation throughout the rest of the world.
The United States, Japan, Norway, and the Netherlands represent the next largest cumulative number of EVs sold, following China and the United States. Even though Japan has a consistent EV market, EVs still make up only 0.6 percent of all vehicles sold. With a cumulative number of 130,000 EVs sold, Norway boasts the highest share of EVs in the general vehicle market, at 28.8 percent. Of the EVs sold in the Netherlands, PHEVs make up 88.3 percent.
EVs are predominantly sold in developed countries, with the nine leading countries (China, the United States, Japan, Norway, the Netherlands, the United Kingdom, France, Germany and Sweden) consistently representing 93 percent of the world EV market, in terms of the number of vehicles sold. Despite this fact, EVs are still not widespread in every developed area, even in the leading countries. For example, the combined cumulative number of EVs recently sold in six European countries (Norway, the Netherlands, the United Kingdom, France, Germany, and Sweden) totaled 520,000; this number fell short of the cumulative number of EVs sold in the United States alone during this same time period.
14 See tables in IEA, Global EV Outlook 2017: Two million and counting, p. 49 and p.51.
Figure 3-1. Cumulative Numbers of EVs (BEVs and PHEVs) Sold
Source: IEA, Global EV Outlook 2017: Two million and counting, p.49.
중국, 미국, 일본, 노르웨이 네덜란드, 기타, 영국, 프랑스
독일, 스웨덴, 캐나다, 대한민국, 인도
China, US, Japan, Norway, Netherlands, Other, UK, France
Germany, Sweden, Canada, South Korea, India
Figure 3-2. Shares of EVs (BEVs and PHEVs) in Domestic Vehicle Markets
Source: IEA, Global EV Outlook 2017: Two million and counting, p.51.
전체 Overall
0 300 600 900 1200 1500 1800 2100
2010 2011 2012 2013 2014 2015 2016
천 대
중국 미국 일본 노르웨이 네덜란드 기타 영국
프랑스 독일 스웨덴 캐나다 대한민국 인도
Figure 3-3. Cumulative Numbers of EVs (BEVs and PHEVs) in Operation as of 2016
Source: IEA, Global EV Outlook 2017: Two million and counting, p.49.
천대 In thousands
Since the Korean government began subsidizing individuals’ purchases of EVs in 2013, the cumulative number of EVs in operation in the country grew by over tenfold, from 1,000 in 2013 to 10,000 by 2016. Nevertheless, even this increased number of EVs makes up only 0.05 percent of the total cumulative number of all vehicles sold in the country.15 EVs also made up only 0.3 percent of all vehicles sold in Korea in 2016, far below the national average of 1.1 percent worldwide in the same year (IEA, 2017, p. 49). The numbers of EVs sold in Korea also vary significantly from region to region. Since adopting the policy objective of making the island a carbon-free region by 2030, Jeju has been leading the increase in the number of EVs sold throughout Korea. EVs sold on this island make up over 50 percent of all EVs sold nationwide, suggesting that EVs are extremely unpopular elsewhere in Korea. Seoul and Jeonnam were the regions with the next two highest numbers of EVs sold. Interestingly, almost twice the number of EVs were sold in Jeonnam as in Gyeonggi, Korea’s most populated province. This is likely because a number of cities in Jeonnam, including Suncheon and Naju, provide subsidies at very competitive rates.
15 MOLIT, Statistics on Registered Vehicles as of December 2016.
0 100 200 300 400 500 600 700 천 대
BEV PHEV
Table 3-1. Distribution of EVs in South Korea by Region
Region 2011 2012 2013 2014 2015 2016 Total
Total 338 753 780 1,075 2,907 5,914 11,767
Seoul 73 285 330 212 452 455 1,807
Busan 8 10 3 84 106 117 328
Daegu 7 5 4 5 92 209 322
Incheon 11 23 15 10 8 51 118
Gwangju 1 3 62 52 75 54 247
Daejeon 4 6 6 2 7 42 67
Ulsan 7 2 3 5 34 46 97
Sejong 0 2 2 3 1 14 22
Gyeonggi 35 74 31 58 84 226 508
Gangwon 9 10 6 21 36 57 139
Chungbuk 5 6 6 3 8 14 42
Chungnam 8 59 33 22 10 24 156
Jeonbuk 1 9 3 4 10 12 39
Jeonnam 50 40 22 50 209 634 1,005
Gyeongbuk 15 40 32 28 37 125 277
Gyeongnam 58 35 62 107 123 128 513
Jeju 46 144 160 409 1,615 3,706 6,080
Source: ME, Prior Information Published, (http://www.me.go.kr/home/web/index.do?menuId=10123), accessed on November 21, 2017.
B. EV Infrastructure16
A total of 320,000 (slow and fast) EV chargers had been distributed worldwide as of 2016. The growth of fast-charging stations is particularly impressive in China. Whereas the country had zero fast-charging stations in 2013, it became home to 21,000 slow-charging stations and 9,000 fast-charging stations in 2014. The number of fast-charging facilities in China multiplied by 631.1 percent between 2015 and 2016, reaching approximately 88,000 stations in 2016. This number is significantly above the 52,000 slow-charging stations that had previously existed. As a result of this growth, China is home to 43.8 percent of all EV charging stations and to over 80 percent of all fast-charging stations found in the world today.
After China, the United States contains the second largest number of installed charging stations, and its cumulative total adds up to less than 30 percent of China’s number of stations.
While EV charging stations appear to be growing in number, the exact details of the infrastructure are difficult to observe.
The diversity of housing structures and the extensive availability of personal charging facilities makes it a challenge to compare the extensiveness of charging infrastructure of different nations. For example, there are only about 8,000 commercial and public charging facilities in Norway, despite the relatively high number of EVs in circulation in the country. This primarily results from the prevalence of detached houses with private garages, where personal charging facilities can be easily set up. Whether private or public, approximately 20,000 charging facilities are found on average in countries that lead the world EV market.
16 See the table in IEA, Global EV Outlook 2017: Two million and counting p.52.
Figure 3-4. Distribution of Commercial and Public Charging Stations (EVSE)
Source: IEA, Global EV Outlook 2017: Two million and counting, p. 52.
백대 In hundreds
Figure 3-5. Distribution of Commercial and Public Fast and Slow Charging Stations as of 2016
Source: IEA, Global EV Outlook 2017: Two million and counting, p. 52.
완속충전 급속충전
Slow-charging Fast-charging
A total of 3,114 charging stations have been distributed across Korea as of June 2017. Unsurprisingly, Jeju contains 508 stations, the largest number in the country. This number means that there is at least one available charging station for every 12 EVs. Daejeon, Sejong, Chungbuk, and Jeonbuk, by contrast, show EV-station ratios of less than one. Due to these low numbers, these regions likely experience difficulty maintaining their existing charging stations.
0 200 400 600 800 1000 1200 1400 1600 백 대
완속충전 급속충전
Table 3-2. Availability of Public Charging Stations as of June 2017
Region Number of EVs (2016) Total Fast Slow
Total 11,767 3,114 1,508 1,606
Seoul 1,807 372 214 158
Busan 328 122 52 70
Daegu 322 251 85 166
Incheon 118 87 37 50
Gwangju 247 94 44 50
Daejeon 67 77 31 46
Ulsan 97 45 24 21
Sejong 22 28 8 20
Gyeonggi 508 481 184 297
Gangwon 139 100 50 50
Chungbuk 42 115 55 60
Chungnam 156 111 65 46
Jeonbuk 39 129 58 71
Jeonnam 1,005 199 91 108
Gyeongbuk 277 161 91 70
Gyeongnam 513 234 97 137
Jeju 6,080 508 322 186
Note: The number of EVs is the cumulative total as of 2016.
Source: ME (2017), p. 4.
2. EV Subsidy Policies Worldwide
Increasing efforts are being made, particularly in Europe, to remove gasoline and diesel vehicles from the auto market.
Norway leads these efforts, having announced a policy objective of banning the distribution of any and all internal combustion engine (ICE) vehicles by 2025. The Netherlands will follow suit in 2030, as will the United Kingdom and France in 2040. The Chinese government is also contemplating plans to drive ICE vehicles out of the auto market by promoting EVs instead.
Table 3-3. National EV Distribution Targets
Country Target
China17 Working on deciding the timeline for eliminating ICE vehicles from the market Japan18 To raise the share of EVs to 20 to 30 percent of all new vehicles sold on the market
by 2030
France19 To prohibit the distribution of ICE vehicles in and after 2040.
UK20 To prohibit the distribution of ICE vehicles in and after 2040.
Germany21 To have at least a million EVs distributed by 2020.
Norway22 To prohibit the distribution of ICE vehicles in and after 2025.
Netherlands23 To prohibit the distribution of ICE vehicles in and after 2030.
South Korea24 To have at least 350,000 EVs distributed by 2022.
Sources: Newspaper articles; MOTIE (September 26, 2017).
Although the German government has ambitiously set out to raise the number of EVs sold to a million vehicles by 2020, only a total of around 70,000 EVs have been sold in the country as of 2016 (IEA, 2017, p. 49). Korea’s goal is to raise the number of EVs sold to 350,000 by 2022. Governments worldwide have introduced diverse measures to promote the distribution of EVs. While most of these measures involve subsidies and tax breaks, there are also additional benefits promised to EV drivers, such as free parking and permission to drive along bus-only lanes. The graphs comparing the amounts of subsidies provided by national governments for BEVs and PHEVs show that the Korean governments provide more in subsidies than many other governments.
A simple comparison of the amounts of subsidies, however, may hide the wide range of other policy benefits provided in different countries. The subsidies and tax breaks provided for EV drivers around the world need to be understood and compared in order to find implications for the EV support policy in Korea.
17 The Joong-Ang Ilbo (September 11, 2017), “China to Stop Production of Fossil Fuel Cars According to Timeline,”
(http://news.joins.com/article/21924416), accessed on November 21, 2017.
18 ET News (September 7, 2017), “Japanese Government to Raise Market Share of EVs to 20–30% by 2030,”
(http://www.etnews.com/20170907000288), accessed on November 21, 2017.
19 The Hankook Ilbo (July 7, 2017), “France to Declare Ban on the Sale of ICE Vehicles After 2040,”
(http://www.hankookilbo.com/v/0850d620a245422ca5fcc50113e1bb74), accessed on November 21, 2017.
20 Global Auto News (July 26, 2017), “UK Government Pushing for Ban on the Sale of ICE Vehicles Starting in 2040,” (http://global- autonews.com/bbs/board.php?bo_table=bd_001&wr_id=19059), accessed on November 21, 2017.
21 Chosun Biz (September 22, 2017), “From Diesel to Electricity: Chancellor Merkel Demands German Auto Innovation,”
(http://biz.chosun.com/site/data/html_dir/2017/09/21/2017092102529.html), accessed on November 21, 2017.
22 Chosun Biz (June 5, 2016), “Norway Reaches Consensus on Enacting Law to Ban the Sale of ICE Vehicles Starting in 2025,”
(http://biz.chosun.com/site/data/html_dir/2016/06/05/2016060500705.html), accessed on November 21, 2017.
23 Auto Times (October 15, 2017), “Netherlands to Prohibit Sale of ICE Vehicles Beginning in 2030,”
(http://autotimes.hankyung.com/apps/news.sub_view?nid=&c1=&c2=&nkey=201710131753261), accessed on November 21, 2017.
24 MOTIE (September 26, 2017).
Figure 3-6. National Subsidies (in USD) for Purchases of BEVs
Source: Bloomberg New Energy Finance, Electric Vehicle Policy Dashboard (November 2017), accessed on November 21, 2017.
싱가포르, 대한민국, 몰타, 프랑스 크로아티아, 포르투갈, 슬로베니아, 미국
Singapore, South Korea, Malta, France Croatia, Portugal, Slovenia, US 중국, 영국, 슬로바키아, 아일랜드
룩셈부르크, 헝가리, 루마니아, 스웨덴
China, UK, Slovakia, Ireland
Luxembourg, Hungary, Romania, Sweden 오스트리아, 독일, 일본, 인도 Austria, Germany, Japan, India
구매보조금 차량교체지원금 근로소득세액공제 세금감면
Purchase subsidies
Vehicle replacement subsidies Earned income tax credits Tax exemptions
Figure 3-7. National Subsidies (in USD) for Purchases of PHEVs
Source: Bloomberg New Energy Finance, Electric Vehicle Policy Dashboard (November 2017), accessed on November 21, 2017.
2,117 3,569
4,491 4,491 4,673 4,927
5,350 5,614 5,614 5,614 5,774
6,498 7,500
8,240 8,841
10,540 11,063
12,350 12,500
21,679
인도 일본 독일 오스트리아 스웨덴 루마니아 헝가리 룩셈부르크 아일랜드 슬로바키아 영국 중국 미국 슬로베니아 포르투갈 크로아티아 프랑스 몰타 대한민국 싱가포르
구매보조금 차량교체지원금 근로소득 세액공제 세금 감면
1,684 1,784 2,117
3,208 3,368 3,368 3,368 3,840 3,929 4,464
4,922 5,052
5,543 5,614
7,345 7,500 7,528
21,679
오스트리아 일본 인도 영국 몰타 슬로바키아 독일 중국 프랑스 대한민국 루마니아 슬로베니아 포르투갈 아일랜드 크로아티아 미국 스웨덴 싱가포르
구매보조금 차량교체지원금 근로소득 세액공제 세금 감면
A. United States
The U.S. government subsidizes individuals’ purchases of EVs, primarily with tax breaks. The federal tax credits introduced in 2010 provide from $2,500 to $7,500 for each vehicle purchased or leased, depending on the battery capacity.
Most BEVs are eligible for the maximum amount of tax credits, which is $7,500.25 The amounts of these government tax credits are to reduce incrementally over time once the number of eligible vehicles from each manufacturer reaches 200,000.
Fortunately, individual state governments also provide additional tax credits. For example, California, which has the largest number of EVs sold in the United States, provides $2,500 and $1,500 in additional tax credits for BEVs and PHEVs sold.26
A growing number of states, however, are rescinding their tax breaks and subsidies for EV purchases. For example, in July 2015, Georgia abolished the $5000 tax credit for EVs and started to levy the $200 of registration taxes that gasoline vehicles had on EVs as well.27 This is due to the Trump administration’s official change of switching from the eco-friendly energy policy of reducing greenhouse gas emissions to the America First Energy Plan, which encourages an increase in the development and production of fossil fuels. The deregulation of fossil fuels and the looming likelihood of the federal government decreasing its support for eco-friendly energy are leading state governments to adopt similar policy changes.
B. China
China lowered the amounts of EV subsidies (now ranging from CNY 20,000 to CNY 44,000) by approximately 20 percent from last year to this year, while also limiting the amounts of subsidies provided by local governments to 50 percent of the national government’s subsidies. Electric buses and freight cars are eligible for additional subsidies of CNY 300,000 and CNY 150,000 maximum, respectively. Registration tax exemptions on EVs were introduced on September 1, 2014, and EVs are still eligible for these registration tax exemptions.28
Table 3-4. China’s EV Subsidies in 2017 Vehicle type Driving
distance (km)
National
subsidies (CNY) Local subsidies BEVs
100≤R<150 20,000
Up to 50% of national subsidies 150≤R<250 36,000
R≥250 44,000
PHEVs R≥50 24,000
Sources: 第一电动, quoted in KOTRA (June 28, 2017), “Attention: New Energy Auto Market in China,” Overseas Market News.29
C. Japan
Beginning in 2017, Japan decided to differentiate the amounts of subsidies by the maximum distances that can be driven per single charging. Prefectural governments provide up to JPY 400,000, based on JPY 1,000 multiplied by each kilometer of driving distance. Local governments can pay JPY 100,000 to 200,000, or up to 50 percent of prefectural governments’
subsidies. PHEVs, too, are eligible for subsidies up to JPY 200,000. EVs in Japan are still eligible for exemptions on registration and weight taxes, as well as 75-percent discounts on auto taxes.30
25 For amounts of tax credits for different models of EVs, please see the Office of Energy Efficiency & Renewable Energy, Federal Tax Credits for All-Electric and Plug-in Hybrid Vehicles, http://www.fueleconomy.gov/feg/taxevb.shtml), accessed on November 21, 2017.
26 Bloomberg New Energy Finance, Global EV and Charging Policy Support Database, (https://www.bnef.com/core/insights/15281), accessed on November 21, 2017.
27 The Joong-Ang Ilbo (May 18, 2017), “US EVs No Longer to Enjoy Generous Subsidies,” (http://news.joins.com/article/21549884), accessed on November 21, 2017.
28 KOTRA (June 28, 2017), “Attention: New Energy Auto Market in China,” Overseas Market News, accessed on November 21, 2017 (this article forms the basis for the analysis of Chinese subsidies in this section).
29 Precise citation of the primary source, which is not properly cited in the secondary source.
30 Bloomberg New Energy Finance, Global EV, and Charging Policy Support Database, (https://www.bnef.com/core/insights/15281), accessed on November 21, 2017. This website forms the basis for the analysis of the Japanese subsidies in this section.
D. United Kingdom
The UK government subsidizes up to 35 percent of the vehicle price. The amount subsidized is based on a standard that divides the vehicle’s carbon dioxide emissions by kilometer. BEVs are eligible for subsidies of up to GBP 4,500, and PHEVs up to GBP 2,500. Electric fright cars are eligible for subsidies of up to 20 percent of their prices, or GBP 8,000 at maximum. Owners of BEVs costing less than GBP 40,000, are exempt from paying the auto taxes. The UK tax system also charges more taxes in proportion to carbon dioxide emissions. Individuals driving vehicles that generate fewer emissions can therefore enjoy tax discounts.31
Table 3-5. UK EV Subsidization System
Criterion GBP Examples
Vehicles that generate zero carbon dioxide emissions even
after driving 70 miles or more 4,500 BMW i3, Nissan Leaf Vehicles that generate 50 gCO2/km or less or zero carbon
dioxide emissions while driving for 10 to 69 miles 2,500 Audi e-tron, Toyota Prius Plug-in
Vehicles that generate 50 to 75 gCO2/km or zero carbon
dioxide emissions while driving for 20 miles or less 2,500
Source: GoUltraLow, (https://www.goultralow.com/electric-car-savings/electric-car-grants-and-savings/), accessed on November 21, 2017.
Table 3-6. UK Auto Driving Tax Schedule (Updated in April 2017) First-year tax on vehicles purchased after April 2017 Carbon dioxide emissions Gasoline/diesel
(GBP)
Alternative fuels (GBP)
0 gCO2/km 0 0
1–50 gCO2/km 10 0
51–75 gCO2/km 25 15
76–90 gCO2/km 100 90
91–100 gCO2/km 120 110
101–110 gCO2/km 140 130
111–130 gCO2/km 160 150
131–150 gCO2/km 200 190
151–170 gCO2/km 500 490
171–190 gCO2/km 800 790
191–225 gCO2/km 1,200 1,190
226–255 gCO2/km 1,700 1,690
255 gCO2/km or higher 2,000 1,990
Taxes
Fuel type 12-month 6-month
BEVs 0 0
Alternative fuels (incl. PHEVs) 130 71.5
Gasoline/diesel 140 77
Source: GoUltraLow, (https://www.goultralow.com/electric-car-savings/electric-car-grants-and-savings/), accessed on November 21, 2017.
31GoUltraLow, (https://www.goultralow.com/electric-car-savings/electric-car-grants-and-savings/), accessed on November 21, 2017.
This website forms the basis of the analysis of the UK subsidies in this section.
E. France
France provides up to EUR 6,000 for BEVs, and an additional EUR 4,000 for the disposal of any diesel vehicle produced and registered before January 1, 2006. PHEVs are eligible for subsidies of EUR 1,000, with an additional EUR 2,500 for disposing of old diesel vehicles. Some provinces provide 50-percent discounts on vehicle acquisition taxes or license tax exemptions. BEVs are also exempt from taxes payable for commercial vehicles, while PHEVs are eligible for this exemption for two years.32
Figure 3-8. Prices of Eco-Friendly and ICE Vehicles in France (in EUR 1,000s)
Source: Bloomberg New Energy Finance (2016b, p.7, see enclosed Excel file).
자동차가격 Price
부가가치세 VAT
취등록세 Acquisition/registration taxes
F. Germany
Consumers who purchase BEVs and PHEVs in Germany can receive up to EUR 4,000 and EUR 3,000, respectively, in subsidies. To be eligible, however, the vehicle price must be EUR 60,000 or less. In Germany, manufacturers provide 50 percent of the subsidies, and the government provides the remaining 50 percent. The current subsidy policy applies to 400,000 EVs or up to EUR 6,000,000 in subsidies provided by 2020. Owners of EVs are also exempt from paying auto taxes for 10 years, but this grace period will be halved to five years starting in 2021.33
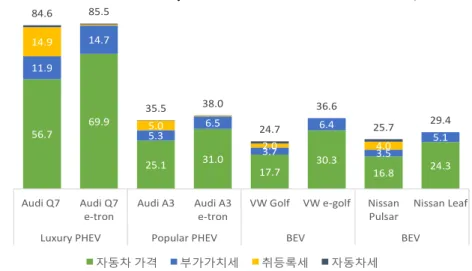
Figure 3-9 compares the costs German consumers pay for ICE vehicles and for EVs of the same class. The prices shown in the figure reflect the original prices from which the respective amounts of subsidies and the first required auto taxes have been subtracted. The gaps between the prices would therefore decrease somewhat if all the remaining nine auto tax breaks were considered. The auto taxes in Germany, however, are quite low to begin with, especially in comparison to Norway. Even with these benefits considered, the prices of EVs remain relatively high in Germany.
For example, even after a subsidy of EUR 4,000 and ten years’ worth of auto taxes are subtracted from the original price of a Volkswagen Golf, the EV would still be EUR 5,150 more expensive than the ICE.
The Nissan Leaf would still be EUR 6,255 more expensive than the ICE as well.
32 Clean Technica, Electric Car Incentives in Norway, UK, France, Germany, Netherlands, and Belgium
(https://cleantechnica.com/2017/09/02/electric-car-incentives-norway-uk-france-germany-netherlands-belgium/), accessed on November 21, 2017. This website forms the basis for the analysis of French subsidies seen in this section.
33 Clean Technica, Electric Car Incentives in Norway, UK, France, Germany, Netherlands, & Belgium,
(https://cleantechnica.com/2017/09/02/electric-car-incentives-norway-uk-france-germany-netherlands-belgium/), accessed on November 21, 2017.
54.0
68.1
24.7 35.2
18.5
31.8
19.7 29.4
10.8
13.6
4.9
7.0
3.7
6.4
3.9
5.9 66.5
82.3
30.1
42.6
22.5
38.2
23.9
35.3
Audi Q7 Audi Q7 e-tron
Audi A3 Audi A3 e-tron
VW Golf VW e-golf Nissan Pulsar
Nissan Leaf
Luxury PHEV Popular PHEV BEV BEV
자동차 가격 부가가치세 취등록세
Figure 3-9. Prices of Eco-Friendly and ICE Vehicles in Germany (in EUR 1,000s)
Source: Bloomberg New Energy Finance (2016b, p.7, see enclosed Excel file).
G. Norway34
The consumption tax exemptions for EVs have been in place in Norway since 1990. In contrast, the driving tax discounts were introduced in 1996, as were the 25-percent discounts on value-added taxes (VATs) in 2001. As a result of these tax support measures, Norway boasts the highest market share of EVs in the world today. Today, Norwegian consumers are exempt from paying NOK 100,000 (USD 12,000) in acquisition and registration taxes on eco-friendly vehicles. In addition, customers receive extra 25-percent discounts on VATs as well as auto tax and toll exemptions on BEVs. BEVs are also permitted to drive along bus-only lanes. The Norwegian government quickly boosted the EV market in the country by providing a variety of policy benefits in addition to subsidies. The government levies quite high acquisition/registration taxes and VATs on ICE vehicles that generate large amounts of pollutants, in order to make the prices of EVs even more competitive. A comparison of the prices of car models that have both EV and ICE vehicles available shows that the effective prices of PHEVs and BEVs remain substantially lower than those of ICE vehicles. This is primarily due to subsidies and tax breaks. Consequently, it is rational for Norwegian consumers to purchase EVs instead of conventional vehicles. The Norwegian government, however, has recently announced its plan to roll back tax breaks on EVs, partly due to the significant amounts of subsidies provided for luxury EVs. The same tax breaks will continue to apply until 2020.
34 Clean Technica, Electric Car Incentives in Norway, UK, France, Germany, Netherlands, & Belgium
(https://cleantechnica.com/2017/09/02/electric-car-incentives-norway-uk-france-germany-netherlands-belgium/), accessed on November 21, 2017.
49.4
67.6
21.8 31.8
20.2 29.3
19.1 28.9
9.4
12.9
4.1
6.1
3.8
5.6
3.6
5.5 59.2
80.8
26.0
38.0
24.2
34.9
22.9
34.4
Audi Q7 Audi Q7 e-tron
Audi A3 Audi A3 e-tron
VW Golf VW e-golf Nissan Pulsar
Nissan Leaf
Luxury PHEV Popular PHEV BEV BEV
자동차 가격 부가가치세 취등록세 자동차세