저작자표시-비영리-변경금지 2.0 대한민국 이용자는 아래의 조건을 따르는 경우에 한하여 자유롭게
l 이 저작물을 복제, 배포, 전송, 전시, 공연 및 방송할 수 있습니다. 다음과 같은 조건을 따라야 합니다:
l 귀하는, 이 저작물의 재이용이나 배포의 경우, 이 저작물에 적용된 이용허락조건 을 명확하게 나타내어야 합니다.
l 저작권자로부터 별도의 허가를 받으면 이러한 조건들은 적용되지 않습니다.
저작권법에 따른 이용자의 권리는 위의 내용에 의하여 영향을 받지 않습니다. 이것은 이용허락규약(Legal Code)을 이해하기 쉽게 요약한 것입니다.
Disclaimer
저작자표시. 귀하는 원저작자를 표시하여야 합니다.
비영리. 귀하는 이 저작물을 영리 목적으로 이용할 수 없습니다.
변경금지. 귀하는 이 저작물을 개작, 변형 또는 가공할 수 없습니다.
의 학 박 사 학 위 논 문
항 체 거 부 반 응 시 대 에 세 포 성 단 독 거 부 반 응 을 보 이 는 신 장 이 식 환 자 의 거 부 반 응 치 료 에 따 른 임 상 경 과
Pure T-cell mediated rejection following kidney transplant according to response to treatment in the era of antibody-
mediated rejection
울 산 대 학 교 대 학 원
의 학 과
권 현 욱
[UCI]I804:48009-200000363585 [UCI]I804:48009-200000363585
항 체 거 부 반 응 시 대 에 세 포 성 단 독 거 부 반 응 을 보 이 는 신 장 이 식 환 자 의 거 부 반 응 치 료 에 따 른 임 상 경 과
Pure T-cell mediated rejection following kidney transplant according to response to treatment in the era of antibody-
mediated rejection
지 도 교 수
조 용 필
이 논 문 을 의 학 박 사 학 위 논 문 으 로 제 출 함
2 0 2 1 년 2 월 울 산 대 학 교 대 학 원
의 학 과
권 현 욱
권 현 욱 의 의 학 박 사 학 위 논 문 을 인 준 함
심 사 위 원 조 용 필 ( 인) 심 사 위 원 전 흥 만 ( 인) 심 사 위 원 신 성 ( 인) 심 사 위 원 김 효 상 ( 인) 심 사 위 원 고 대 현 ( 인)
울 산 대 학 교 대 학 원
2 0 2 1 년 2 월
차 례
국 문 요 약 · · · i
표 차 례 · · · · i i
그 림 차 례 · · · · i i
서 론 · · · 1
본 론 · · · 2
결 론
· · · 1 0
참 고 문 헌
· · · 1 1
영 문 요 약
· · · 1 5
i
국 문 요 약
목 적 : 최 근 신 장 이 식 분 야 에 서 는 세 포 성 거 부 반 응 은 면 역 억 제 제 의 발 달 로 임 상 적 중 요 성 이 점 차 감 소 하 는 반 면, 항 체 매 게 거 부 반 응 에 대 한 연 구 는 증 가 하 고 있 다. 그 러 나, 실 제 임 상 에 서 는 이 식 후 오 랜 시 간 이 지 난 후 에 도 여 전 히 세 포 성 단 독 거 부 반 응 이 보 고 되 고 있 다. 이 번 연 구 의 목 적 은 항 체 거 부 반 응 의 시 대 에 발 생 하 는 세 포 성 단 독 거 부 반 응 이 이 식 신 장 기 생 존 율 에 미 치 는 영 향 을 확 인 하 고 자 함 이 다. 또 한 마 이 크 로 어 레 이 를 이 용 한 분 자 생 물 학 적 진 단 을 시 행 함 으 로 써 세 포 성 단 독 거 부 반 응 의 진 단 정 확 성 을 확 인 하 고 자 한 다.
대 상 및 방 법 :2 0 0 9 년 부 터 2 0 1 7 년 까 지 서 울 아 산 병 원 에 서 시 행 한 이 식 신 에 대 한 조 직 검 사 에 서 항 체 거 부 반 응 의 증 거 가 없 이 세 포 성 단 독 거 부 반 응 을 보 인 6 3 명 을 대 상 으 로 하 였 다. 6 3 명 은 스 테 로 이 드 치 료 의 반 응 여 부 에 따 라 무 반 응 군 ( 2 2 명) 과 반 응 군 ( 4 4 명) 으 로 나 누 었 으 며, 이 와 독 립 적 인 2 3 명 의 환 자 에 서 는 병 리 학 적 조 직 검 사 및 분 자 생 물 학 적 진 단 을 동 시 에 시 행 하 였 다.
결 과 : 신 장 이 식 으 로 부 터 거 부 반 응 의 진 단 시 기 는 무 반 응 군 이 반 응 군 에 비 해 유 의 하 게 길 었 다. 거 부 반 응 치 료 후 거 부 반 응 누 적 재 발 율 또 한 무 반 응 군 에 서 높 았 다. 조 직 검 사 시 사 구 체 여 과 율, 기 저 상 태 에 서 조 직 검 사 시 의 사 구 체 여 과 율 변 화, 1 년 이 후 에 발 생 한 세 포 성 거 부 반 응, 세 관 염 의 정 도, 간 질 섬 유 증/ 관 형 위 축 이 무 반 응 군 에 대 한 위 험 인 자 로 밝 혀 졌 다. 반 응 군 은 무 반 응 군 에 비 해 이 식 신 의 장 기 생 존 율 이 유 의 하 게 높 았 다. 분 자 생 물 학 적 진 단 은 항 체 매 게 거 부 반 응 에 서 는 병 리 학 적 진 단 과 우 수 한 일 치 율 은 보 였 으 나, 세 포 성 단 독 거 부 반 응 에 서 는 이 치 율 이 좋 지 않 았 다.
결 론 : 본 연 구 는 급 성 세 포 성 단 독 거 부 반 응 의 환 자 중 스 테 로 이 드 치 료 에 반 응 하 지 않 는 환 자 군 은 장 기 이 식 신 생 존 율 이 유 의 하 게 감 소 함 을 밝 혔 다. 다 만 분 자 생 물 학 적 진 단 을 통 해 1 년 후 발 생 하 는 세 포 성 단 독 거 부 반 응 의 병 리 학 적 진 단 이 정 확 하 지 않 을 수 있 음 을 밝 혔 으 므 로, 그 해 석 과 임 상 적 용 에 주 의 가 필 요 하 겠 다.
ii
중 심 단 어: 신 장 이 식, 세 포 성 거 부 반 응, 스 테 로 이 드 치 료, 분 자 생 물 학 적 진 단
표 차 례
Table 1. Baseline and clinical characteristics of study patients
· · · 1 6
Table 2. Clinical characteristics at the time of acute T cell-mediated rejection
· · · 1 8
Table 3. Pathologic characteristics at the time of acute T cell-mediated rejection
· · · 2 0
Table 4. Risk factors associated with non-response to rejectino treatment
· · · 2 2
Table 5. Risk factors associated with graft failure
· · · 2 3
Table 6. Baseline and clinical characteristics of the patients in the molecular
diagnosis group
· · · 2 4
Table 7. Agreement of histologic diagnosis with molecular diagnosis
· · · 2
iii
6
그 림 차 례
Figure 1. The changes in the estimated glomerular filtration rate
· · · 2 7
Figure 2. Cumulative incidence of recurrent rejection after rejection treatment
· · · 2 8
Figure 3. Overall graft survival rate after rejection treatment
· · · 2 9
Figure 4. Association between the molecular microscope diagnostic system and
the histological diagnosis
· · · 3 0
1
서 론
The first Banff classification for diagnosis of allograft rejection in kidney transplantation (KT), which was first introduced in 1991, mainly stipulated T-cell mediated rejection (TCMR) rather than antibody-mediated rejection (ABMR), and characterizedTCMR by T- cell infiltration in the graft interstitial tissues and tubules.[1] Over the last two decades, however, the impact of TCMR on graft survival (GS) has gradually decreased due to the advances in immunosuppressive agents.[2] Pure TCMR activity commonly occurs during the early periods after transplant and are rare after five years after transplant.[2] In addition, the treatment of acute TCMR using corticosteroids, the currently recommended treatment of choice, shows good responses in most cases.[3] Moreover, a prospective study reported that pure TCMR was no longer the cause of graft failure. [4] On the contrary, the number of studies highlighting the importance of AMBR and donor-specific antibody (DSA) in long- term GS has explosively increased.[4-6] Particularly, one study reported that ABMR was the primary cause of graft failure and accounted for 64% of the included patients with
pathological evidence.[4] Collectively speaking, the focus in KT research has largely shifted from TCMR to ABMR.
In clinical practice, however, clinicians still encounter cases of pure acute TCMR without evidence of AMBR in histological reports, even after a long time following transplant.
Recent studies on acute TCMR were mainly focused on the impact of TCMR combined with ABMR and chronic active TCMR,[7-9] and studies on acute pure TCMR, especially those occurring after more than one year after transplant, have been rarely performed.[10] Thus, even as studies are shifting toward ABMR, there is an unmet need to evaluate the clinical implication of pure TCMR according to the time of rejection and response to treatment.
To evaluate the impact of pure TCMR on clinical outcomes, the histologic diagnosis of pure TCMR should be first ensured. However, the diagnosis of TCMR by Banff
classification using interstitial inflammation and tubulitis relies on arbitrary thresholds and nonspecific lesions.[11] Moreover, interobserver error and poor reproducibility in histologic TCMR diagnoses have been issued as well.[12] In this aspect, molecular tests have emerged to reduce the ambiguity in histologic diagnosis of TCMR.[13]
2
In this study, we evaluated the impact of pure TCMR on GS according to treatment response.
We also performed molecular diagnosis using a molecular microscope diagnostic system (MMDx) biopsy assessment in an additional group analysis to determine the accuracy of the histologic diagnosis of pure TCMR.[13]
본 론
Materials and MethodsPatients
This was a retrospective, single-center study carried out at Asan Medical Center in Seoul, Republic of Korea. Among 276 patients diagnosed with acute rejection at our center between 2009 and 2017, we included 63 patients with first episode of pure acute TCMR. Patients with evidence of ABMR (N = 142), borderline TCMR (N = 65), and non-compliance (N = 6) were excluded. A total of 63 patients were thus included and divided into non-responders and responders according to response to rejection treatment. The molecular diagnosis and histologic diagnosis were conducted simultaneously on a separate group of 23 patients who agreed to participate in our study with informed consent between April 2018 and September 2018. The institutional review board of Asan Medical Center approved this study (AMC IRB number: 2018-0369).
Diagnosis and treatment of rejection treatment
Biopsies were only performed when there was a suspicion of acute rejection and were reviewed by experienced pathologists at our center following the most up-to-date Banff criteria at the time of diagnosis.[14] C4d staining was carried out in all specimens. HLA typing for detecting HLA-A, -B, -C, -DRB1, and -DQB1 was carried out by sequence-based typing. The DSA was measured at the time of biopsy by using HLA class I and II single antigen bead (LABScreen, One Lambda, Canoga Park, CA, USA) and detected by a Luminex system (LabScan100, One Lambda). At our center, methylprednisolone (mPD) pulse therapy was used as the primary treatment for acute TCMR; the total doses of mPD were 1500 mg for grade I TCMR and 2500 mg for grade II–III TCMR, and were gradually tapered to 16 mg per day until the second week and reduced to 4–8 mg per day thereafter.
Anti-thymocyte globulin (ATG) (thymoglobulin, Genzyme, Cambridge, MA, USA) was
3 used in patients with side effects against mPD.
Molecular diagnosis: microarray assessment
In addition to the four core specimens obtained for histological diagnosis, we obtained one additional biopsy core from 23 patients for molecular diagnosis. The extra biopsy samples for molecular diagnoses were immediately placed in RNAlater (Qiagen, Mississauga, Canada) to stabilize cellular RNA and sent to the Alberta Transplant Applied Genomics Centre (ATAGC, University of Alberta) for microarray analysis using MMDx [15] The molecular diagnosis provided classifier scores with positive cut-off values of ≥ 0.1 for TCMR and ≥ 0.2 for ABMR. TCMR MMDx scores were classified as normal, mild, moderate, and severe using the cut-off values of 0.1, 0.3, and 0.6. ABMR MMDx scores were classified as normal, mild, and severe using the cut-off values of 0.2 and 0.5.[15]
Finally, we compared the results of histological results conducted at our center with the MMDx reports.
Definition
Responders were defined as recipients whose serum glomerular filtration rate (GFR) decreased by less than 30% from baseline value at three months after rejection treatment, which was estimated using the modification of diet in renal disease (MDRD) equation.[10, 16] The cut-off value of 30% was used because this was the GFR that began to show significant differences in long-term GS after treatment. Accordingly, patients whose post- treatment GFR value decreased by more than 30% from the pre-treatment value were categorized as non-responders. The primary outcome was GS, which was defined as the time from the first episode of TCMR to return to dialysis or pre-emptive re-transplantation.
Secondary outcomes were the cumulative incidence of recurrent rejection and correlation between histologic and molecular diagnosis.
Statistical analysis
Categorical variables were evaluated by the chi-squared test or Fisher’s exact test as appropriate and presented as counts and percentages. Normally distributed continuous variables were analyzed by the Student’st-test and presented as mean ± standard deviation,
4
and non-normally distributed continuous variables were compared with Mann–Whitney U test and presented as medians and interquartile ranges (IQRs). Analysis of variance
(ANOVA) and Kruskal–Wallis test were used to analyze variables involving three groups, as appropriate. The GS and incidence of recurrent rejection rate after treatment were evaluated with the Kaplan–Meier method and compared using the log-rank test. The risk factors for non-response and graft failure were estimated by univariate and multivariate Cox
proportional hazard regression analyses. All statistical analyses were conducted in SPSS Statistics for Windows, version 18.0 (SPSS Inc., Chicago, IL, USA) and P-value of 0.05 was considered as the cut-off for statistical significance.
Results
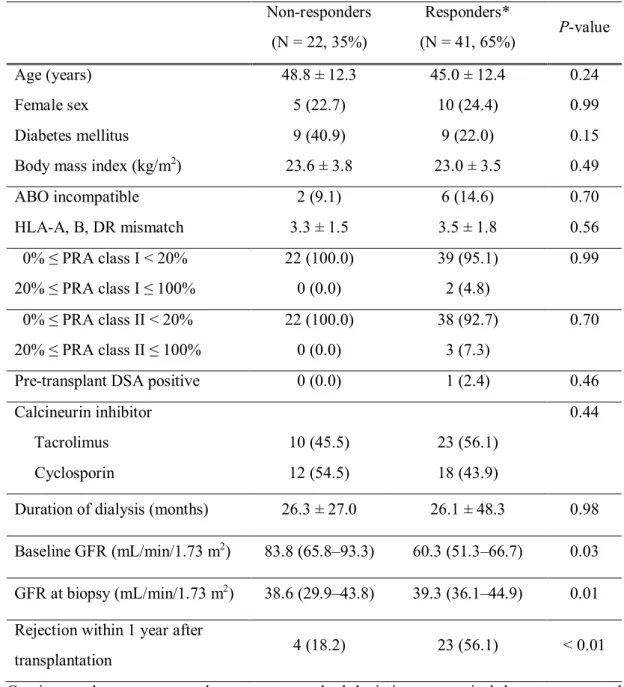
Patient demographic
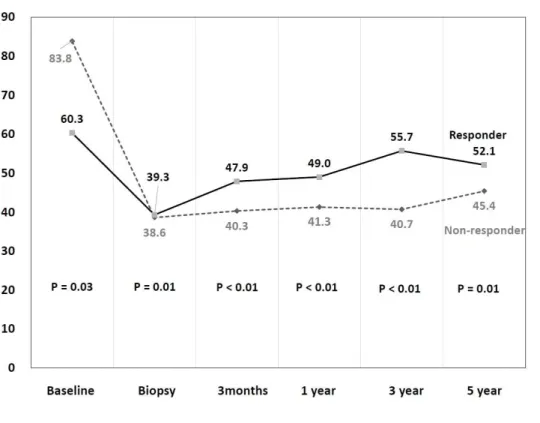
Of the 63 patients included in this study, 22 (35%) and 41 (65%) patients were categorized as non-responders and responders, respectively. The baseline demographics and clinical characteristics of the patients are shown in Table 1.The non-responders had a significantly higher median baseline GFR (83.8 mL/min/1.73 m2, IQR 65.8–93.3) than did the responders (60.3 mL/min/1.73 m2, IQR 51.3–66.7; P =0.03). The proportion of patients who developed TCMR within one year after transplantation was significantly higher in the responder group (56%) than in the non-responder group (18%; P < 0.01). Otherwise, there were no significant differences between the two groups.
Clinical and histological characteristics at the time of TCMR
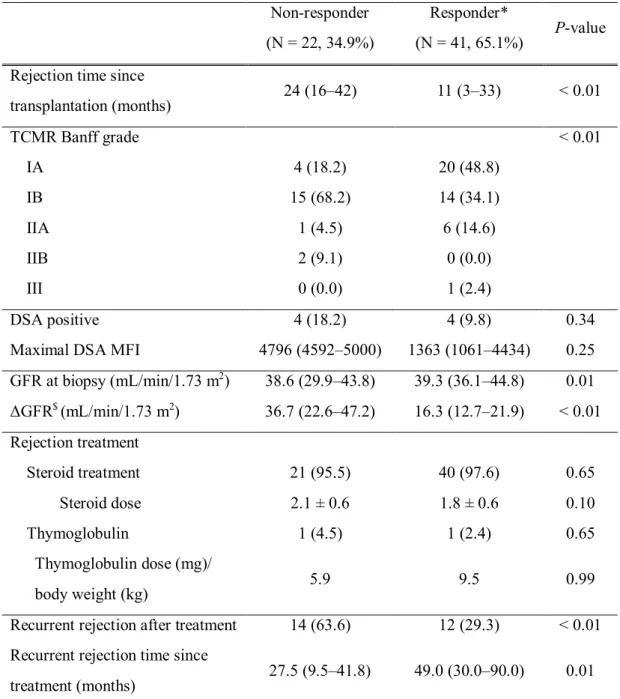
The clinical characteristics of the patients at the time of TCMR are shown in Table 2.
Rejection time since KT (median [IQR]) in non-responders and responders were 24 (16–42) and 11 (3–33) months, respectively (P <0.01). Of the non-responders, 19 (86%) had grade I acute TCMR and 3 (14%) had grade II acute TCMR; of the responders, 34 (83%), 6 (15%), and 1 (2%) patients had grade I, II, and III acute TCMR, respectively. GFR at biopsy was significantly higher in the responders (39.3 [36.1–44.8]) than in the non-responders (38.6 [29.9–43.8]; P = 0.01); the changes in GFR from baseline to the time of biopsy was significantly greater in the non-responders (36.7 [22.6–47.2]) than in the responders (16.3
5
[12.7–21.9]; P < 0.01). After rejection treatment, the GFR values in the non-responders remained lower than those in the responders (Figure 1).
The non-responders and responders did not show significant differences in the proportion of patients with positive DSA, maximal DSA median fluorescence intensity, steroid dose for pulse treatment, and the number of patients treated with ATG. The proportion of patients who showed any recurrent rejection following the first episode of acute TCMR was significantly higher in the non-responder group (64%) than in the responder group (29%; P
<0.01). The rejection time since treatment also shorter in the non-responders (27.5 months, IQR 9.5–41.8) than in the responders (49.0 months, IQR 30.0–90.0; P = 0.01). The cumulative incidence of recurrent rejection after the treatment also significantly higher in the non-responders (Figure 2).
The pathologic characteristics of the patients at the time of acute TCMR are shown in Table 3. The histological results showed that the proportion of patients with a tubulitis (t) score of 3 was significantly higher in the non-responder group (86%) than in the responder group (46%; P =0.01). The interstitial fibrosis/tubular atrophy (IF/TA) score was generally higher in the non-responders than in the responder group (P =0.01); whereas 23% and 46%
of the non-responder group had scores of 1 and 2, respectively, 59% of the responder group had a score of 1 and only 12% had a score of 2. Otherwise, the two groups did not show significant differences in the Banff scores.
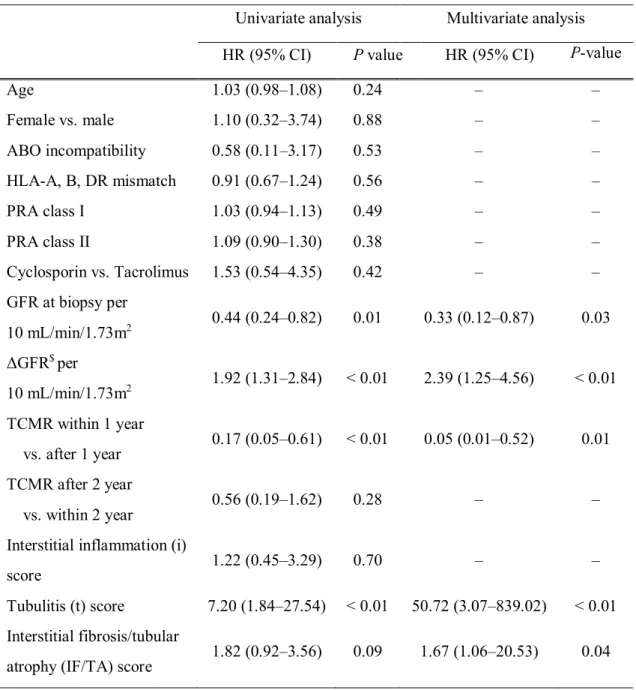
Risk factors associated with non-response and graft failure
After adjusting for possible confounders, the following variables were found to be significantly associated with non-response to rejection treatment: GFR at biopsy per 10 mL/min/1.73m2 (hazard ratio [HR] = 0.33; 95% confidence interval [CI], 0.12–0.87; P = 0.03), ΔGFR (baseline GFR – GFR at biopsy) per 10 mL/min/1.73m2 (HR = 2.39; 95% CI = 1.25–4.56; P <0.01), TCMR within 1 year vs. after 1 year (HR = 0.05; 95% CI = 0.01–0.52;
P =0.01), t score (HR = 50.72; CI = 3.07–839.02; P <0.01), and IF/TA score (HR = 1.67;
CI = 1.06–20.53; P =0.04) (Table 4). We also evaluated the risk factors for graft failure (Table 5), and found that non-responder vs. responder (HR = 3.31; 95% CI = 1.08–10.09; P
=0.04) and lower GFR at biopsy per 10 mL/min/1.73m2 (HR = 0.56; 95% CI = 0.34–0.93; P
=0.03) were independent risk factors in the multivariate analysis. The responder group
6
showed a significantly superior overall GS rate compared with the non-responder group (P <
0.01) (Figure 3).
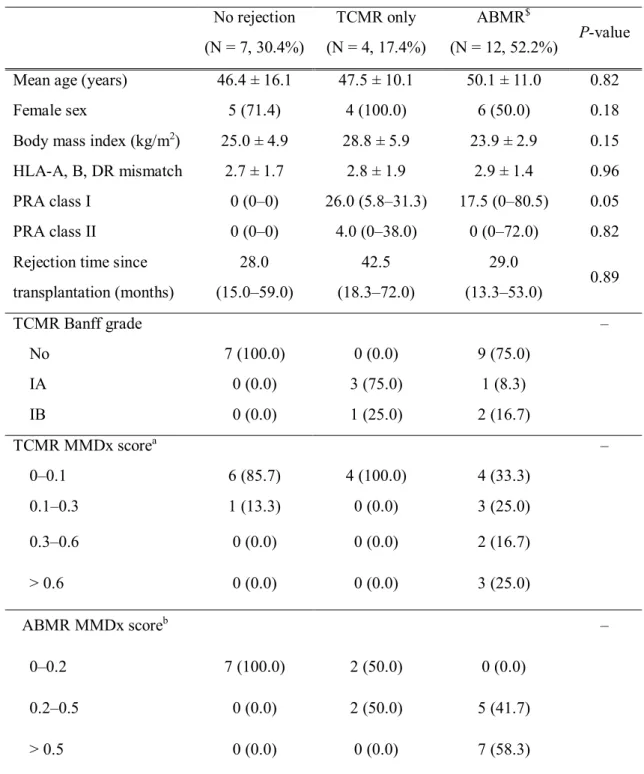
Patient demographics and MMDx results in molecular diagnosis group
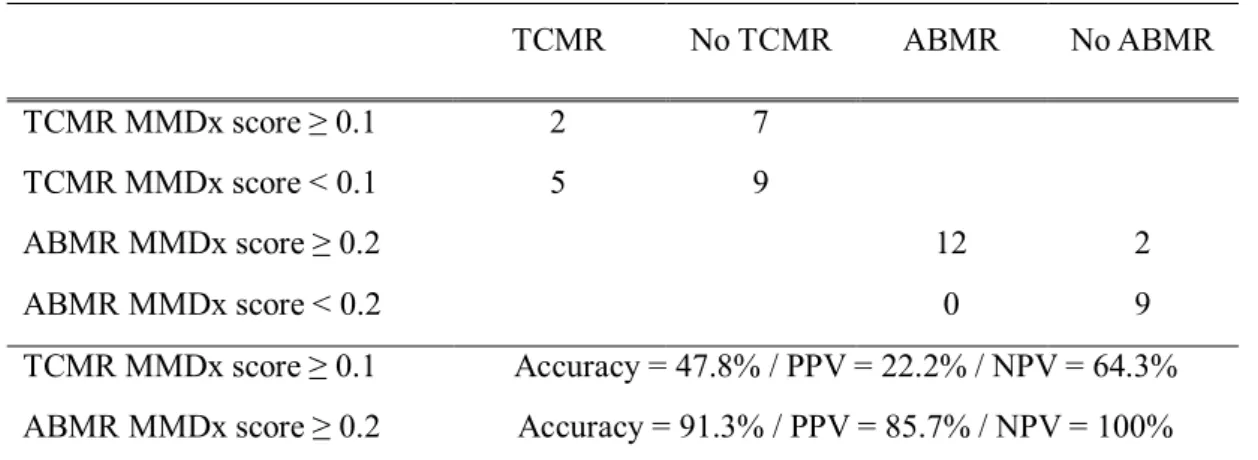
A total of 23 patients underwent molecular diagnosis and were divided into three groups according to the histological results as follows: 7 (30%) patients with no rejection, 4 (17%) patients with pure acute TCMR, and 12 (52%) patients showing ABMR with or without TCMR (Table 6). The 7 patients with no rejection in histology also showed no rejection in TCMR and ABMR MMDx scores, except for one patient with a TCMR score of 0.1–0.3. In contrast, all 4 patients with acute pure TCMR showed discordant results in the MMDx. All patients in the TCMR only group had TCMR MMDx scores of between 0 and 0.1. Two out of the four patients in the TCMR group had ABMR MMDx scores of 0.2–0.5. In the ABMR group, 5 (42%) patients had ABMR MMDx scores of 0.2–0.5 and 7 (58%) patients had ABMR MMDx scores of > 0.5.
The association between histologic diagnosis and the molecular diagnosis indicated that the AMBR MMDx score was consistent with the histologic ABMR (Figure 4). Molecular assessment using MMDx showed a good correlation with histologic diagnosis in ABMR (accuracy = 91.3% / positive predictive value [PPV] = 85.7% / negative predictive value [NPV] = 100%), but not in TCMR (accuracy = 47.8% / PPV = 22.2% / NPV = 64.3%) (Table 7).
Discussion
In this study involving 63 patients with pure acute TCMR, we found that solitary TCMR without proof of AMBR was a significant risk factor for graft failure in patients who did not respond to rejection treatment. Acute TCMRs that developed within one year after KT tended to respond well to steroid treatment, while those developing after one year following KT did not. By studying an additional 23 patients with microarray analysis, we found that the histologic diagnosis of acute ABMR was closely correlated with the molecular diagnosis.
However, all 4 cases of acute pure TCMR in histologic evaluation did not show any
evidence of TCMR in MMDx. Therefore, clinicians treating patients who develop acute pure
7
TCMR at one year after transplant in the pathological examination should consider the possibility of hidden ABMR or other causes of azotemia, especially when the patients are not responding well to steroid treatment.
As TCMR remains a significant clinical subject in the aspect of a bidirectional relationship with ABMR, the concept of chronic active TCMR was introduced.[7-9] One report showed that concurrent acute TCMR in recipients with biopsy-proven ABMR was an independent risk factor for graft loss.[9] Another study suggested that persistent TCMR induced graft interstitial inflammation and fibrosis, thus leading to allograft failure.[7] The 2017 Banff classification introduced the chronic active TCMR, which was defined as inflammation in the area of interstitial fibrosis and tubular atrophy with moderate or severe tubulitis.[8] In a study that reviewed 963 indication biopsy samples, chronic histological TCMR lesion within one year after KT was revealed as an independent risk factor of long- term GS.[17] Recently, Bouatou et al. reported the impact of pure acute TCMR according to the treatment response based on composite prognostic factors such as GFR, inflammation in the IF/TA area, and anti-HLA DSAs.[10] Although the definition of treatment response was not entirely consistent with that used in our current study, both studies reported similar results in terms of the risk factors of non-response, including time since KT and IF/TA. The advantage of our study is that the median time (39.0 months) from KT to rejection was longer than that in the above-mentioned study (39.0 vs. 3.5 months, respectively), which enabled us to analyze the clinical significance of acute pure TCMRs that are reported more than one year after transplant. Among 27 patients who occurred TCMR within one year after transplantation, only 4 (18%) did not respond to mPD pulse treatment. However, acute TCMR developing after one year following KT was an independent risk factor of non- response to rejection treatment.
Molecular assessment using a microarray of biopsies in KT is a feasible and accurate method for complementing histologic diagnosis.[15] Discrepancies between molecular and histological diagnosis in TCMR mainly develop in inflammatory conditions due to acute kidney injury, ambiguous isolated v-lesions, scarred tissues, and combined polyomavirus related lesions.[13, 18] ABMR may induce tubulointerstitial inflammation and thus mimic TCMR—however, this may be missed by the site-specific nature of histologic diagnosis.[19, 20] In three (n = 1 in the responder group and n = 2 in the non-responder group) cases of our
8
study who showed recurrence of AMBR within three months after initial TCMR, there was a possibility that the cause of TCMR was related to ABMR. The disagreement predominantly occurred in the biopsy samples that had been obtained either immediately post-operative or beyond one year post-operative.[20] Halloran group reported that while pure TCMR became rare overtime and disappeared by 10 years after transplant, ABMR continued to appear even decades after KT.[2] In our study, the four patients in the molecular diagnosis group who were diagnosed with pure TCMR had a median rejection time of 42.5 months and showed a low correlation with MMDx results. Considering that the results of the ABMR were highly consistent between histologic and molecular diagnosis, this disagreement in TCMR is not likely a result of an error during histological analysis. Among these four cases, one recovered from azotemia after steroid treatment; one case was expected to be related to a myocardial infarction that occurred a week after a biopsy, another case with TCMR IA lesion was presumed to be due to combined BK virus nephropathy, and the other case had a severe chronic change that hindered the diagnosis of acute rejection. Using treatment
response as an indicator of accurate diagnosis should be done with caution because clinicians try various ways to improve clinical outcomes such as immunosuppressant adjustment, hydration, and correction of other possible factors that can suppress the kidney function. In addition, T-cell reaction and B-cell reaction are not separate events, and steroid treatment can affect the kidney function through multiple mechanisms. [21, 22]
Our study showed that GFR decrement at the time of biopsy, t score, IF/TA score, and TCMR occurred one year after transplant were independent risk factors of non-response to rejection treatment. Late TCMR has been suggested as a predictor of low GS in previous studies.[23, 24] There are no definite criteria for distinguishing between early TCMR and late TCMR; however, in our study, TCMR developing at one year after KT was a significant risk factor for non-response while pure TCMR 2 years after transplant compared with two years after KT was not a significant risk factor. The Banff t lesion showed a 50.7 fold increase for the risk of non-response in our study, but the interstitial inflammation (i) score showed no significance in multivariate analysis. Nankivell et al. showed that interstitial inflammation by mononuclear cells is the initial event of cellular rejection that results in adverse histological and functional outcomes, and is thus a key diagnostic feature of TCMR.
However, the t-score replaced i score as a significant predictor of progressive fibrosis.[18]
9
Although Sellares et al. suggested that both i and t scores had no associations with long-term GS, another study showed that intimal arteritis (v) and t score were independent indicators of GS, which is similar to our study.[23, 24] The low GFR value at biopsy and large decrement of GFR from baseline were also independent predictors of non-response to rejection
treatment. We used GFR, a simply measurable value, as a single indicator for dividing the responders from the non-responders, and the cut-off value of 30% decrement from the baseline after rejection treatment was chosen as it was the point after which significant differences in GS were noted, and the recovery period of three months was determined in a previous study of Bouatou et al.[10] After rejection treatment, the leading causes of graft failure were recurrent rejection and kidney function deterioration without recovery except for three patients, in whom graft failure occurred due to subarachnoid hemorrhage, pneumonia, or lung cancer. CD4 T cells activation can act as effector cells for initiating humoral responses.[25] Among the 26 patients with recurrent rejection after treatment, five (23%) in the non-responder group and four (10%) in the responder group developed ABMR.
Uncontrolled acute pure TCMR seemed to induce recurrent rejection including ABMR.
Our study has several limitations. First, the number of patients included in this study was not large enough to obtain enough statistical power. However, considering the low incidence of acute pure TCMR, especially after a long time following transplant, the number of patients used in this study is quite large compared with those used in other recent studies. Second, we did not perform the histological diagnosis of i and t scores in IF/TA lesions because biopsy reviews were performed prior to 2017.[8] Our study focused on acute pure TCMR lesion rather than chronic changes. Third, considering that this study was a single-center study that solely included Asian patients, caution is needed when generalizing our results to patients with different genetic and medical circumstances that affect clinical outcomes. Lastly, patients in the molecular diagnosis group were not those included in the histologic analysis group, which led to difficulties in interpreting the results. Nevertheless, we presume that enough information about the possibility of misdiagnosis in acute pure TCMR at long-term after transplant was obtained through molecular diagnosis.
10
결
론
We report that pure acute TCMRs that do not respond to treatment was a significant risk factor of graft failure. Molecular analysis using MMDx showed that acute pure TCMR at one year after transplant in the histologic report should be interpreted
cautiously. Our results suggest that considering TCMR as a significant factor may be helpful in improving long-term GS in the era of ABMR. There is a need for planned strategies for monitoring and maintenance methods after rejection treatment.
11
참고문헌
1. Solez K, Axelsen RA, Benediktsson H, Burdick JF, Cohen AH, Colvin RB, Croker BP, Droz D, Dunnill MS, Halloran PFet al: International standardization of criteria for the histologic diagnosis of renal allograft rejection: the Banff working classification of kidney transplant pathology. Kidney Int 1993, 44(2):411-422.
2. Halloran PF, Chang J, Famulski K, Hidalgo LG, Salazar ID, Merino Lopez M, Matas A, Picton M, de Freitas D, Bromberg Jet al: Disappearance of T Cell- Mediated Rejection Despite Continued Antibody-Mediated Rejection in Late Kidney Transplant Recipients. J Am Soc Nephrol 2015, 26(7):1711-1720.
3. KDIGO clinical practice guideline for the care of kidney transplant recipients.
Am J Transplant 2009, 9 Suppl 3:S1-155.
4. Sellarés J, de Freitas DG, Mengel M, Reeve J, Einecke G, Sis B, Hidalgo LG, Famulski K, Matas A, Halloran PF: Understanding the causes of kidney transplant failure: the dominant role of antibody-mediated rejection and nonadherence. Am J Transplant 2012, 12(2):388-399.
5. Lamb KE, Lodhi S, Meier-Kriesche HU: Long-term renal allograft survival in the United States: a critical reappraisal. Am J Transplant 2011, 11(3):450-462.
6. Sexton DJ, O'Kelly P, Williams Y, Plant WD, Keogan M, Khalib K, Doyle B, Dorman A, Süsal C, Unterrainer Cet al: Progressive improvement in short-, medium- and long-term graft survival in kidney transplantation patients in Ireland - a retrospective study. Transpl Int 2019, 32(9):974-984.
7. Gago M, Cornell LD, Kremers WK, Stegall MD, Cosio FG: Kidney allograft inflammation and fibrosis, causes and consequences. Am J Transplant 2012, 12(5):1199-1207.
8. Haas M, Loupy A, Lefaucheur C, Roufosse C, Glotz D, Seron D, Nankivell BJ, Halloran PF, Colvin RB, Akalin Eet al: The Banff 2017 Kidney Meeting Report:
Revised diagnostic criteria for chronic active T cell-mediated rejection, antibody-mediated rejection, and prospects for integrative endpoints for next- generation clinical trials. Am J Transplant 2018, 18(2):293-307.
12
9. Matignon M, Muthukumar T, Seshan SV, Suthanthiran M, Hartono C: Concurrent acute cellular rejection is an independent risk factor for renal allograft failure in patients with C4d-positive antibody-mediated rejection. Transplantation 2012, 94(6):603-611.
10. Bouatou Y, Viglietti D, Pievani D, Louis K, Duong Van Huyen JP, Rabant M, Aubert O, Taupin JL, Glotz D, Legendre Cet al: Response to treatment and long- term outcomes in kidney transplant recipients with acute T cell-mediated rejection. Am J Transplant 2019, 19(7):1972-1988.
11. Mengel M, Sis B, Halloran PF: SWOT analysis of Banff: strengths, weaknesses, opportunities and threats of the international Banff consensus process and classification system for renal allograft pathology. Am J Transplant 2007, 7(10):2221-2226.
12. Furness PN, Taub N: International variation in the interpretation of renal transplant biopsies: report of the CERTPAP Project. Kidney Int 2001, 60(5):1998-2012.
13. Reeve J, Sellarés J, Mengel M, Sis B, Skene A, Hidalgo L, de Freitas DG, Famulski KS, Halloran PF: Molecular diagnosis of T cell-mediated rejection in human kidney transplant biopsies. Am J Transplant 2013, 13(3):645-655.
14. Loupy A, Haas M, Solez K, Racusen L, Glotz D, Seron D, Nankivell BJ, Colvin RB, Afrouzian M, Akalin Eet al: The Banff 2015 Kidney Meeting Report: Current Challenges in Rejection Classification and Prospects for Adopting Molecular Pathology. Am J Transplant 2017, 17(1):28-41.
15. Halloran PF, Reeve J, Akalin E, Aubert O, Bohmig GA, Brennan D, Bromberg J, Einecke G, Eskandary F, Gosset Cet al: Real Time Central Assessment of Kidney Transplant Indication Biopsies by Microarrays: The INTERCOMEX Study.
Am J Transplant 2017, 17(11):2851-2862.
16. Levey AS, Bosch JP, Lewis JB, Greene T, Rogers N, Roth D: A more accurate method to estimate glomerular filtration rate from serum creatinine: a new prediction equation. Modification of Diet in Renal Disease Study Group. Ann Intern Med 1999, 130(6):461-470.
13
17. Naesens M, Kuypers DR, De Vusser K, Vanrenterghem Y, Evenepoel P, Claes K, Bammens B, Meijers B, Lerut E: Chronic histological damage in early indication biopsies is an independent risk factor for late renal allograft failure. Am J Transplant 2013, 13(1):86-99.
18. Nankivell BJ, P'Ng CH, Shingde M, Viswanathan S, Achan A, Renthawa J, Sharma RN, Chapman JR: The Pathophysiology and Impact of Inflammation in
Nonscarred Renal Interstitium: The Banff i Lesion. Transplantation 2020, 104(4):835-846.
19. Berden AE, Jones RB, Erasmus DD, Walsh M, Noël LH, Ferrario F, Waldherr R, Bruijn JA, Jayne DR, Bajema IM: Tubular lesions predict renal outcome in antineutrophil cytoplasmic antibody-associated glomerulonephritis after rituximab therapy. J Am Soc Nephrol 2012, 23(2):313-321.
20. Halloran PF, Pereira AB, Chang J, Matas A, Picton M, De Freitas D, Bromberg J, Serón D, Sellarés J, Einecke Get al: Potential impact of microarray diagnosis of T cell-mediated rejection in kidney transplants: The INTERCOM study. Am J Transplant 2013,13(9):2352-2363.
21. Matsukuma Y, Masutani K, Tsuchimoto A, Okabe Y, Nakamura M, Kitazono T, Tsuruya K: Effect of steroid pulse therapy on post-transplant immunoglobulin A nephropathy. Nephrology (Carlton, Vic) 2018, 23 Suppl 2:10-16.
22. Sablik KA, Clahsen-van Groningen MC, Looman CWN, Damman J, van Agteren M, Betjes MGH: Treatment with intravenous immunoglobulins and
methylprednisolone may significantly decrease loss of renal function in chronic- active antibody-mediated rejection. BMC Nephrol 2019, 20(1):218.
23. Sellarés J, de Freitas DG, Mengel M, Sis B, Hidalgo LG, Matas AJ, Kaplan B, Halloran PF: Inflammation lesions in kidney transplant biopsies: association with survival is due to the underlying diseases. Am J Transplant 2011, 11(3):489- 499.
24. Wu K, Budde K, Lu H, Schmidt D, Liefeldt L, Glander P, Neumayer HH, Rudolph B: The severity of acute cellular rejection defined by Banff classification is associated with kidney allograft outcomes. Transplantation 2014, 97(11):1146- 1154.
14
25. Ali JM, Bolton EM, Bradley JA, Pettigrew GJ: Allorecognition pathways in transplant rejection and tolerance. Transplantation 2013, 96(8):681-688.
15
A b s t r a c t
Pure T-cell mediated rejection following kidney transplant according to response to treatment in the era of antibody-
mediated rejection
University of Ulsan Colleage of Medicine, the Doctor's course
H y u n w o o k , K w o n
Background:Over the last two decades, the focus of studies on graft survival (GS) after kidney transplantation (KT) has largely shifted from T-cell mediated rejection (TCMR) to antibody-mediated rejection (ABMR). However, there are still cases of pure acute TCMR in histological reports, even after a long time following transplant. We thus evaluated the impact of pure TCMR on GS according to treatment response. We also performed molecular diagnosis using a molecular microscope diagnostic system (MMDx) to determine the
accuracy of the histologic diagnosis of pure TCMR.
Methods:A total of 63 patients were included in our study and divided into non-responders (N = 22) and responders (N = 44) according to their response to rejection treatment.
Molecular diagnosis and histologic diagnosis were conducted simultaneously on a separate group of 23 patients.
Results:The non-responders had a significantly longer duration between treatment and recurrent rejection than did the responders (24 vs. 11 months; P< 0.01). The cumulative incidence of recurrent rejection after treatment was significantly higher in the non- responders as well (64% vs. 29%; P< 0.01). Non-response to rejection treatment was significantly associated with the following factors: GFR at biopsy, ΔGFR (baseline GFR – GFR at biopsy), TCMR within one year, t score, and IF/TA score. We also found that non- responder vs. responder (HR = 3.31; P =0.04) and lower GFR at biopsy per 10
mL/min/1.73m2 (HR = 0.56; P =0.03) were independent risk factors of graft failure. The responders had a significantly superior overall GS rate compared with the non-responders (P
< 0.01). Molecular assessment using MMDx showed a good correlation with histologic diagnosis in ABMR, but not in TCMR.
16
Conclusions:Solitary TCMR was a significant risk factor of graft failure in patients who did not respond to rejection treatment. Molecular assessment using MMDx did not show a good correlation with histologic diagnosis in TCMR, suggesting that acute pure TCMR at one year after transplant in histologic reports should be interpreted with caution.
Keywords:Kidney transplantation, graft rejection; T cell mediated, graft survival
17
Table 1. Baseline and clinical characteristics of the study patients Non-responders
(N = 22, 35%)
Responders*
(N = 41, 65%) P-value
Age (years) 48.8 ± 12.3 45.0 ± 12.4 0.24
Female sex 5 (22.7) 10 (24.4) 0.99
Diabetes mellitus 9 (40.9) 9 (22.0) 0.15
Body mass index (kg/m2) 23.6 ± 3.8 23.0 ± 3.5 0.49
ABO incompatible 2 (9.1) 6 (14.6) 0.70
HLA-A, B, DR mismatch 3.3 ± 1.5 3.5 ± 1.8 0.56
0% ≤ PRA class I < 20% 22 (100.0) 39 (95.1) 0.99
20% ≤ PRA class I ≤ 100% 0 (0.0) 2 (4.8)
0% ≤ PRA class II < 20% 22 (100.0) 38 (92.7) 0.70
20% ≤ PRA class II ≤ 100% 0 (0.0) 3 (7.3)
Pre-transplant DSA positive 0 (0.0) 1 (2.4) 0.46
Calcineurin inhibitor 0.44
Tacrolimus 10 (45.5) 23 (56.1)
Cyclosporin 12 (54.5) 18 (43.9)
Duration of dialysis (months) 26.3 ± 27.0 26.1 ± 48.3 0.98 Baseline GFR (mL/min/1.73 m2) 83.8 (65.8–93.3) 60.3 (51.3–66.7) 0.03 GFR at biopsy (mL/min/1.73 m2) 38.6 (29.9–43.8) 39.3 (36.1–44.9) 0.01 Rejection within 1 year after
transplantation 4 (18.2) 23 (56.1) < 0.01
Continuous data are presented as mean ± standard deviation, categorical data are presented as number (%), and non-normally distributed data are presented as median (interquartile range).
*Responders: patients whose serum glomerular filtration rate decreased by less than 30%
from baseline value at three months after rejection treatment
Abbreviation: PRA, panel reactive antibody; TCMR, T-cell mediated rejection; DSA, donor- specific antibody; GFR, glomerular filtration rate
18
Table 2. Clinical characteristics at the time of acute T cell-mediated rejection Non-responder
(N = 22, 34.9%)
Responder*
(N = 41, 65.1%) P-value Rejection time since
transplantation (months) 24 (16–42) 11 (3–33) < 0.01
TCMR Banff grade < 0.01
IA 4 (18.2) 20 (48.8)
IB 15 (68.2) 14 (34.1)
IIA 1 (4.5) 6 (14.6)
IIB 2 (9.1) 0 (0.0)
III 0 (0.0) 1 (2.4)
DSA positive 4 (18.2) 4 (9.8) 0.34
Maximal DSA MFI 4796 (4592–5000) 1363 (1061–4434) 0.25
GFR at biopsy (mL/min/1.73 m2) 38.6 (29.9–43.8) 39.3 (36.1–44.8) 0.01 ΔGFR$ (mL/min/1.73 m2) 36.7 (22.6–47.2) 16.3 (12.7–21.9) < 0.01 Rejection treatment
Steroid treatment 21 (95.5) 40 (97.6) 0.65
Steroid dose 2.1 ± 0.6 1.8 ± 0.6 0.10
Thymoglobulin 1 (4.5) 1 (2.4) 0.65
Thymoglobulin dose (mg)/
body weight (kg) 5.9 9.5 0.99
Recurrent rejection after treatment 14 (63.6) 12 (29.3) < 0.01 Recurrent rejection time since
treatment (months) 27.5 (9.5–41.8) 49.0 (30.0–90.0) 0.01 Continuous data are presented as mean ± standard deviation, categorical data are presented as number (%), and non-normally distributed data are presented as median (interquartile range).
*Responders: patients whose serum glomerular filtration rate decreased by less than 30%
from baseline value at three months after rejection treatment
$ΔGFR: baseline GFR – GFR at biopsy
19
Abbreviation: TCMR, T-cell mediated rejection; DSA, donor-specific antibody; MFI,mean fluorescence intensity; GFR, glomerular filtration rate
20
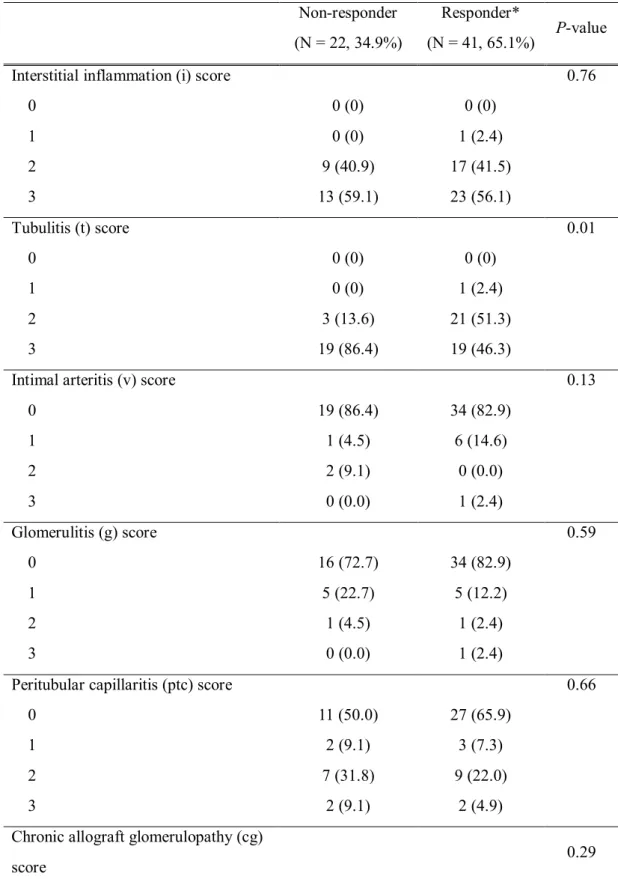
Table 3. Pathologic characteristics at the time of acute T cell-mediated rejection Non-responder
(N = 22, 34.9%)
Responder*
(N = 41, 65.1%) P-value
Interstitial inflammation (i) score 0.76
0 0 (0) 0 (0)
1 0 (0) 1 (2.4)
2 9 (40.9) 17 (41.5)
3 13 (59.1) 23 (56.1)
Tubulitis (t) score 0.01
0 0 (0) 0 (0)
1 0 (0) 1 (2.4)
2 3 (13.6) 21 (51.3)
3 19 (86.4) 19 (46.3)
Intimal arteritis (v) score 0.13
0 19 (86.4) 34 (82.9)
1 1 (4.5) 6 (14.6)
2 2 (9.1) 0 (0.0)
3 0 (0.0) 1 (2.4)
Glomerulitis (g) score 0.59
0 16 (72.7) 34 (82.9)
1 5 (22.7) 5 (12.2)
2 1 (4.5) 1 (2.4)
3 0 (0.0) 1 (2.4)
Peritubular capillaritis (ptc) score 0.66
0 11 (50.0) 27 (65.9)
1 2 (9.1) 3 (7.3)
2 7 (31.8) 9 (22.0)
3 2 (9.1) 2 (4.9)
Chronic allograft glomerulopathy (cg)
score 0.29
0 22 (100.0) 39 (95.1)
21
1 0 (0.0) 2 (4.9)
2 0 (0.0) 0 (0.0)
3 0 (0.0) 0 (0.0)
Interstitial fibrosis/tubular atrophy
(IF/TA) score 0.01
0 6 (27.3) 11 (26.9)
1 5 (22.7) 24 (58.5)
2 10 (45.5) 5 (12.2)
3 1 (4.5) 1 (2.4)
Arteriosclerosis (cv) score 0.76
0 8 (36.4) 15 (36.6)
1 12 (54.5) 20 (48.7)
2 2 (9.1) 4 (9.8)
3 0 (0.0) 2 (4.9)
Arteriolar hyalinosis (ah) score 0.44
0 7 (31.9) 19 (46.3)
1 9 (40.9) 8 (19.5)
2 5 (22.7) 13 (31.8)
3 1 (4.5) 1 (2.4)
Values are number (%).
*Responders: patients whose serum glomerular filtration rate decreased by less than 30%
from baseline value at three months after rejection treatment
22
Table 4. Risk factors associated with non-response to rejection treatment
Univariate analysis Multivariate analysis HR (95% CI) Pvalue HR (95% CI) P-value
Age 1.03 (0.98–1.08) 0.24 – –
Female vs. male 1.10 (0.32–3.74) 0.88 – –
ABO incompatibility 0.58 (0.11–3.17) 0.53 – –
HLA-A, B, DR mismatch 0.91 (0.67–1.24) 0.56 – –
PRA class I 1.03 (0.94–1.13) 0.49 – –
PRA class II 1.09 (0.90–1.30) 0.38 – –
Cyclosporin vs. Tacrolimus 1.53 (0.54–4.35) 0.42 – –
GFR at biopsy per
10 mL/min/1.73m2 0.44 (0.24–0.82) 0.01 0.33 (0.12–0.87) 0.03 ΔGFR$ per
10 mL/min/1.73m2 1.92 (1.31–2.84) < 0.01 2.39 (1.25–4.56) < 0.01 TCMR within 1 year
vs. after 1 year 0.17 (0.05–0.61) < 0.01 0.05 (0.01–0.52) 0.01 TCMR after 2 year
vs. within 2 year 0.56 (0.19–1.62) 0.28 – –
Interstitial inflammation (i)
score 1.22 (0.45–3.29) 0.70 – –
Tubulitis (t) score 7.20 (1.84–27.54) < 0.01 50.72 (3.07–839.02) < 0.01 Interstitial fibrosis/tubular
atrophy (IF/TA) score 1.82 (0.92–3.56) 0.09 1.67 (1.06–20.53) 0.04
*Responders: patients whose serum glomerular filtration rate decreased by less than 30%
from baseline value at three months after rejection treatment
$ΔGFR: baseline GFR – GFR at biopsy
Abbreviation: PRA, panel reactive antibody; GFR, glomerular filtration rate;TCMR, T-cell mediated rejection
23 Table 5. Risk factors associated with graft failure
Univariate analysis Multivariate analysis HR (95% CI) P-value HR (95% CI) P-value Non-responder vs. responder* 4.45 (1.51–13.12) < 0.01 3.31 (1.08–10.09) 0.04 GFR at biopsy per
10 mL/min/1.73m2 0.49 (0.30–0.79) < 0.01 0.56 (0.34–0.93) 0.03 ΔGFR$ per
10 mL/min/1.73m2 1.16 (0.89–1.49) 0.27 – –
TCMR within 1 year
vs. after 1 year 0.48 (0.17–1.40) 0.18 – –
TCMR after 2 year
vs. within 2 year 0.59 (0.19–1.80) 0.35 – –
Interstitial inflammation (i)
score 0.85 (0.31–2.32) 0.76 – –
Tubulitis (t) score 1.95 (0.63–6.01) 0.25 – –
Interstitial fibrosis/tubular
atrophy (IF/TA) score 0.93 (0.48–1.82) 0.84 – –
*Responders: patients whose serum glomerular filtration rate decreased by less than 30%
from baseline value at three months after rejection treatment
$ΔGFR: baseline GFR – GFR at biopsy
Abbreviation: PRA, panel reactive antibody; GFR, glomerular filtration rate;TCMR, T-cell mediated rejection
24
Table 6. Baseline and clinical characteristics of the patients in the molecular diagnosis group No rejection
(N = 7, 30.4%)
TCMR only (N = 4, 17.4%)
ABMR$
(N = 12, 52.2%) P-value
Mean age (years) 46.4 ± 16.1 47.5 ± 10.1 50.1 ± 11.0 0.82
Female sex 5 (71.4) 4 (100.0) 6 (50.0) 0.18
Body mass index (kg/m2) 25.0 ± 4.9 28.8 ± 5.9 23.9 ± 2.9 0.15
HLA-A, B, DR mismatch 2.7 ± 1.7 2.8 ± 1.9 2.9 ± 1.4 0.96
PRA class I 0 (0–0) 26.0 (5.8–31.3) 17.5 (0–80.5) 0.05
PRA class II 0 (0–0) 4.0 (0–38.0) 0 (0–72.0) 0.82
Rejection time since transplantation (months)
28.0 (15.0–59.0)
42.5 (18.3–72.0)
29.0
(13.3–53.0) 0.89
TCMR Banff grade –
No 7 (100.0) 0 (0.0) 9 (75.0)
IA 0 (0.0) 3 (75.0) 1 (8.3)
IB 0 (0.0) 1 (25.0) 2 (16.7)
TCMR MMDx scorea –
0–0.1 6 (85.7) 4 (100.0) 4 (33.3)
0.1–0.3 1 (13.3) 0 (0.0) 3 (25.0)
0.3–0.6 0 (0.0) 0 (0.0) 2 (16.7)
> 0.6 0 (0.0) 0 (0.0) 3 (25.0)
ABMR MMDx scoreb –
0–0.2 7 (100.0) 2 (50.0) 0 (0.0)
0.2–0.5 0 (0.0) 2 (50.0) 5 (41.7)
> 0.5 0 (0.0) 0 (0.0) 7 (58.3)
Continuous data are presented as mean ± standard deviation, categorical data are presented as number (%), and non-normally distributed data are presented as median (interquartile range).
$ABMR: Antibody-mediated rejection with/without TCMR
25
aTCMR MMDx score was classified as normal, mild, moderate, and severe using the cut off of 0.1,0.3, and 0.6, respectively
bABMR MMDx score was classified as normal, mild, and severe using the cut off of 0.2 and 0.5, respectively
Abbreviation: PRA, panel reactive antibody; TCMR, T-cell mediated rejection; ABMR, Antibody-mediated rejection; MMDx, molecular microscope diagnostic system
26
Table 7. Agreement of histologic diagnosis with molecular diagnosis
TCMR No TCMR ABMR No ABMR
TCMR MMDx score ≥ 0.1 2 7
TCMR MMDx score < 0.1 5 9
ABMR MMDx score ≥ 0.2 12 2
ABMR MMDx score < 0.2 0 9
TCMR MMDx score ≥ 0.1 Accuracy = 47.8% / PPV = 22.2% / NPV = 64.3%
ABMR MMDx score ≥ 0.2 Accuracy = 91.3% / PPV = 85.7% / NPV = 100%
Abbreviation: TCMR, T-cell mediated rejection; ABMR, antibody-mediated rejection;
MMDx, molecular microscope diagnostic system; PPV, positive predictive value; NPV, negative predictive value
27
Figure 1. Changes in the estimated glomerular filtration rates
28
Figure 2. Cumulative incidence of recurrent rejection after rejection treatment
29
Figure 3. Overall graft survival rate after rejection treatment
30