Although recent research proposes adversarial learning methods to improve the generalization of the predictive model, utilizing the correlated effects of multiple datasets still remains an open problem. Our new methods outperform the previous state-of-the-art method with an average improvement of 1.66% in accuracy. Stock price predictions and analysis determine the value of collaboration and various financial instruments.
Understanding the broad stock market is an important part of both the global economy and the growth of the industry as a whole. However, it is considered one of the most difficult issues, because the characteristics of stock prices and indices are noisy and non-stationary. First, they cannot capture the nonlinear nature of the stock price because they assume a model structure with a linear form.
Recently, neural networks have been shown to be adept at predicting future stock price.
Statement of the problem
Aim of Research
Organization of This thesis
Related Work
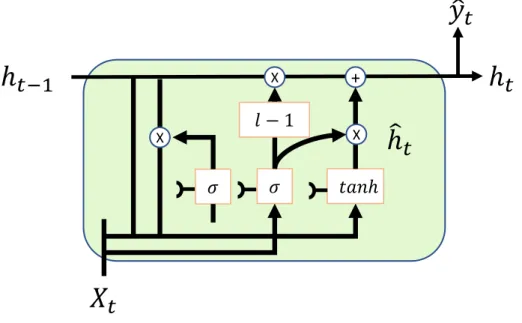
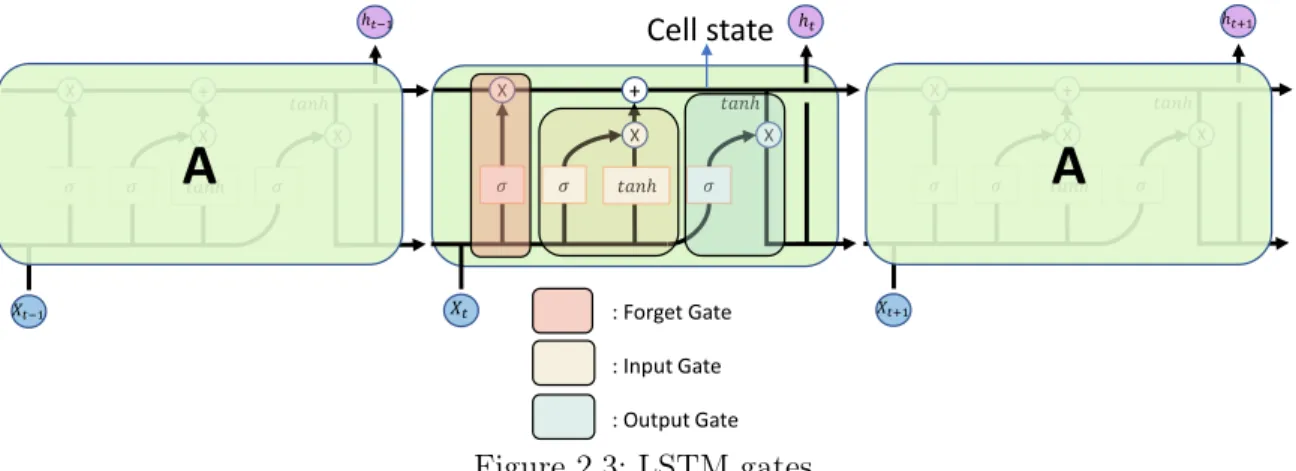
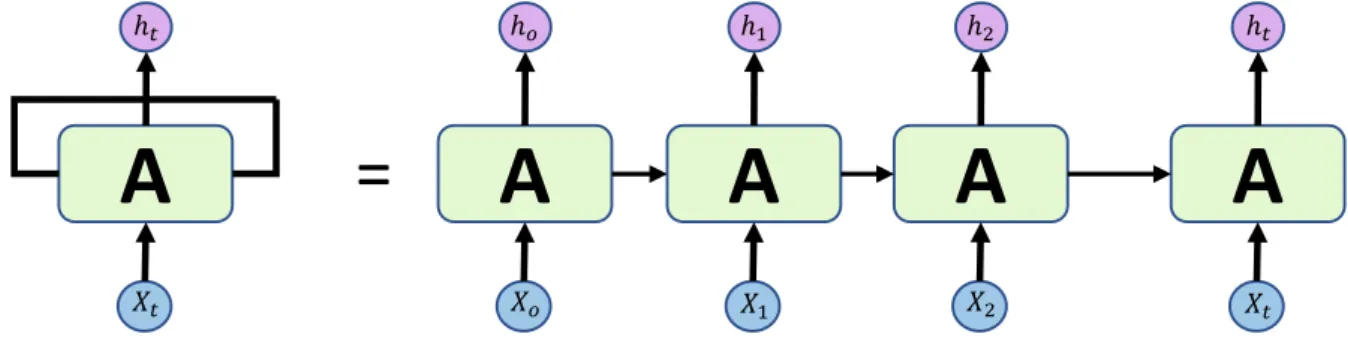
This recurrent neural network, when expanded, can be thought of as copies of the same network passing information to the next state. RNN is recurrent in nature because it performs the same function for each data input, while the output of the current input depends on the previous computation. And the tanh function gives weight to the values being passed and determines their importance level, ranging from -1 to 1.
Output gate means that the input and memory of the block are used to determine the output. Therefore, the cell state gradient and the hidden state gradient are affected by the gradient value of the previous point. To measure association strength independently, the covariance must be normalized against the variance of the measurement variables.
The correlation between the two variables reflects the degree to which the variables are related. A correlation of -1 indicates that there is a completely negative linear relationship between the variables, and 0 indicates no correlation. Neuronjis said to Granger causality neuron, whose inclusion of SiinII.3 reduces the variance of the prediction error.
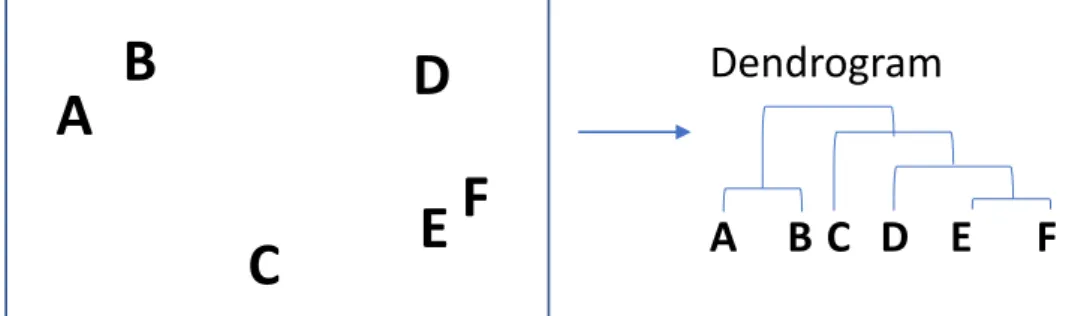
A user specifies the two series, x and y, along with the significance level and the maximum number of lags to consider. Then HC calculates the similarity (eg distance) between each cluster and joins the two most similar clusters. Then, it iteratively performs the following two steps: (1) identify the two clusters that are closest to each other, and (2) merge the two most similar clusters.
Background
The main contributions of the proposed method are the study of population prediction generalization problems. They adapt that Adversarial Perturbation (AP) is the direction that leads to LSTMs with an attention method to increase the performance of stock forecasts and the biggest changes in the model prediction. Adversarial training is proposed to take into account the stochastic property of stock market to learn stock movement prediction model.
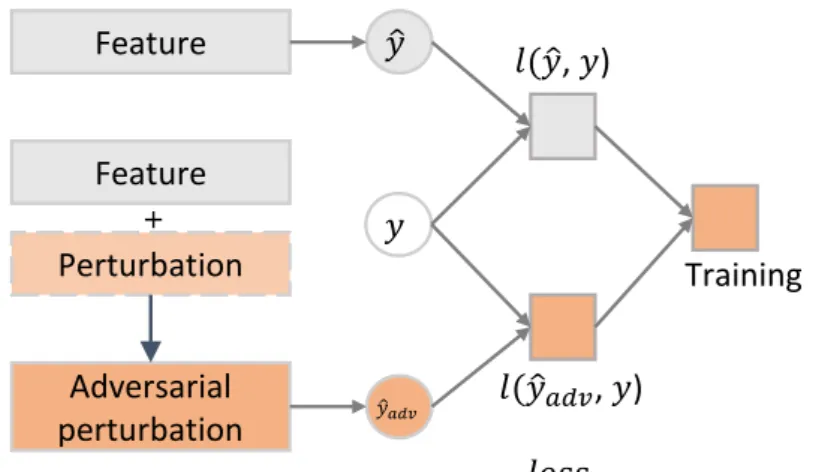
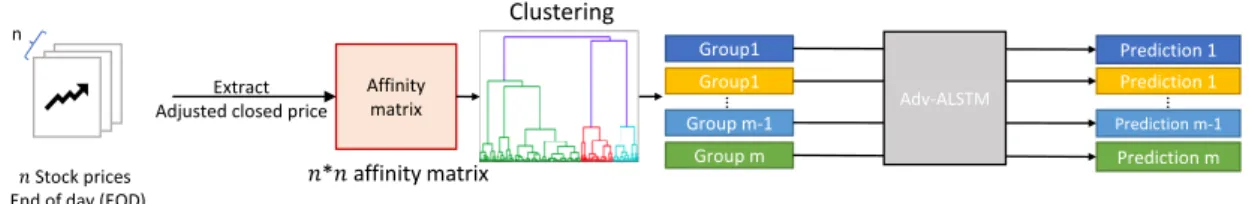
When the proposed method adds perturbations to the prediction features in the last hidden layer, it is possible to optimize the perturbations to make them draw a decision boundary from the model output as much as possible. Before we explore the Adv-ALSTM methods, they define the predictive function to set the stock movement prediction formula to asyˆs=f(Xs;Θ), which maps a stock(s) from its temporal characteristics ( Xs) to the label space. . In other words, the functionf with parametersΘ aims to predict the movement of stocks in the next time step based on the successive featuresXs in the lastT time steps.
Xs= [xs1,· · ·,xsT]∈RD×T is a matrix representing successive input features (e.g. opening and closing prices as detailed in Table 2.1) over a lag of past T time steps, where the feature dimension is . Output: prediction function f(Xs;Θ) , which predicts the movement of stock s in the next time step. Instead of directly making a prediction from the last hidden layer in LSTM, they adapted adversarial examples (AE).
AE is a malicious entry created by adding intentional disturbances to the clean data function. The perturbation called AP (Adversarial Perturbation) cannot be directly applied to stock forecasts in the direction that brings about the biggest change in. Also, given the fact that the input gradients depend on different time steps, there may be unintended interactions between perturbations of different time steps that cannot be controlled.
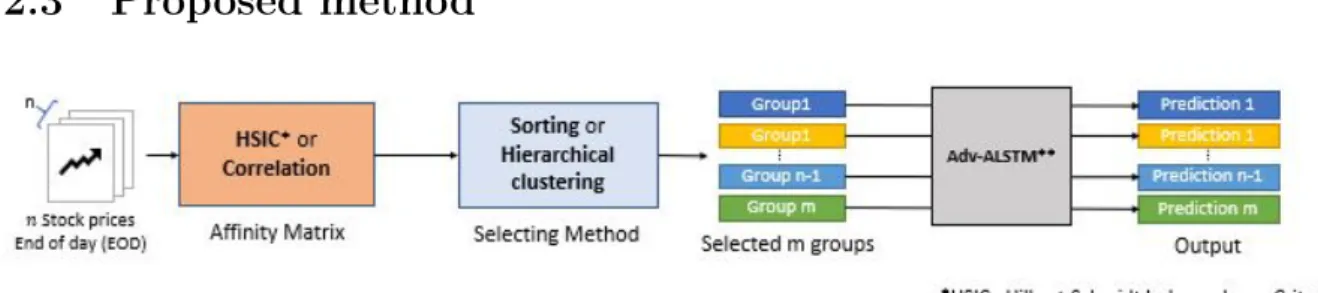
Proposed method
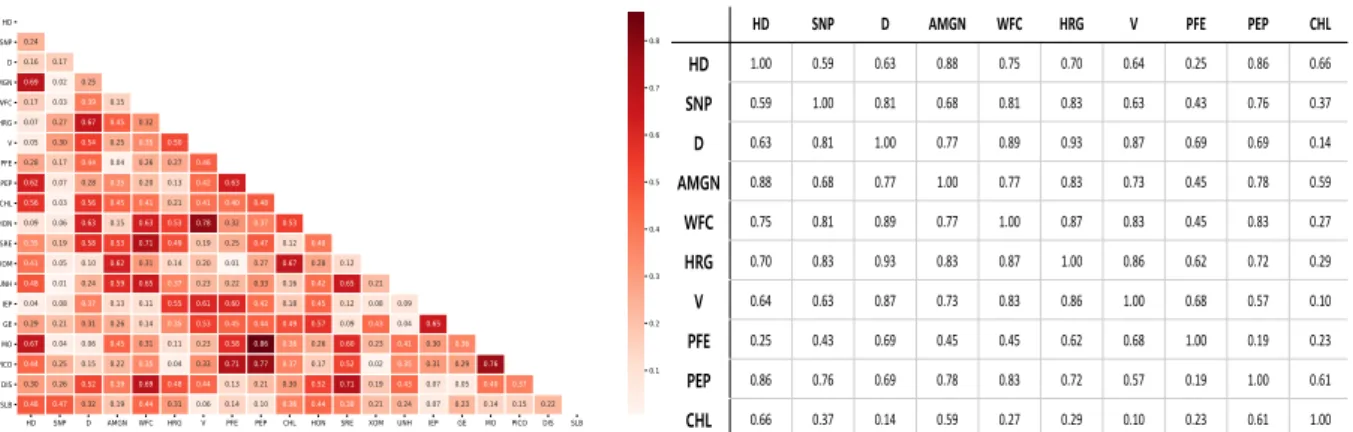
Perturbation calculations can be time-consuming because they rely on the calculation of input gradients (due to backpropagation through the LSTM layer time step). We also compare and plot graphs to check whether the correlation matrix classifies the relationships of each stock trend. Also, many studies show that both the consumer goods and healthcare sectors (especially the pharmaceutical sector) are highly correlated [38].
However, HD (Home Depot) and PCLN (Booking Holding) belong to the same industry, so they are less likely to make similar moves. First, industries that produce the same stocks tend to form groups because they are competitors and are influenced by the same stock market environment. This is because the current classification of industries is not perfect and is still in the research phase [39].
We can easily understand how each share has relationships. 2.13 shows how well HC grouped. See fig.2.12 to match colors in this table index between different stocks in the financial market has been mentioned. This multivariate analysis method is designed to extract information about the number of key factors that characterize the dynamics of the investigated system and the composition of groups in which the market is essentially organized.
It is considered to be the true price of the stock in question and is often used when examining historical returns or performing a detailed analysis of historical returns. This method also outperforms the Adv-ALSTM model at HSIC matrix selected top 40 highly correlated neighbors. Note that each stock has its weight and share the weight parameters in the same group.
Experiments
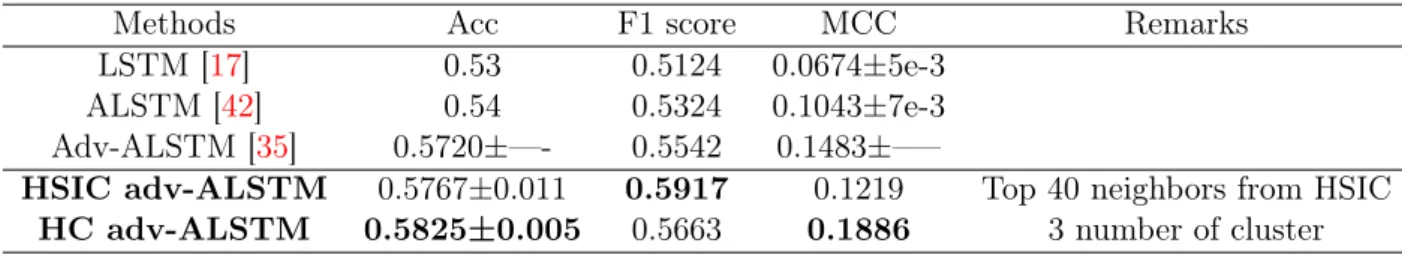
The first term is a hinge loss, which is widely used for the optimization of classification models (more reasons for choosing it are further explained at the end of the section). However, we know that simple hinge loss leads convergence and performance than suggested by baseline loss function with several experiments. These methods are used as a statistical measure of how well a binary classification test correctly identifies.
Accuracy is the number of data points correctly predicted from all data points. A true positive or true negative is a data point that the algorithm correctly classifies as true or false, respectively. It takes into account the precision p and the recall r of the test to calculate the score: p is the number of correct positives divided by the number of all positives returned by the classifier and d is the number of correct positives divided by the number of all samples relevant.
MCC takes into account true and false positives and negatives and is generally considered a balanced measure that can be used even if the classes are of very different sizes.[3] The MCC is essentially a correlation coefficient between the observed and predicted binary classifications; it returns a value between 1 and +1.
Results
Although most of the stocks are same industry, DHR (Danaher), HON (Honeywell) are not same industry. If the model predicts that the price of the stock will rise the next step, the virtual trader will take a long position, vice versa. All strategic returns in this section are calculated as transaction costs and slippage, and in the real world we can focus on the predictive power of the model itself.
Cumulative return is the total amount the investment has gained or lost over time, regardless of the period involved. The accuracy of models can only measure the ability of classification-based predictions, which correspond to the margins of future returns, while what actually matters in market practice is profitability, which is correlated with the rate of increase or decrease. For example, the profit made. by two correctly predicted samples can be absorbed by loss caused by one incorrectly predicted sample, if the actual magnitude of the increase or decrease in the future of the incorrectly predicted sample is sufficiently large. Finally, from the perspective of the predictive direction of stock price, it will be worthwhile to adopt the representative characteristic to make classification in the future.
LITERATURE [8] Lazar Dorina and Ureche Simina, "Testing the efficiency of the stock market in emerging economies," Journal of the Faculty of Economics - Collection of Economic Sciences, vol. 9] Adebiyi A Ariyo, Adewumi O Adewumi and Charles K Ayo, “Stock price forecasting using arima model”, in 2014 UKSim-AMSS 16th International Conference on Computational Modeling and Simulation. A Case Study of the Chinese Stock Exchange,” in 2015 IEEE International Conference on Big Data.
25] Mohammad Mekayel Anik, Mohammad Shamsul Arefin and M Ali Akber Dewan, “An Intelligent Technique for Stock Market Forecasting”, in Proceedings of the International Joint Conference on Computational Intelligence. 29] Xiao Ding, Yue Zhang, Ting Liu, and Junwen Duan, “Deep learning for event-driven stock prediction,” in Twenty-Fourth International Joint Conference on Artificial Intelligence, 2015. 33] Arthur Gretton, Olivier Bousquet, Alex Smola, and Bernhard Schölkopf , “Measuring statistical dependence with Hilbert-Schmidt norms,” in International Conference on Algorithmic Learning Theory.
40] Yumo Xu and Shay B Cohen, “Prediction of stock movements based on tweets and historical prices,” in Proceedings of the 56th Annual Meeting of the Association for Computational Linguistics (Volume 1: Long Papers), 2018, p. 41] David MQ Nelson , Adriano CM Pereira and Renato A de Oliveira, “Prediction of Stock Market Price Movements with lstm Neural Networks”, 2017 International Joint Conference on Neural Networks (IJCNN).