This English translation is an abridged and edited version of KINU Research Paper, North Korea's Official Markets in 2022, Min Hong et al. The analyses, commentary and opinions presented in this article are those of the authors and do not necessarily represent the views from the Korea Institute for National Unification.
Survey Overview
Local Distribution of Official Markets in North Korea
Total Number of Official Markets
④ Seven markets that existed in 2016 but were not identified in the previous survey were included in this survey: Jikyeong Market in Rason Special City, Banggjin Market and Raksan Market in Chongjin City, and Farmers Market in Orang City of Hamgyong Province. North, Pyengseongdong Market in Pyeongseong City of South Pyongan Province, Myungdang Market in Sangwon County of North Hwanghae Province, and Goam Market in Muncheon City of Gangwon Province.
Changes in Official Markets
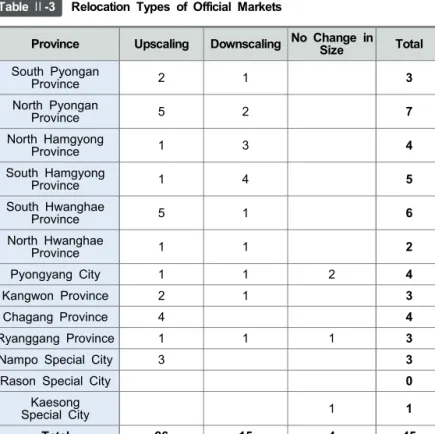
Local Distribution of Official Markets in North Korea 9 TableⅡ-2 Total Figures and Changes in Official Markets by Province i However, the five markets located in Kaesong City at the time were separated for convenience when calculating the statistics for Kaesong Special City in 2022. Relocation includes both upscaling relocation and downscaling relocation, which are also counted in the figures for expansion and decline.
The number of shifts was 45: 26 were scaling up shifts; 15 were scaling down shifts; and 4 had no change in size. Mostly, upscaling shifts occurred as the number of upscaling shifts doubles the number of downscaling shifts. Among the 38 upscaling moves, 12 increased its size in the same place while 26 relocated, indicating that when expanding the market size, the number of upscaling moves was more than twice that of upscaling without shifting.
Distribution of Official Markets by Province
Compared to the 2016 survey, there were no changes in the cities. rankings for their number of markets, with North Hwanghae Province adding four markets, South Pyongan Province adding three markets, Chagang Province adding three markets, and Pyongyang City and Kangwon Province adding one market each. As in the 2016 survey, South Pyongan easily surpassed the other regions in terms of number of markets. If Pyongyang Municipality and Nampo Special City are included in South Pyongan Province, the province has 120 official markets, accounting for 29% of the total number of markets.
Geographically, South Pjeongan and North Hwanghae alone saw an increase in the number of markets by 7. There are a total of 158 markets7) located in Pyongyang City, Nampo Special City and Kaesong Special City, in addition to South Pyeongan and North Hwanghae, accounting for 38% of all markets. Markets remained concentrated on transport routes for goods in North Pyongan (Sinuiju-Dandong), South Pyongan, Pyongyang,. 7) Pyongyang City, Nampo Special City and Kaesong Special City are included.
The top five provinces in terms of number of markets (South Pyongan, North Pyongan, South Hamgyong, North Hamgyong and North Hwanghae) each had three to five cities. Since the location of official markets was determined based on data on administrative divisions with the aim of greater convenience for residents, constant correlations were found between the number of administrative units and the number of regional markets. The top five provinces by population were also the top five by market numbers.
The most populous region was South Pyongyang, followed by Pyongyang, South Hamgyong, North Pyongyang, North Hamgyong, and North Hwanghae, in that order according to the 2008 North Korean population census.8 ). The top five regions in terms of population had a large population of factory workers and corporate employees, forming a significant number of the population engaged in market activities. Reasons for the distribution of the market concentrated in the West include the initial development of traffic lines on the East and West axes established under Japanese colonial rule; the construction of roads for the movement of goods from China along the traffic lines to the East and West; and the movement of goods at major ports along the east and west coasts.
Population and Number of Markets
There were 56,265 people per market when the total population was divided by the total number of markets, 415 (the unidentified number) according to the 2008 North Korean census, which was the basis for the 2016 survey. When we compare 2016 and 2022 with this Comparing calculations, an arithmetic estimate shows that each market will serve 5,566 additional people in 2022. However, since the 2016 study was based on 2008 census statistics, which do not reflect population growth over the eight years, the number of people covered by one market increased by approximately 2,000.
Overall, the population increased by about 2.24 million people between the two periods, but the number of markets decreased by one. Although the number of markets did not increase quantitatively in proportion to the increase in population, it can be interpreted that each market was able to accommodate the increased population by expanding its capacity. Meanwhile, the diversification of consumption and distribution methods outside of formal general markets may have eased the pressure on the need to increase the number of markets.
Distribution of Official Markets by City
Estimated Size of Official Markets and Total Stall
Estimated Market Size
The largest market was Sunam Market (30,887㎡) in Chongjin City and the smallest one was Pangjin Market (100㎡) in Chongjin City. If the gross floor areas of the recently introduced multi-floor markets were counted, the figure might have grown. However, this survey used the plot area for comparison to better understand the spatial size.
Total Estimated Number of Stalls
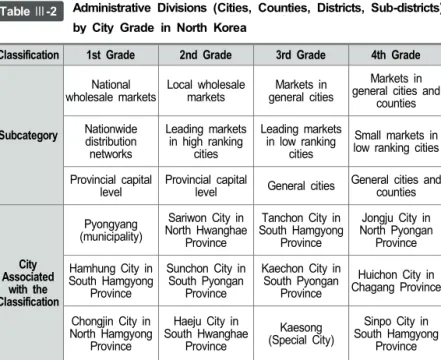
② The number of markets was counted for 173 units (cities, provinces, districts, sub-districts) and provinces. ⑤ The 173 administrative divisions were categorized into four grades and the average size of stalls belonging to each grade was determined. Focus on the Status of the Official Market (Seoul: Korea Institute for National Unification, 2016), pp. 29-30.
The total market size of cities associated with a grade was divided by the average stall size of the grade to calculate the total number of stalls.17). Total daily market rental fee per market was also calculated based on the total number of stalls obtained by the method above. This survey used fence, instead of roofs, to estimate the number of stalls, since stalls are densely clustered in many places within fences, and fences are closer to actual stall size.
Small markets in low-ranking cities Provincial capital. level General cities General cities and counties. Using this method, the total number of stalls in official markets in North Korea was estimated to be. The average number of stalls in nine provinces, Pyongyang Municipality, Nampo Special City, Rajin Special City and .. 18) There are five districts in North Korea's administrative divisions: Rason District, Sonbong District, Ungok District, Tukchang District and Kumho District.
The average population served by an official market was 61,830 and the average number of stalls per market was 2,787. Assuming one vendor per stall, the total number of vendors at official markets in North Korea was 1,153,722.
Estimated Number of Workers at Official Markets


![PDF [IJASEIT] Submission Acknowledgement - repository.ppnp.ac.id](data:image/gif;base64,R0lGODlhAQABAIAAAP///wAAACH5BAEAAAAALAAAAAABAAEAAAICRAEAOw==)