Spent nuclear fuel system. submitted to the Graduate School of UNIST in partial fulfillment of the. requirements for the degree of Master of Science. Ingestion toxicity as a function of decay time for a number of nuclides in spent LWR fuel. a) Cathode polarization curve for a U concentration of 0.75 wt% in the salt. a) Calculation method of the thickness of the diffusion layer. 2D computational domains of the Argonne National Laboratory electrorefining cell showing magnified view of the diffusion-dominant domain near the cathode and anode.
U concentration profile along the line from the center of the anode surface to the center of the cathode bottom surface.
Introduction
Background
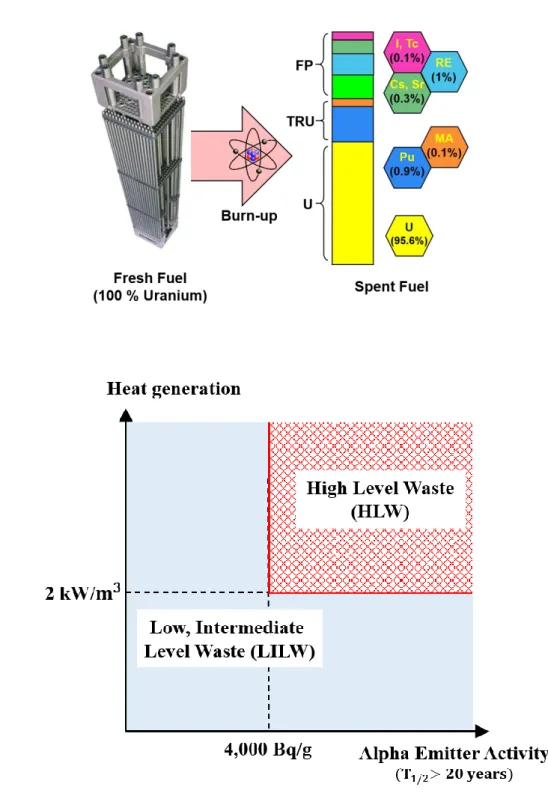
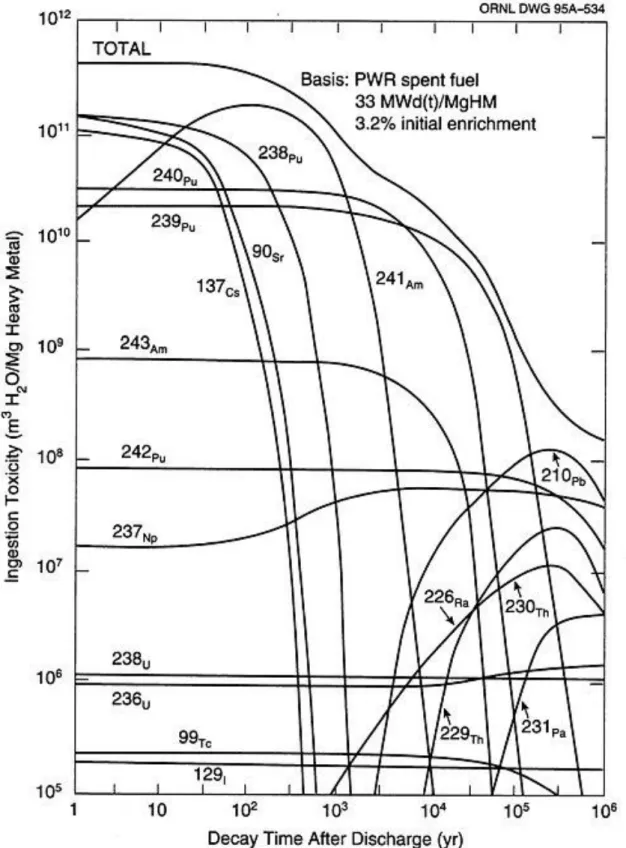
If we can separate each group of spent nuclear fuel, we can reduce the radioactivity and decay heat of the final waste and lower disposal criteria (Figure 1. Status of Spent Nuclear Fuel Storage in South Korea (First Quarter i b) Classification of radioactive waste in South Korea Ingestion toxicity as a function of decay time for a number of nuclides in spent LWR fuel.
![Table 1. The used nuclear fuel storing status in South Korea (The 1 st quarter of the 2018) [1]](https://thumb-ap.123doks.com/thumbv2/123dokinfo/10517388.0/14.892.107.788.382.646/table-used-nuclear-storing-status-south-korea-quarter.webp)
Pyroprocessing
- Oxide reduction process
- Electrorefining & Electrowinning process
During the electron gain process, these residual nuclear materials are co-deposited in the liquid cadmium cathode (LCC) meaning that the sole separation of Pu is impossible. This is a key characteristic of pyroprocessing which has intrinsic resistance to propagation, in contrast to aqueous reprocessing. Argonne National Laboratory (ANL) has developed an electrorefining process including the electrowinning process shown in Figure 5.
This type of electrorefiner consists of solid cathode on which the pure U is deposited, liquid cadmium where the co-deposition of U and TRUs takes place.
![Figure 4. Flow diagram of pyroprocessing developed by KAERI [6].](https://thumb-ap.123doks.com/thumbv2/123dokinfo/10517388.0/22.892.115.784.369.802/figure-4-flow-diagram-pyroprocessing-developed-kaeri-6.webp)
Literature Reviews
Hydrodynamic electrochemical system
Computational modeling of electrorefining process
This model assumed a uniform concentration of elements in the molten salt and the cadmium anode except near the electrode interfaces. Comparisons of experimental polarization data and modeling results with different thicknesses of the diffusion layer in molten salt and liquid cadmium anode are shown in Figure 8. Here, 𝐼𝑖 is the total current of species i generated at the electrode, 𝑖0 is the alternating current density, 𝐴𝑡 is the electrode area, 𝛼 is transmission coefficient and 𝜂𝑖,𝑠 surface overvoltage of type i at the interface.
The experiment was carried out with different applied current as shown in Figure 9. c), (d) shows the comparison of the anode voltage between the predicted result by the proposed model and the experimental result for DT1 and DT2. Most of the applied current was used in the oxidation of a small amount of Pu (< 0.25 wt%) due to the very negative potential of Pu. When Pu is depleted, U becomes the primary species occupying the oxidation stream through most of the electrorefining process.
They successfully predicted the concentration profiles of multiple components in the electroreining process and the simulated results were confirmed by the experimental results of ANL [26]. Zhang's 1D model accounted for changes in surface areas and the volume of the electrodes was also considered in this model. developed a 2D model using COMSOL Multiphysics. They investigated changes in the concentration of the molten salt and the cadmium anode, as well as the deposition of the metal on the solid cathode. studied the effect of diffusion layer thickness, transmission coefficients and electrochemical potential differences on the behavior of electrochemical reactions for U and Pu. 27] developed a 1D transient model of an electrorefiner, ERAD, which developed the REFIN code by adding an anode layer, which is important in the processing of high-zirconium fuel.
Because the diffusion layer thickness is formed by the effect of fluid mechanics, the diffusion layer thickness in the 3D model was calculated in the way shown in Figure 11. However, they found local discrepancies between the simulated results and experimental results. a) Calculation method of the diffusion layer thickness.
![Figure 6. Comparison of U and Pu electrotransport profile in absence and presence of minor actinides and rare earths [21]](https://thumb-ap.123doks.com/thumbv2/123dokinfo/10517388.0/25.892.136.763.327.746/figure-comparison-electrotransport-profile-absence-presence-actinides-earths.webp)
- Cell configuration
- Operating conditions and experimental results
- Data assumed for computational model based on the ANL results
Schematics of the experimental electrorefining cell of the Argonne National Laboratory: the area outlined in red was taken into account in the proposed computer model [26]. During the ANL experiment, five tests were conducted in the electrorefining cell, and their experimental conditions are summarized in Table 4. In addition, Ce, Y, and Nd totaled 1.24 wt% in the molten salt in chloride form, and their concentrations in the cadmium anode were lower than the detection limit of approximately 0.01 wt% [26].
The liquid metal U and Pu were oxidized to the molten salt, and the concentration of liquid metal U and Pu in the cadmium anode decreased as further tests were repeated. The U3+ and Pu3+ ions in the molten salt were reduced and deposited on the cathode. However, the cathode deposition metal composition did not include much Pu in the early test numbers (1–3).
Here, the concentration of Pu3+ in the molten salt increased due to active oxidation reactions at the anode and almost no reduction reactions at the cathode. However, the current used and the running time of each test are not listed in the ANL report. Based on the assumed current and amount of charge required to deposit the total amount of U and Pu metal on the cathode (Table 5).
Here t is the working time (s), n𝑖 is the charge of type i (dimensionless), NA is Avogadro's constant (mol-1), mi is the mass of metal deposited on the cathode of type i (g), e is the elementary charge, Mi is the molar mass of species i (g mol-1) and I is the applied current (A). The operation time is estimated based on the experimental results of ANL based on the total charge transferred to the cathode in relation to the amount of metal deposited.
![Figure 12. Schematics of the Argonne National Laboratory electrorefining experimental cell: the region outlined in red was considered in the proposed computational model [26]](https://thumb-ap.123doks.com/thumbv2/123dokinfo/10517388.0/34.892.217.694.327.764/schematics-argonne-national-laboratory-electrorefining-experimental-considered-computational.webp)
Numerical Model
- Mathematical equations
- Mass transfer
- Electrochemical reactions
- Numerical approach
- Velocity and concentration distribution
- Thickness of diffusion-dominant regions
The cathode acts as a mass sink of positive ion species due to the reduction current. Although the thicknesses of the diffusion layer of U, Pu, Nd molten salt and liquid cadmium are different, most of the reactant at the cathode is U. The radius of the anode surface is 7.6 cm. b) shows the mesh configuration of the 3D model.
The right-hand side images in Figure 16 show the grid configuration in the vicinity of the cathode and anode surfaces, respectively. Two diffusion layers were placed near the interface between the molten salt and the cadmium anode. The picture of the upper right side is the vicinity of the cathode and the one of the lower side is the vicinity of the anode.
Applying no slip at the wall, the largest magnitude reached 0.05864 m/s at the side surface of the cathode. Although convection was dominant in the bulk electrolyte, diffusion became dominant near the surface of the cathode. As expected, the concentration of U ions in the vicinity of the cathode surface decreased, developing a diffusion boundary layer up to several tens of micrometers.
In addition, the order of U velocity at the cathode surface was 10-2 m/s, and the U velocity at the anode surface was 10-6 m/s. The thickness of the diffusion-dominated regions from the cathode surface was calculated using equation (14). The average concentration gradient was obtained from the difference in the average concentrations on the surface of the cathode and the surface closest to the cathode.
The calculated thickness of the diffusion dominant regions at the cathode was m using average concentration distributions from the surface of the cathode.
![Table 6. Transport properties of U, Pu, and Nd in LiCl(59 mol%)-KCl(41 mol%) electrolyte and liquid Cd metal at 773K [28, 34-36]](https://thumb-ap.123doks.com/thumbv2/123dokinfo/10517388.0/41.892.150.738.356.793/table-transport-properties-licl-kcl-electrolyte-liquid-metal.webp)
Benchmark of U-Pu-Nd Electrochemical Reactions using 2D Kinetic Model
- Anodic dissolution
- Cathode deposition
- Bulk concentration of the molten salt
- Sources of disparities between the model and experiment
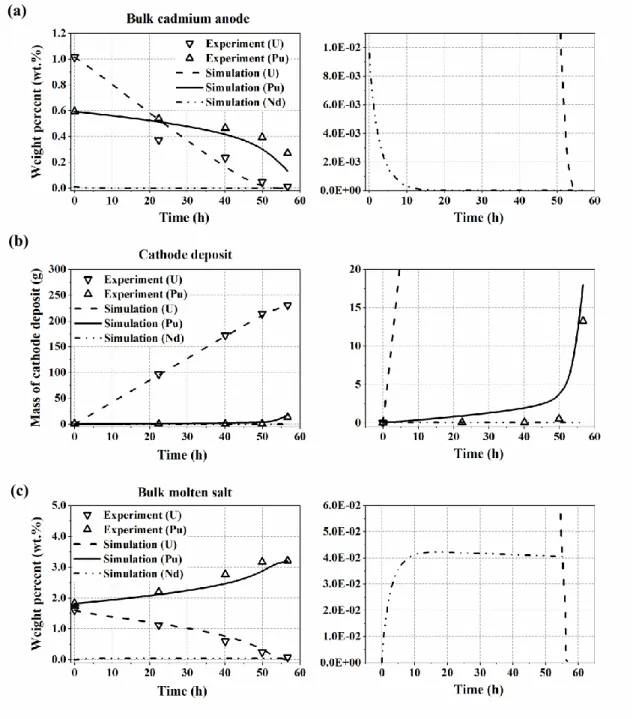
The overpotential U was negative and the sign of the exponent of the local current density was positive throughout the simulation. The overvoltage Pu was positive, so the sign of the exponent of the local current density was negative up to 50 h. However, the sign of the Pu exponents reversed at about 50 hours, when the cathodic current of Pu rose sharply and U dropped, and the magnitude of the cathodic current of Pu exceeded the magnitude of U at about 53 hours (Fig.
This is because the highest velocity was formed at the edge of the cathode and therefore the reactants were actively supplied from the bulk region. Thus, the concentration of U in the molten salt decreased continuously and the concentration of Pu increased until ca. 53 hours of operation time as shown in Figure 19. As the concentration of U in the molten salt and cadmium decreased, the limiting current of U could not fully satisfy the total cathodic and anodic current.
Therefore, the bulk concentration of Nd in the molten salt increased until 10 h and then remained constant. a) Weight percentage of U, Pu and Nd in bulk of the cadmium anode. The initial amount of Nd in the cadmium anode was 9.6×10⁻³ wt%, which is less than the detection limit. This difference is in violation of the charge conservation law, and therefore we assumed that other species may have dissolved from the cadmium anode to the molten salt in the amount of the difference.
We chose Nd as a representative of the lanthanide species and added 0.1098 mol Nd to the cadmium anode. However, the discrepancy in the mass concentration of U and Pu in the molten salt worsened (Figure 22. c)), indicating that some experimental errors such as inhomogeneous sampling, human errors must have occurred in the molten salt or in the anode of cadmium. a) Weight percentage of U and Pu in the bulk of the cadmium anode.
Conclusions
Barrado, The electrochemical behavior of the Pr(III)/Pr redox system on Bi and Cd liquid electrodes in molten eutectic LiCl – KCl, Journal of Electroanalytical Chemistry. Park, Transient modeling of spent fuel electrorefining with liquid metal electrode, Journal of Nuclear Materials. Walsh, Numerical simulation of the current, potential and concentration distributions along the cathode of a rotating cylinder Hull cell, Electrochimica Acta.
Johnson, Thermodynamics of pyrochemical processes for liquid metal reactor fuel cycles, Journal of Nuclear Materials. Bhat, Thermochemical modeling of uranium and plutonium electrotransport in an electrorefinery, Nuclear Engineering and Design. Tokiwai, Development of TRAIL, a simulation code for molten salt electrorefining of spent nuclear fuel, Journal of Alloys and Compounds.
Yoo, Development of computational models for the Mark-IV Electrorefiner - Effect of uranium, plutonium and zirconium dissolution at the fuel basket-salt interface, Nuclear Technology. Nagarajan, Molten salt electrorefining process modeling for spent metal fuel using COMSOL, Separation Science and Technology. Miller, Transport of Uranium to Solid Electrodes in the Pyrochemical Processing of Nuclear Fuel, Journal of The Electrochemical Society.
Paek, Three-dimensional current density simulation of many types of molten salt electrorefining, Journal of Alloys and Compounds. Hwang, Uncertainty studies of real anode surface in computational analysis for molten salt electrorefining, Journal of Nuclear Materials.
![Figure 2. Thermal power profiles of spent LWR fuel and its major constituents groups [3]](https://thumb-ap.123doks.com/thumbv2/123dokinfo/10517388.0/16.892.135.751.226.925/figure-thermal-power-profiles-spent-major-constituents-groups.webp)
![Table 2. Properties of actinides in discharged uranium fuel (Uranium-fueled PWR, 1000 MWe, 150 days after discharge) [5]](https://thumb-ap.123doks.com/thumbv2/123dokinfo/10517388.0/18.892.112.786.291.994/table-properties-actinides-discharged-uranium-uranium-fueled-discharge.webp)
![Table 3. Properties of selected fission products of interest in used nuclear fuel and HLW [5]](https://thumb-ap.123doks.com/thumbv2/123dokinfo/10517388.0/19.892.115.783.383.590/table-properties-selected-fission-products-used-nuclear-fuel.webp)
![Figure 5. Schematic representation of the IFR electrorefining process [7].](https://thumb-ap.123doks.com/thumbv2/123dokinfo/10517388.0/23.892.162.760.369.871/figure-5-schematic-representation-ifr-electrorefining-process-7.webp)
![Figure 7. Diffusion layer model for the Cd anode [22].](https://thumb-ap.123doks.com/thumbv2/123dokinfo/10517388.0/27.892.204.700.347.819/figure-7-diffusion-layer-model-cd-anode-22.webp)
