KEEI
Korea Mid-term Energy Demand Outlook
(2020-2025)
KOREA ENERGY ECONOMICS INSTITUTE
K OREA ENERGY ECONOMICS INS TITUTE
KEEI Korea Energy Demand Outlook
Volume 23, No. 1 ISSN 1599-9009
First Half
Published by the Korea Energy Economics Institute (KEEI), Energy Demand Outlook takes a closer look at the global energy market and supply and demand trends in domestic energy and examines the outlook for short-term energy demand.
This report outlines the recent changes in the supply and demand of energy and provides important data and policy implications in an effort to contribute to the establishment and adjustment of a series of energy policies by the government.
This report is written by the Energy Demand and Supply Division of the Center for Energy Information and Statistics in cooperation with the Energy Statistics Research Division of KEEI and other related research divisions.
Byunguk Kang (Electricity, Transformation) wrote the report with the participation and support of Cherl-Hyun Kim (Coal, Gas), Seonggyun Kim (Oil), SungJae Lee (Economics, Heat and Renewables).
If you have any further inquiries, please send an email to [email protected] or
call +82-52-714-2241.
□ Total Primary Energy Supply (“TPES”) recorded an annual average growth of a mere 0.3% from 2015 to 2020 due to the recent decrease in TPES for two consecutive years
o From 2016 to 2018, TPES kept increasing at a level of 2-3%. However, the annual average growth of TPES declined to around 0% from 2015 to 2020 as TPES increase rates for 2019 and 2020 were 1.5% and -4.0%, respectively, posting a drop for two years in a row
Figure 1.1 TPES, TFC and GDP growth rates
o Similarly, Total Final Consumption (“TFC”) posted annual average growth rates of 1-4% from 2016 to 2018. For 2019 and 2020, however, the growth decreased by 0.9% and 4.0%, driving TFC to post an increase of a mere 0.6% from 2015 to 2020
o In recent years, overall energy use went up at a slower rate with slow economic growth and industrial structure changes and in 2020, energy consumption fell considerably as production activities suffered a downturn amid COVID-19 pandemic. As a result, the annual growth rate of energy consumption experienced a significant fall to a 0% level from 2015 to 2020
□ Energy Intensity rapidly recovered with a slowdown in energy consumption growth and decreased use in recent years
o Energy Intensity (toe/million KRW), an index used for measuring national energy efficiency, recovered (declined) from 2015 to 2020 at a rate faster than before
-6.0 -3.0 0.0 3.0 6.0 9.0 12.0
2010 2012 2014 2016 2018 2020p
%
GDP
TPED
FEC
o However, caution should be exercised when assuming that these changes in energy intensity are directly related to improvement in energy efficiency. Because in 2019, there were unrelated factors such as temperature effects, and in 2020, the unexpected COVID-19 pandemic played a greater role in declining energy consumption
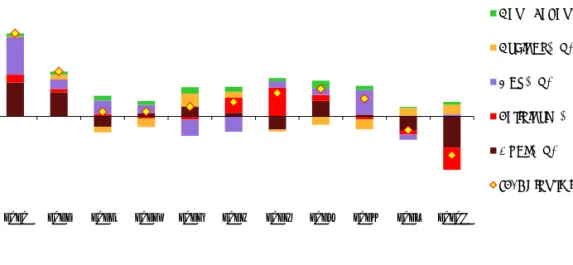
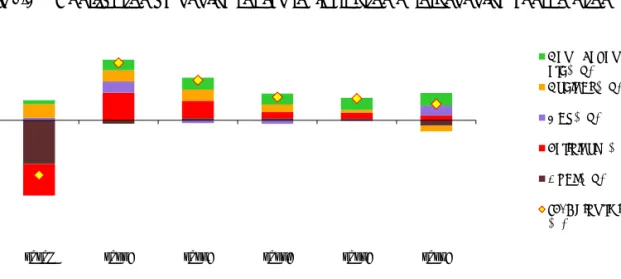
Figure 1.2 Contribution by energy source to fluctuation of total energy consumption
□ In the recent five years, gas and renewable energy increased decently, while coal and nuclear energy declined with oil remaining stationary
o Coal use grew fast mainly in the power generation and steel sectors until early 2010s. From 2015 to 2020, however, coal consumption posted an annual average decrease of 2.9% as the steel industry suffered a downturn and coal-fired generation was limited by the fine dust measures of the government Figure 1.3 Comparison of annual growth by energy source
- 9.0 - 6.0 - 3.0 0.0 3.0 6.0 9.0 12.0
2010 2011 2012 2013 2014 2015 2016 2017 2018 2019 2020p
%p, %
New&Renewable, etc(%p) Nuclear (%p)
Gas (%p) Petroleum (%p) Coal (%p) TPES growth rate
- 5.0 0.0 5.0 10.0 15.0
2005~2015 2015~2020p
Coal Petroleum Nuclear Gas yoy, %
o The growth of oil use slowed down with increased oil price to post a decline from 2015 to 2020.
Especially, oil consumption dropped by 5.8% as industrial production slowed down and Social Distancing measures were put in place amidst COVID-19 pandemic
o From 2015 to 2020, natural gas use increased by an annual average of 4.4% as the use for power generation went up rapidly with energy transition policies and the final consumption grew as well driven by a temperature effect and an increase in direct imports by the private sector
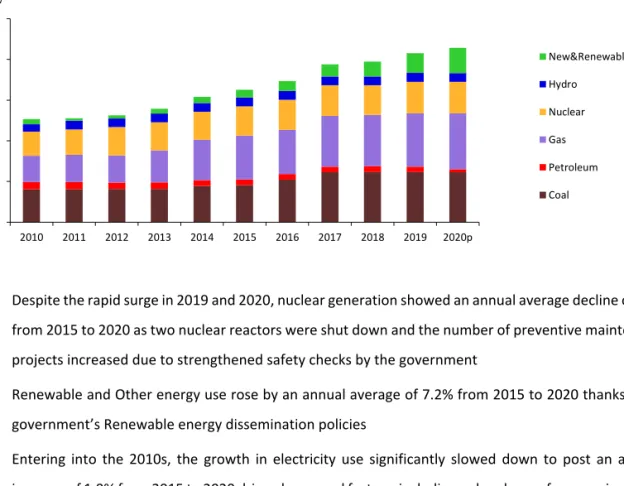
Figure 1.4 Generation capacity trends by energy source
o Despite the rapid surge in 2019 and 2020, nuclear generation showed an annual average decline of 0.6%
from 2015 to 2020 as two nuclear reactors were shut down and the number of preventive maintenance projects increased due to strengthened safety checks by the government
o Renewable and Other energy use rose by an annual average of 7.2% from 2015 to 2020 thanks to the government’s Renewable energy dissemination policies
o Entering into the 2010s, the growth in electricity use significantly slowed down to post an average increase of 1.0% from 2015 to 2020 driven by several factors, including a slowdown of economic growth, the energy demand management policies by the government and electrification becoming stagnant
- 30 60 90 120 150
2010 2011 2012 2013 2014 2015 2016 2017 2018 2019 2020p
GW
New&Renewable, etc Hydro
Nuclear Gas Petroleum Coal
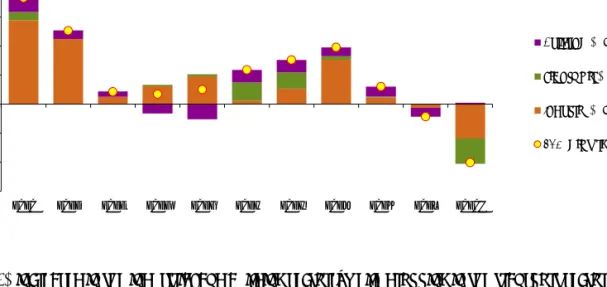
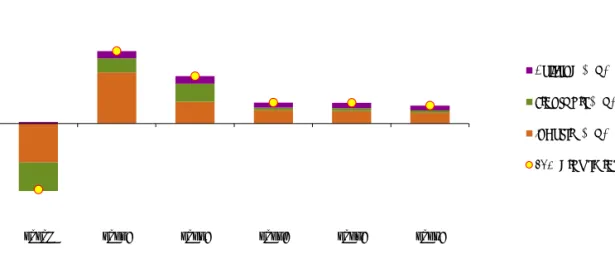
Figure 1.5 Contribution of end-use sectors to fluctuation of TFC consumption
□ TFC increased in the industrial and building sectors, while dropping in the transport sector o From 2010 to 2015, industrial energy use showed an annual average increase of 2.7% mainly in the steel
and petrochemical industries, which have high energy intensity. On the contrary, from 2015 to 2020, the annual average growth experienced a considerable decline to 0.6% as the steel industry started to decrease in energy consumption and the energy use in the petrochemical industry slowed down as well Figure 1.6 Fluctuation in cooling and heating degree days & buildings’ energy use rates
Note: The data for cooling and heating degree days shows year-on-year differences
o Energy use in the building sector kept showing a decreasing trend due to stagnant population and increased energy efficiency. From 2015 to 2020, however, the growth added speed to post an annual average of 1.6% driven by abnormal temperature such as heat waves and cold snaps
o In 2020, energy use in the transport sector declined by a whopping 9.4% upon the onset of COVID-19 pandemic, following a static period after 2017 with increased oil prices
- 6.0 - 4.0 - 2.0 0.0 2.0 4.0 6.0 8.0
2010 2011 2012 2013 2014 2015 2016 2017 2018 2019 2020p
%p, %
Building (%p) Transport (%p) Industry (%p) FEC growth rate
- 9.0 - 6.0 - 3.0 0.0 3.0 6.0 9.0
- 300 - 200 - 100 0 100 200 300
2009 2013 2014 2015 2016 2017 2018 2019 2020
Degree Days %
HDD
CDD
Buildings growth rate
2. TPES & TFC Outlook 1
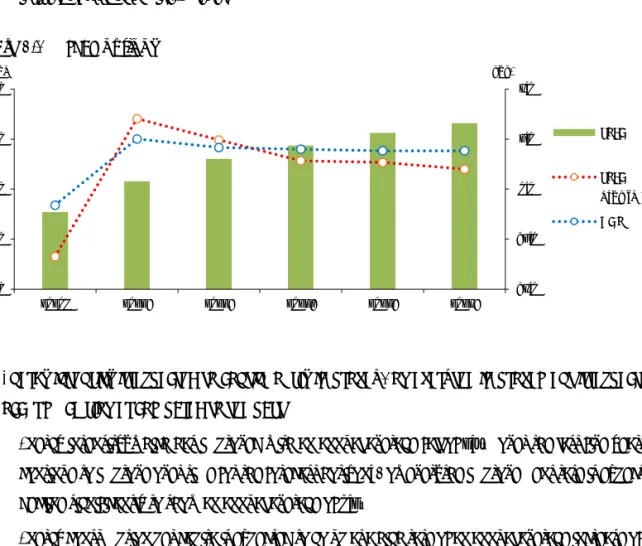
□ From 2020 to 2025, Total Primary Energy Supply (“TPES”) is expected to grow by an annual average of 2.3% to reach 326.4 million toe by 2025
o In the early stage of the forecast horizon, TPES is expected to increase dramatically with the national economy recovering from the impact of COVID-19 pandemic, followed by a stable phase in which TPES is likely to stay at a mid-1% level
Figure 2.1 TPES outlook
□ Energy intensity is expected to continuously improve. However, the improvement is expected to occur much slower compared to the past
o Energy intensity, which has improved with an annual average fall of 1.7% over the last five years, will continue to improve over time for the forecast horizon. However, the improvement rate is expected to decline significantly to show an annual average of 0.2%
o Energy consumption per capita is expected to go up at a high rate of an annual average increase of 2.3%
from 5.6 toe in 2020 to reach 6.3 toe by 2025
1
The lowercase p and e, which are added to each year, indicates provisional and forecast values, respectively
- 6.0 - 3.0 0.0 3.0 6.0
260 280 300 320 340
2020p 2021e 2022e 2023e 2024e 2025e
yoy, % Mtoe
TPED
TPED growth rate GDP
Figure 2.2 Energy consumption per capita and energy intensity outlook
□ During the period under consideration, coal demand will stay at the current level while all other energy sources are expected to show a decent increase
o The coal demand is forecast to post a mere annual average growth of 0.2%, as the consumption for power generation is likely to fall due to the limitations on coal-fired generation, offsetting the anticipated increase in the final use sector driven by the industrial sector
o As the national economy is likely to recover from the impact of COVID-19 pandemic, the oil demand in the transport and industrial sector will rise in 2021. As a result, the demand is expected to continuously go up by an annual average of 2.5% for the forecast period
Figure 2.3 Contribution by energy source to fluctuation of total energy consumption
o For the period under consideration, nuclear generation is forecast to grow by an annual average of 3.3%
as 1.4 GW large-capacity reactors are planned to come online every year from 2021 to 2024 and the utilization rate for nuclear facilities is likely to be maintained at an early 80% level
0.150 0.155 0.160 0.165 0.170 0.175 0.180
4.8 5.1 5.4 5.7 6.0 6.3 6.6
2015 2016 2017 2018 2019 2020p 2021e 2022e 2023e 2024e 2025e
(toe/million won) toe
TPED/capita Energy Intensity
- 9.0 - 6.0 - 3.0 0.0 3.0 6.0
2020p 2021e 2022e 2023e 2024e 2025e
%p, %
New&Renewable, etc(%p)
Nuclear (%p) Gas (%p) Petroleum (%p) Coal (%p) TPES growth rate (%)
o Although the final consumption sector will witness a growth, natural gas demand is expected to show an annual average of a mere 1.1% increase as the gas demand in the power generation sector will drop due to the rise in base-load generation driven by nuclear power
o New&renewable and other energy demand is anticipated to soar by an annual average of 10.7% from 19.9 million toe in 2020 to 33.2 million toe in 2025, thanks to the renewable energy dissemination policy by the government
o Electricity demand in the final consumption sector is likely to rebound fast as the national economy will recover from the impact of COVID-19 pandemic in 2021. Accordingly, the demand growth is anticipated to stay around at a 2% level to bring the electricity demand up by an annual average of 2.2% for the forecast period
Figure 2.4 Contribution of end-use sectors to fluctuation of TFC consumption
□ FEC by end-use sector is expected to grow by an annual average of 2.2% for the forecast horizon to reach 247.2 million toe in 2025
o In the industrial sector, energy demand will rise by 5% with rapid economic recovery in 2021. Since then, however, the trend will slow down considerably to grow by an annual average of 2.1% for the forecast period
o In the transport sector, which was hit the most by COVID-19 pandemic in 2020, energy demand is likely to post an annual growth of 2.7% for the forecast horizon. Specifically, the energy demand is expected to rise by 4.9% mainly in the road transport industry in 2021 and soar by 6.2% in 2022 thanks to a recovery in the air transport industry
- 6.0 - 4.0 - 2.0 0.0 2.0 4.0 6.0
2020p 2021e 2022e 2023e 2024e 2025e
%p, %
Building (%p) Transport (%p) Industry (%p) FEC growth rate(%)
o Energy demand in the building sector is anticipated to go up, driven by the industrial sector (sector-wise)
as well as electricity and gas (source-wise) to post an annual average growth of nearly 2% for the period
under consideration
3. Key Features and Implications
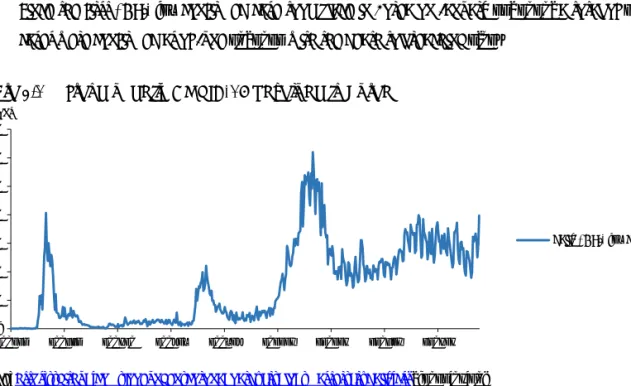
Impact of COVID-19 pandemic on electricity consumption in 2020
2□ Although suffering from three waves of COVID-19 pandemic in 2020, Korea was successful in fighting against the spread with Social Distancing measures
o Since the first COVID-19 confirmed case took place in Korea on January 21, 2020, a total of 156,961 cases were confirmed as of June 30, 2021 with the death toll reaching 2,018
Figure 3.1 Trend of daily COVID-19 caseload in Korea
Source: https://github.com/jooeungen/coronaboard_kr/blob/master/kr_daily.csv, (2021.06.30)
□ Globally, COVID-19 pandemic has brought about massive changes onto energy consuming patterns and energy markets along with an economic downturn and behavioral changes in our life
o It turns out that the impact of COVID-19 crisis drove down electricity consumption in most countries, with the fall depending on the intensity of the implemented lock down measures (IEA, 2020)
o Spain, Italy, Belgium, the U.K. and other countries implementing a strict lockdown in the face of COVID- 19 pandemic witnessed a dramatic fall in electricity consumption while Netherlands and Sweden, the countries resorted to light lockdown measures, experienced a relatively small drop in power use (BahmanyarAlireza, EstebsariAbouzar, ErnstDamien, 2020)
2 This is a moderated version of an excerpt from “Impact of COVID-19 Pandemic on Electricity Supply and Demand in Korea”
by Suil Kim (2021) -
200 400 600 800 1 000 1 200 1 400
200121 200321 200520 200719 200917 201116 210115 210316 210515
persons
daily COVID-19 caseload
o During the strict lockdown, electricity use in Spain plunged by 13.5% compared to the same period from 2015 to 2019 and especially, the power consuming patterns for daytime changed considerably (SantiagoI., et 2021)
□ Similarly, Korea experienced a year-on-year drop of 2.2% in electricity consumption due to the impact of COVID-19 with changing consuming patterns
o Although electricity use in the consumption sector (residential building) decreased due to Social Distancing restrictions, in general, the overall electricity use declined as the production sectors including industrial and service sectors experienced a drop. However, the decline in the national electricity consumption is smaller compared to other major countries enforcing lockdown measures to fight against COVID-19 pandemic
o Overall, electricity use decreased due to the impact of COVID-19 pandemic. However, there is no clear correlation between the increasing number of confirmed cases and the decline in electricity consumption
o Yearly maximum electricity consumption slightly declined by 0.8% from 85.4 GW in 2019 to 84.7 GW in 2020, showing a minor impact of COVID-19 pandemic compared to the minimum power consumption, which plunged by 5.1%
o Analyzing the change in energy consumption patterns for 2020 using Mahalanobis distance shows that the daily power consumption pattern for daytime changed in April, June and December. In terms of time period, a pattern change was observed for 4a.m.-4p.m. as well as 8p.m.-12a.m
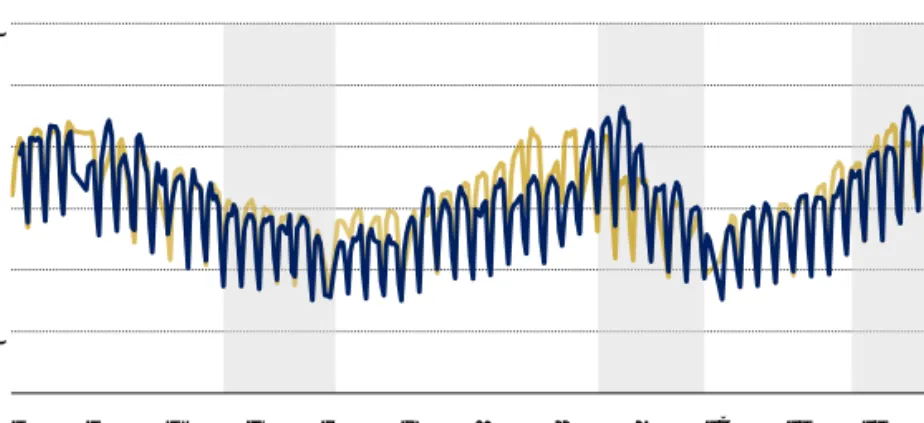
Figure 3.2 2016-2019 Average Electricity Consumption vs. 2020 Electricity Consumption
Source: Soo-il Kim (2021) p.16 0.8
1.0 1.2 1.4 1.6 1.8 2.0
1 2 3 4 5 6 7 8 9 1
0 1 1
1 2
TWh
2016-2019
2020
1 2 3 4 5 6 7 8 9 10 11 12
□ In the face of COVID-19 pandemic, each sector displayed different electricity consumption patterns o The overall electricity consumption declined in the manufacturing sector. More specifically, the fall in minimum consumption, which has the lowest load, was greater compared to the fall in maximum consumption
o In the past, the residential building sector had a pattern in which electricity use reached the morning peak before the rush hour, and then dropped until lunchtime. As more and more people work from home, the short peak before the morning rush hour disappeared and the electricity demand stays flat until lunchtime
o Some service industries, which were hit the most by the impact of COVID-19 pandemic including Education, Food & Accommodation and Art, Sports & Leisure experienced changes in their electricity use pattern along with a decline in electricity consumption
Changes in GHG emissions in the power generation sector
□ Although large-capacity coal-fired generation facilities are planned to come online during the forecast period (2020-2025), GHG emissions in the power generation sector are likely to go down
o According to the ninth Basic Plan for Electricity Supply and Demand (issued by Ministry of Trade, Industry and Energy in December 2020), a total of seven coal-fired generating units with a capacity of 7.3 GW will be newly installed in the final stage of the government plan for coal generation.
Shinseocheon-1 unit will be built in 2021 to be the first of the seven scheduled units while Samcheonpo- 2 will be the last, planned to be installed in 2024
o Nevertheless, the facility expansion will be partially offset as 10 out-of-date generation units equivalent
to 4.7 GW are scheduled to be shut down from 2021 to 2025. Since the total coal-fired generation
management system is going to be put in place along with the operation shutdown and coal-fired
generation cap measures aiming at controlling fine dust, the volume of coal-fired generation and
resulting GHG emissions are expected to decline slightly for the forecast horizon
Table 3.1 Change in coal-fired and nuclear power generation capacity under the 9th Basic Plan for Electricity Supply and Demand (2021-2025)
Year Coal Nuclear
2021
Shinseocheon#1(1,000 MW) Shinhanul #1(1,400 MW)
Goseonghai#1(1,040 MW)
Goseonghai#2(1,040 MW)
Samcheonpo#1(-560 MW)
Samcheonpo#2(-560 MW)
Honam#1(-250 MW)
Honam#2(-250 MW)
2022 Gangreunganin#1(1,040 MW) Shinhanul #2(1,400 MW)
2023
Gangreunganin#2(1,040 MW) Shinkori#5(1,400 MW)
Samcheok#1(1,050 MW) kori#2(-650 MW)
2024
Samcheok#2(1,050 MW) Shinkori#6(1,400 MW)
Samcheonpo#3(-560 MW) kori#3(-950 MW)
Samcheonpo#4(-560 MW)
2025
태안#1(-500 MW) kori#4(-950 MW) 태안#2(-500 MW) Hanbit #1(-950 MW)
Boryeong#5(-500 MW)
Boryeong#6(-500 MW)
Source: The 9th Basic Plan for Electricity Supply and Demand, The generators highlighted in blue are scheduled to be shutdown
Note: After a prolonged approval process, Shinhanul-1 was finally given the green light in July. It will commence commercial operation on March 2022
o Although electricity demand is likely to increase continuously for the forecast period, gas power
generation will fall slightly with nuclear and renewable growing fast in power generation. Accordingly,
GHG emissions caused by gas generation is expected to tick down
Figure 3.3 Changes in GHG emissions in the power generation sector for the forecast period
Petrochemical facility expansion
□ Thanks to the new installation and expansion of petrochemical facilities, the demand for naphtha and LPG is forecast to increase, driving a growth in energy demand in the industrial sector o Since 2014, many firms in the domestic and overseas petrochemical sectors continued to invest in plant
and equipment to realize the economy of scale on the back of low oil prices, regardless of the demand for petrochemical products in the global market (Dongwon Sung, 2019.4.25)
Figure 3.4 The growth rates of industrial use and Naphtha & LPG(industry) & economic growth rates
Note: Industrial energy includes the demand for raw materials such as naphtha
-15.0 -10.0 -5.0 0.0 5.0 10.0 15.0
- 50 100 150 200 250 300
2018p 2019p 2020p 2021e 2022e 2023e 2024e 2025e
% M ton CO2eq
Gas Petroleum Coal GHG emission growth rate
-10.0 -5.0 0.0 5.0 10.0
2020p 2021e 2022e 2023e 2024e 2025e
%
Industry
GDP
Naphtha&LPG(Industry)
o Thanks to the new installation and expansion of petrochemical facilities, the demand for naphtha and LPG used as base materials is forecast to significantly grow, in turn, to drive an increase in demand for industrial energy
Economic growth scenarios
□ Total energy demand is predicted to go up by an annual average of 2.6% under the high-growth scenario and an annual average of 2.1% under the low-growth scenario
o When establishing the two scenarios, economic uncertainties for the forecast horizon were factored in Figure 3.5 GDP assumptions and TPES outlook across three scenarios
o By 2025, TPES is anticipated to reach 330 Mtoe under the high-growth scenario and 323 Mtoe under the low-growth scenario
o Under the high-growth scenario, final energy consumption is forecast to grow by an annual average of 2.5% for the period under consideration to reach 250 Mtoe. However, final energy consumption is likely to post an annual average increase of 1.9% to stay around 244 Mtoe under the low-growth scenario
260 280 300 320 340
2020p 2021e 2022e 2023e 2024e 2025e
Mtoe
TPED
1 600 1 750 1 900 2 050 2 200
2020p 2021e 2022e 2023e 2024e 2025e
Trilion won
GDP
BAU HEG LEG
Figure 3.6 TPES & TFC outlook in 2025 across three scenarios
o If the high-growth scenario is the case, energy intensity is likely to improve by an annual average of 0.5%
to reach 0.158 toe/million KRW while it is anticipated that the index will reach 0.160 toe/million KRW with an annual average increase of 0.2% under the low-growth scenario
71.0 71.8 72.5
122.7 124.3 126.1
55.6 57.2 58.4
40.1 40.1 40.1
33.1 33.2 33.2
- 100 200 300 400
LEG BAU HEG
M toe
Coal Petroleum Gas nuclear New&Renewable, etc
150.2 152.8 155.8
44.1 44.5 44.6
49.4 50.0 50.3
- 100 200 300 400
LEG BAU HEG
M toe
Industry Transport Buildings
The Main Indicator and Energy Outlook Result
Main Economic and Energy Indicators - BAU Scenario
CAGR (%)
2017 2018 2019 2020p 2021e 2022e 2023e 2024e 2025e 15-20 20-25
Economy and Population
GDP (2010 trillion won) 1 760.8 1 812.0 1 849.0 1 831.2 1 886.4 1 933.5 1 979.9 2 025.5 2 072.1 2.0 2.5 Industrial Production(2010=100) 104.8 106.4 106.7 106.3 108.3 110.1 112.4 114.3 116.3 1.2 1.8 Crude Oil Price (Dubai, USD/bbl) 53.2 69.4 63.5 42.2 60.4 57.9 58.2 62.9 67.4 - 3.6 9.8
Working Days 269.5 270.0 272.5 275.0 276.0 275.5 274.5 272.5 274.5 0.1 - 0.0
Population (million) 51.4 51.6 51.7 51.8 51.8 51.8 51.9 51.9 51.9 0.3 0.0
Average Temperature (ºC) 13.1 13.0 13.5 13.3 13.4 13.2 13.2 13.2 13.2 - 0.3 - 0.2 Cooling Degree days 132.7 209.0 120.4 92.5 104.1 104.1 104.1 104.1 104.1 2.4 2.4 Heating Degree days 2 517.1 2 597.8 2 342.9 2 382.7 2 358.6 2 452.7 2 452.7 2 467.6 2 452.7 0.7 0.6
Energy Indicators
Total Primary Energy Demand (Mtoe) 302.1 307.6 303.1 290.8 303.1 312.1 317.4 322.5 326.4 0.3 2.3 Energy Intensity (toe/million won) 0.172 0.170 0.164 0.159 0.161 0.162 0.160 0.159 0.158 - 1.7 - 0.2 TPED/capita (toe/capita) 5.881 5.960 5.862 5.617 5.850 6.020 6.120 6.216 6.289 - 0.0 2.3 Electricity Generation (TWh) 553.5 570.6 563.0 552.1 577.4 590.3 602.0 613.4 624.0 0.9 2.5 Electricity Generation/capita (MWh/capita) 10.8 11.1 10.9 10.7 11.1 11.4 11.6 11.8 12.0 0.6 2.4 Electricity Demand/capita (MWh/capita) 9.9 10.2 10.1 9.8 10.2 10.4 10.6 10.8 11.0 0.7 2.2
Energy Demand - BAU Scenario
CAGR (%)
2017 2018 2019 2020p 2021e 2022e 2023e 2024e 2025e 15-20 20-25
Total Primary Energy Supply
Coal (Mton) 139.8 141.1 133.0 116.6 116.0 117.3 118.6 119.5 117.8 - 2.9 0.2
Oil (Mbbl) 937.1 931.8 927.1 873.3 925.7 956.0 967.4 979.1 989.9 0.5 2.5
Gas (Bm3) 36.4 42.3 41.0 41.4 43.3 42.8 42.2 42.0 43.8 4.4 1.1
Hydro (TWh) 7.0 7.3 6.2 7.1 7.2 8.1 8.1 8.1 8.1 4.3 2.5
Nuclear (TWh) 148.4 133.5 145.9 160.2 171.4 183.2 191.3 194.7 188.1 - 0.6 3.3 Other Renewables (Mtoe) 15.8 17.1 17.7 18.4 20.6 23.1 25.6 28.5 31.4 7.4 11.3
Total (Mtoe) 302.1 307.6 303.1 290.8 303.1 312.1 317.4 322.5 326.4 0.3 2.3
Coal 86.2 86.7 82.1 72.4 71.7 72.2 72.7 73.0 71.8 - 3.3 - 0.2
Oil 119.4 118.5 117.3 110.3 116.3 120.1 121.5 122.9 124.3 0.2 2.4
Gas 47.5 55.2 53.5 54.1 56.5 55.9 55.1 54.9 57.2 4.4 1.1
Nuclear 1.5 1.5 1.3 1.5 1.5 1.7 1.7 1.7 1.7 4.5 2.5
Hydro 31.6 28.4 31.1 34.1 36.5 39.0 40.7 41.5 40.1 - 0.4 3.3
Other Renewables 15.8 17.1 17.7 18.4 20.6 23.1 25.6 28.5 31.4 7.4 11.3
Total Final Consumption
Coal (Mton) 50.4 49.3 48.2 45.8 47.9 48.8 49.2 49.3 49.4 - 2.7 1.5
Oil (Mbbl) 926.6 920.0 918.5 867.1 919.8 951.2 962.4 974.1 984.8 0.7 2.6
Gas (Bm3) 22.6 24.3 23.3 22.5 23.1 23.4 23.5 23.7 23.8 1.6 1.2
Electricity (TWh) 507.7 526.1 520.5 509.3 526.2 537.9 548.4 558.8 568.5 1.0 2.2
Heat (Mtoe) 2.4 2.7 2.6 2.7 2.7 2.8 2.9 3.0 3.0 6.2 2.8
Other Renewables (Mtoe) 8.6 9.1 8.9 8.8 8.9 9.4 9.7 10.1 10.4 3.0 3.4
Total (Mtoe) 230.6 233.4 231.4 222.0 231.8 238.5 241.6 244.6 247.3 0.6 2.2
Coal 33.4 32.5 32.1 30.6 31.4 31.7 31.6 31.5 31.3 - 2.6 0.5
Oil 117.9 116.8 116.1 109.5 115.5 119.5 120.9 122.3 123.6 0.5 2.5
Gas 24.6 27.0 26.9 26.7 28.1 28.9 29.3 29.7 30.1 3.5 2.4
Electricity 43.7 45.2 44.8 43.8 45.3 46.3 47.2 48.1 48.9 1.0 2.2
Heat 2.4 2.7 2.6 2.7 2.7 2.8 2.9 3.0 3.0 6.2 2.8
Other Renewables 8.6 9.1 8.9 8.8 8.9 9.4 9.7 10.1 10.4 3.0 3.4
Industry 142.5 143.5 142.9 137.4 144.3 147.4 149.3 151.2 152.8 0.6 2.1
Transport 42.8 43.0 43.0 38.9 40.8 43.4 43.8 44.2 44.5 - 0.5 2.7
Buildings 45.3 46.9 45.5 45.7 46.7 47.7 48.5 49.3 50.0 1.6 1.8
Energy Demand - BAU Scenario
(yoy, %)
CAGR (%)
2017 2018 2019 2020p 2021e 2022e 2023e 2024e 2025e 15-20 20-25
Total Primary Energy Supply
Coal (Mton) 8.1 0.9 - 5.7 - 12.4 - 0.5 1.1 1.2 0.7 - 1.4 - 2.9 0.2
Oil (Mbbl) 1.7 - 0.6 - 0.5 - 5.8 6.0 3.3 1.2 1.2 1.1 0.5 2.5
Gas (Bm3) 4.3 16.2 - 3.1 1.1 4.5 - 1.1 - 1.5 - 0.4 4.1 4.4 1.1
Hydro (TWh) 5.5 3.9 - 14.1 14.4 1.4 11.8 0.0 0.2 - 0.2 4.3 2.5
Nuclear (TWh) - 8.4 - 10.1 9.3 9.8 7.0 6.9 4.5 1.8 - 3.4 - 0.6 3.3
Other Renewables (Mtoe) 16.7 8.0 3.3 4.0 12.1 12.2 10.9 11.0 10.5 7.4 11.3
Total (Mtoe) 2.8 1.8 - 1.5 - 4.0 4.2 3.0 1.7 1.6 1.2 0.3 2.3
Coal 5.7 0.6 - 5.3 - 11.9 - 1.0 0.7 0.7 0.5 - 1.7 - 3.3 - 0.2
Oil 1.5 - 0.7 - 1.0 - 6.0 5.4 3.3 1.2 1.2 1.1 0.2 2.4
Gas 4.4 16.2 - 3.1 1.1 4.5 - 1.1 - 1.5 - 0.4 4.1 4.4 1.1
Nuclear 6.5 3.9 - 14.1 14.4 1.4 11.8 0.0 0.2 - 0.2 4.5 2.5
Hydro - 7.5 - 10.1 9.3 9.8 7.0 6.9 4.5 1.8 - 3.4 - 0.4 3.3
Other Renewables 16.7 8.0 3.3 4.0 12.1 12.2 10.9 11.0 10.5 7.4 11.3
Total Final Consumption
Coal (Mton) 2.7 - 2.1 - 2.2 - 4.9 4.5 1.9 0.8 0.2 0.2 - 2.7 1.5
Oil (Mbbl) 3.0 - 0.7 - 0.2 - 5.6 6.1 3.4 1.2 1.2 1.1 0.7 2.6
Gas (Bm3) 6.3 7.4 - 4.1 - 3.4 2.9 1.3 0.4 0.7 0.5 1.6 1.2
Electricity (TWh) 2.2 3.6 - 1.1 - 2.2 3.3 2.2 2.0 1.9 1.7 1.0 2.2
Heat (Mtoe) 11.8 9.9 - 1.3 0.4 1.5 3.4 3.6 3.9 1.6 6.2 2.8
Other Renewables (Mtoe) 20.4 5.5 - 2.2 - 1.4 1.4 5.1 3.4 3.8 3.2 3.0 3.4
Total (Mtoe) 3.9 1.2 - 0.9 - 4.0 4.4 2.9 1.3 1.3 1.1 0.6 2.2
Coal 3.1 - 2.6 - 1.3 - 4.6 2.8 0.9 - 0.3 - 0.4 - 0.6 - 2.6 0.5
Oil 3.1 - 0.9 - 0.6 - 5.7 5.5 3.5 1.1 1.2 1.1 0.5 2.5
Gas 6.0 9.7 - 0.6 - 0.5 5.0 3.0 1.5 1.3 1.1 3.5 2.4
Electricity 2.2 3.6 - 1.1 - 2.2 3.3 2.2 2.0 1.9 1.7 1.0 2.2
Heat 11.8 9.9 - 1.3 0.4 1.5 3.4 3.6 3.9 1.6 6.2 2.8
Other Renewables 20.4 5.5 - 2.2 - 1.4 1.4 5.1 3.4 3.8 3.2 3.0 3.4
Industry 5.0 0.7 - 0.4 - 3.8 5.0 2.1 1.3 1.2 1.1 0.6 2.1
Transport 1.2 0.4 0.0 - 9.4 4.9 6.2 0.9 0.9 0.8 - 0.5 2.7
Buildings 3.1 3.5 - 3.1 0.5 2.1 2.3 1.6 1.6 1.4 1.6 1.8
Energy Demand by Sector - BAU Scenario
(Mtoe)
CAGR (%)
2017 2018 2019 2020p 2021e 2022e 2023e 2024e 2025e 15-20 20-25
Industry 142.5 143.5 142.9 137.4 144.3 147.4 149.3 151.2 152.8 0.6 2.1
Coal 32.8 32.0 31.8 30.3 31.1 31.4 31.3 31.2 31.0 - 2.4 0.4
Oil 69.8 69.3 69.2 66.3 70.7 72.3 73.3 74.4 75.4 1.3 2.6
Gas 9.4 11.1 11.4 11.4 12.1 12.5 12.8 13.0 13.2 6.1 2.9
Electricity 23.8 24.4 24.1 23.1 24.1 24.7 25.2 25.7 26.2 0.2 2.5
Heat - - - - - - - -
Other Renewables 6.6 6.7 6.4 6.2 6.3 6.5 6.7 6.9 7.0 1.6 2.5
Transport 42.8 43.0 43.0 38.9 40.8 43.4 43.8 44.2 44.5 - 0.5 2.7
Coal - - - - - - - -
Oil 40.9 40.8 40.8 36.9 38.7 41.2 41.5 41.9 42.2 - 0.5 2.7
Gas 1.3 1.2 1.2 1.1 1.2 1.2 1.2 1.1 1.1 - 2.9 0.6
Electricity 0.2 0.3 0.3 0.2 0.2 0.3 0.3 0.3 0.3 4.3 7.0
Heat - - - - - - - -
Other Renewables 0.4 0.7 0.7 0.7 0.7 0.8 0.8 0.8 0.9 9.3 4.5
Buildings* 45.3 46.9 45.5 45.7 46.7 47.7 48.5 49.3 50.0 1.6 1.8
Coal 0.5 0.4 0.3 0.2 0.3 0.3 0.3 0.3 0.3 - 18.5 4.5
Oil 7.2 6.8 6.1 6.3 6.0 6.0 6.0 6.0 6.0 - 1.5 - 0.9
Gas 14.0 14.7 14.2 14.2 14.8 15.2 15.4 15.6 15.8 2.2 2.1
Electricity 19.6 20.6 20.5 20.5 20.9 21.3 21.7 22.0 22.4 2.0 1.8
Heat 2.4 2.7 2.6 2.7 2.7 2.8 2.9 3.0 3.0 6.2 2.8
Other Renewables 1.6 1.7 1.8 1.9 1.9 2.1 2.2 2.4 2.5 5.9 5.7
Transform 140.8 147.1 143.1 138.4 143.0 146.7 150.1 153.3 155.6 0.2 2.4
Coal 52.8 54.2 50.1 41.8 40.2 40.5 41.0 41.5 40.5 - 3.7 - 0.6
Oil 1.5 1.7 1.2 0.8 0.8 0.6 0.6 0.6 0.7 - 17.8 - 4.9
Gas 46.2 53.2 50.6 50.5 52.3 51.1 50.0 49.5 51.6 3.4 0.4
Nuclear 31.6 28.4 31.1 34.1 36.5 39.0 40.7 41.5 40.1 - 0.4 3.3
Hydro 1.5 1.5 1.3 1.5 1.5 1.7 1.7 1.7 1.7 4.5 2.5
Renewables 7.2 8.0 8.8 9.6 11.7 13.8 16.0 18.4 21.1 12.9 17.0
* include residential, commercial, public∙etc usage
Coal - BAU Scenario
(Mton)
CAGR (%)
2017 2018 2019 2020p 2021e 2022e 2023e 2024e 2025e 15-20 20-25 Total Coal Demand 139.8 141.1 133.0 116.6 116.0 117.3 118.6 119.5 117.8 - 2.9 0.2
Transform 89.4 91.8 84.8 70.7 68.1 68.4 69.4 70.2 68.4 - 3.0 - 0.7
Power Generation 89.4 91.8 84.8 70.7 68.1 68.4 69.4 70.2 68.4 - 3.0 - 0.7
Heat - - - - - - - -
Gas Manufacture - - - - - - - -
Total Final Consumption 50.4 49.3 48.2 45.8 47.9 48.8 49.2 49.3 49.4 - 2.7 1.5
Industry 49.3 48.4 47.6 45.3 47.4 48.4 48.8 49.0 49.1 - 2.4 1.6
Transport - - - - - - - -
Buildings 1.1 0.9 0.6 0.5 0.5 0.4 0.4 0.3 0.3 - 19.1 - 9.6
-
Consumption by products
Anthracite 8.3 9.3 7.9 7.2 7.7 7.8 7.8 7.7 7.7 - 7.4 1.4
Bituminous 131.5 131.8 125.1 109.4 108.3 109.5 110.8 111.8 110.1 - 2.6 0.1
Iron making 36.3 34.6 35.0 33.8 35.4 36.3 36.6 36.9 37.0 - 1.7 1.8
Cement 4.2 3.7 4.0 3.4 3.2 3.1 3.0 3.0 3.0 - 6.0 - 2.6
Power Generation 88.3 90.8 83.6 69.8 67.4 67.8 68.8 69.6 67.9 - 2.8 - 0.5
Oil - BAU Scenario
(Mbbl)
CAGR (%)
2017 2018 2019 2020p 2021e 2022e 2023e 2024e 2025e 15-20 20-25
Total Oil Demand 937.1 931.8 927.1 873.3 925.7 956.0 967.4 979.1 989.9 0.5 2.5
Transform 10.5 11.7 8.6 6.2 5.9 4.9 5.0 5.1 5.1 - 15.8 - 3.8
Power Generation 8.1 8.6 5.7 3.4 2.3 1.1 1.1 1.1 1.1 - 23.4 - 20.3
Heat 1.2 1.1 1.7 1.7 2.4 2.6 2.7 2.8 2.8 17.1 11.0
Gas Manufacture 1.2 2.0 1.2 1.1 1.2 1.2 1.2 1.2 1.2 2.0 0.9
Total Final Consumption 926.6 920.0 918.5 867.1 919.8 951.2 962.4 974.1 984.8 0.7 2.6
Industry 567.0 564.1 566.2 543.0 580.9 594.3 603.2 612.4 621.0 1.6 2.7
Transport 303.2 302.3 303.2 273.9 287.8 305.9 308.4 311.0 313.2 - 0.7 2.7
Buildings 56.4 53.7 49.1 50.1 51.1 50.9 50.8 50.7 50.6 - 1.3 0.2
Consumption by products
Gasoline 79.6 79.7 82.7 81.0 84.2 86.0 86.8 87.6 88.2 1.1 1.7
Diesel(includingTransformation) 165.9 164.1 166.9 159.0 165.9 169.1 170.9 172.9 174.4 0.7 1.9 Kerosene(includingTransformation) 19.0 18.9 17.1 17.0 17.2 16.9 16.9 16.8 16.8 0.9 - 0.2 B-C (including Transformation) 35.8 33.7 24.0 23.7 21.7 20.9 20.4 20.0 19.9 - 9.1 - 3.5
Jet Oil 38.2 39.9 38.8 21.7 25.6 39.0 39.5 39.9 40.4 - 8.8 13.2
LPG (including Transformation) 105.1 109.4 122.1 122.4 133.8 138.4 140.1 141.7 142.8 6.4 3.1
Naphtha 458.4 451.2 438.6 405.3 439.2 447.4 454.0 461.0 467.6 - 0.3 2.9
Other Non-Energy 35.1 35.1 36.7 43.3 38.1 38.3 38.8 39.2 39.8 5.1 - 1.6
Gas - BAU Scenario
CAGR (%)
2017 2018 2019 2020p 2021e 2022e 2023e 2024e 2025e 15-20 20-25 Total Gas Demand (Mton) 36.4 42.3 41.0 41.4 43.3 42.8 42.2 42.0 43.8 4.4 1.1
Transform 35.3 40.7 38.8 38.7 40.0 39.1 38.2 37.9 39.5 3.4 0.4
Power Generation 15.2 18.5 17.9 18.6 19.5 18.3 17.2 16.7 18.1 5.5 - 0.5
Heat 1.7 2.3 1.9 1.8 1.8 1.8 1.9 2.0 2.0 2.9 2.4
Gas Manufacture 18.5 20.0 18.9 18.3 18.8 19.0 19.1 19.3 19.4 1.5 1.2
Industry 1.0 1.6 2.2 2.8 3.3 3.7 4.0 4.1 4.3 33.4 9.1
City Gas (Bm3) 22.6 24.3 23.3 22.5 23.1 23.4 23.5 23.7 23.8 1.6 1.2
Industry* 7.8 8.8 8.3 7.6 7.6 7.5 7.4 7.4 7.4 0.7 - 0.6
Transport 1.2 1.2 1.2 1.1 1.1 1.1 1.1 1.1 1.1 - 2.7 0.6
Buildings 13.6 14.3 13.8 13.8 14.4 14.8 15.0 15.1 15.3 2.4 2.1
* exclude industrial LNG usage
Electricity - BAU Scenario
(TWh)
CAGR (%)
2017 2018 2019 2020p 2021e 2022e 2023e 2024e 2025e 15-20 20-25
Net Electricity Demand 553.5 570.6 563.0 552.1 577.4 590.3 602.0 613.4 624.0 0.9 2.5
Own use and Losses 45.8 44.5 42.5 42.8 51.2 52.4 53.5 54.6 55.5 - 0.7 5.3
Total Final Consumption 507.7 526.1 520.5 509.3 526.2 537.9 548.4 558.8 568.5 1.0 2.2
Industry 276.7 283.7 279.8 268.7 279.8 287.3 293.2 299.0 304.3 0.2 2.5
Transport 2.8 3.0 2.9 2.7 2.9 3.1 3.3 3.6 3.8 4.3 7.0
Buildings 228.3 239.5 237.8 237.8 243.5 247.5 251.9 256.2 260.3 2.0 1.8
Installed Electrical Capacity
(GW)* 116.4 118.5 124.6 128.5 135.7 140.6 148.2 154.9 159.7 5.7 4.4
Coal 36.8 37.0 37.0 36.9 38.6 39.4 41.4 42.1 40.7 6.2 2.0
Oil 4.1 4.3 3.9 2.2 2.2 1.0 1.0 1.0 1.0 - 12.3 - 13.8
Gas 37.5 37.9 39.4 41.2 41.2 41.5 42.2 43.1 45.7 5.0 2.1
Nuclear 22.5 21.9 23.3 23.3 24.7 26.1 26.8 27.3 26.0 1.4 2.2
Hydro 6.5 6.5 6.5 6.5 6.5 6.5 6.5 6.5 6.5 0.1 0.0
Other Renewables 8.9 11.0 14.6 18.5 22.5 26.2 30.3 34.9 39.7 26.9 16.5
Electricity Generation of
Power Plants* 553.5 570.6 563.0 552.1 577.4 590.3 602.0 613.4 624.0 0.9 2.5
Coal 238.8 238.4 227.4 196.3 192.7 194.7 197.5 199.8 194.8 - 0.8 - 0.2
Oil 5.3 5.7 3.3 2.3 1.6 0.7 0.7 0.7 0.7 - 41.1 - 20.1
Gas 126.0 153.5 144.4 146.1 155.6 146.2 137.7 133.2 144.4 7.7 - 0.2
Nuclear 148.4 133.5 145.9 160.2 171.4 183.2 191.3 194.7 188.1 - 0.6 3.3
Hydro 7.0 7.3 6.2 7.3 7.2 8.1 8.1 8.1 8.1 4.6 2.2
Other Renewables 28.0 32.2 35.9 40.1 48.8 57.4 66.6 76.8 87.9 14.5 17.0
Fuel Consumption of
Power Plants (Mtoe)* 114.1 117.7 115.6 111.8 115.8 119.0 122.1 125.0 127.1 - 0.1 2.6
Coal 52.8 54.2 50.1 41.8 40.2 40.5 41.0 41.5 40.5 - 3.7 - 0.6
Oil 1.2 1.3 0.8 0.5 0.3 0.2 0.2 0.2 0.2 - 24.4 - 20.2
Gas 19.8 24.2 23.4 24.3 25.4 23.9 22.5 21.8 23.6 5.5 - 0.5
Nuclear 31.6 28.4 31.1 34.1 36.5 39.0 40.7 41.5 40.1 - 0.4 3.3
Hydro 1.5 1.5 1.3 1.5 1.5 1.7 1.7 1.7 1.7 4.5 2.5
Other Renewables 7.2 8.0 8.8 9.6 11.7 13.8 16.0 18.4 21.1 12.9 17.0
* District Heat is classified by fuel type since 2014
Heat and Other Renewables - BAU Scenario
(Mtoe)
CAGR (%)
2017 2018 2019 2020p 2021e 2022e 2023e 2024e 2025e 15-20 20-25
Net Heat Demand 2.4 2.6 2.6 2.6 2.6 2.7 2.8 2.9 3.0 5.1 2.7
Own use and Losses 0.0 - 0.0 0.0 - 0.1 - 0.1 - 0.1 - 0.1 - 0.1 - 0.1 - 196.8 4.6
Total Final Consumption 2.4 2.7 2.6 2.7 2.7 2.8 2.9 3.0 3.0 6.2 2.8
Industry - - - - - - - -
Transport - - - - - - - -
Buildings 2.4 2.7 2.6 2.7 2.7 2.8 2.9 3.0 3.0 6.2 2.8
Heat Production by fuel
Coal - - - - - - - -
Oil 1.5 1.7 1.7 1.7 1.8 1.8 1.9 2.0 2.0 5.3 2.8
Gas 1.0 0.9 0.9 0.9 0.9 0.9 0.9 1.0 1.0 4.8 2.6
Nuclear - - - - - - - -
Hydro - - - - - - - -
Other Renewables - - - - - - - -
Fuel Consumption of District
Heat
Coal - - - - - - - -
Oil 0.2 0.2 0.2 0.2 0.3 0.3 0.4 0.4 0.4 13.6 10.3
Gas 2.2 2.9 2.5 2.3 2.3 2.4 2.5 2.6 2.6 3.0 2.4
Nuclear - - - - - - - -
Hydro - - - - - - - -
Other Renewables - - - - - - - -
Other Renewables 17.3 18.7 19.0 19.9 22.2 24.9 27.4 30.2 33.2 7.2 10.7
Hydro 1.5 1.5 1.3 1.5 1.5 1.7 1.7 1.7 1.7 4.5 2.5
Transform 7.2 8.0 8.8 9.6 11.7 13.8 16.0 18.4 21.1 12.9 17.0
Total Final Consumption 8.6 9.1 8.9 8.8 8.9 9.4 9.7 10.1 10.4 3.0 3.4
Industry 6.6 6.7 6.4 6.2 6.3 6.5 6.7 6.9 7.0 1.6 2.5
Transport 0.4 0.7 0.7 0.7 0.7 0.8 0.8 0.8 0.9 9.3 4.5
Buildings 1.6 1.7 1.8 1.9 1.9 2.1 2.2 2.4 2.5 5.9 5.7
Main Economic and Energy Indicators - HEG Scenario
GACR (%)
2017 2018 2019 2020p 2021e 2022e 2023e 2024e 2025e 15-20 20-25
Economy and Population
GDP (2010 trillion won) 1 760.8 1 812.0 1 849.0 1 831.2 1 904.7 1 961.8 2 018.7 2 075.2 2 133.4 2.0 3.1 Industrial Production(2010=100) 104.8 106.4 106.7 106.3 108.9 111.1 113.9 116.3 118.8 1.2 2.2 Crude Oil Price (Dubai, USD/bbl) 53.2 69.4 63.5 42.2 60.4 57.9 58.2 62.9 67.4 - 3.6 9.8
Working Days 269.5 270.0 272.5 275.0 276.0 275.5 274.5 272.5 274.5 0.1 - 0.0
Population (million) 51.4 51.6 51.7 51.8 51.8 51.8 51.9 51.9 51.9 0.3 0.0
Average Temperature (ºC) 13.1 13.0 13.5 13.3 13.4 13.2 13.2 13.2 13.2 - 0.3 - 0.2 Cooling Degree days 132.7 209.0 120.4 92.5 104.1 104.1 104.1 104.1 104.1 2.4 2.4 Heating Degree days 2 517.1 2 597.8 2 342.9 2 382.7 2 358.6 2 452.7 2 452.7 2 467.6 2 452.7 0.7 0.6
Energy Indicators
Total Primary Energy Demand (Mtoe) 302.1 307.6 303.1 290.8 304.3 314.1 320.1 325.7 330.3 0.3 2.6 Energy Intensity (toe/million won) 0.172 0.170 0.164 0.159 0.160 0.160 0.159 0.157 0.155 - 1.7 - 0.5 TPED/capita (toe/capita) 5.881 5.960 5.862 5.617 5.872 6.058 6.171 6.278 6.363 - 0.0 2.5 Electricity Generation (TWh) 553.5 570.6 563.0 552.1 578.8 592.7 605.2 617.6 629.2 0.9 2.6 Electricity Generation/capita (MWh/capita) 10.8 11.1 10.9 10.7 11.2 11.4 11.7 11.9 12.1 0.6 2.6 Electricity Demand/capita (MWh/capita) 9.9 10.2 10.1 9.8 10.2 10.4 10.6 10.8 11.0 0.7 2.3
Energy Demand - HEG Scenario
GACR (%)
2017 2018 2019 2020p 2021e 2022e 2023e 2024e 2025e 15-20 20-25
Total Primary Energy Supply
Coal (Mton) 139.8 141.1 133.0 116.6 116.4 118.0 119.6 120.6 119.1 - 2.9 0.4
Oil (Mbbl) 937.1 931.8 927.1 873.3 930.1 963.6 977.7 991.6 1 004.9 0.5 2.8
Gas (Bm3) 36.4 42.3 41.0 41.4 43.5 43.2 42.8 42.8 44.7 4.4 1.5
Hydro (TWh) 7.0 7.3 6.2 7.1 7.2 8.1 8.1 8.1 8.1 4.3 2.5
Nuclear (TWh) 148.4 133.5 145.9 160.2 171.4 183.2 191.3 194.7 188.1 - 0.6 3.3 Other Renewables (Mtoe) 15.8 17.1 17.7 18.4 20.6 23.2 25.7 28.5 31.5 7.4 11.4
Total (Mtoe) 302.1 307.6 303.1 290.8 304.3 314.1 320.1 325.7 330.3 0.3 2.6
Coal 86.2 86.7 82.1 72.4 71.9 72.6 73.2 73.7 72.5 - 3.3 0.0
Oil 119.4 118.5 117.3 110.3 116.8 121.1 122.8 124.5 126.1 0.2 2.7
Gas 47.5 55.2 53.5 54.1 56.9 56.5 55.9 55.9 58.4 4.4 1.5
Nuclear 1.5 1.5 1.3 1.5 1.5 1.7 1.7 1.7 1.7 4.5 2.5
Hydro 31.6 28.4 31.1 34.1 36.5 39.0 40.7 41.5 40.1 - 0.4 3.3
Other Renewables 15.8 17.1 17.7 18.4 20.6 23.2 25.7 28.5 31.5 7.4 11.4
Total Final Consumption
Coal (Mton) 50.4 49.3 48.2 45.8 48.3 49.5 50.1 50.4 50.7 - 2.7 2.0
Oil (Mbbl) 926.6 920.0 918.5 867.1 924.3 958.8 972.8 986.6 999.8 0.7 2.9
Gas (Bm3) 22.6 24.3 23.3 22.5 23.2 23.5 23.6 23.8 24.0 1.6 1.3
Electricity (TWh) 507.7 526.1 520.5 509.3 527.5 540.0 551.4 562.6 573.2 1.0 2.4
Heat (Mtoe) 2.4 2.7 2.6 2.7 2.7 2.8 2.9 3.0 3.1 6.2 2.8
Other Renewables (Mtoe) 8.6 9.1 8.9 8.8 8.9 9.4 9.7 10.1 10.5 3.0 3.5
Total (Mtoe) 230.6 233.4 231.4 222.0 232.9 240.3 244.0 247.5 250.7 0.6 2.5
Coal 33.4 32.5 32.1 30.6 31.6 32.1 32.2 32.1 32.1 - 2.6 1.0
Oil 117.9 116.8 116.1 109.5 116.0 120.5 122.2 123.8 125.4 0.5 2.8
Gas 24.6 27.0 26.9 26.7 28.2 29.1 29.6 30.0 30.4 3.5 2.6
Electricity 43.7 45.2 44.8 43.8 45.4 46.4 47.4 48.4 49.3 1.0 2.4
Heat 2.4 2.7 2.6 2.7 2.7 2.8 2.9 3.0 3.1 6.2 2.8
Other Renewables 8.6 9.1 8.9 8.8 8.9 9.4 9.7 10.1 10.5 3.0 3.5
Industry 142.5 143.5 142.9 137.4 145.1 148.7 151.3 153.6 155.8 0.6 2.5
Transport 42.8 43.0 43.0 38.9 41.0 43.7 44.0 44.3 44.6 - 0.5 2.8
Buildings 45.3 46.9 45.5 45.7 46.8 47.9 48.7 49.5 50.3 1.6 1.9
Energy Demand - HEG Scenario
(yoy, %)
GACR (%)
2017 2018 2019 2020p 2021e 2022e 2023e 2024e 2025e 15-20 20-25
Total Primary Energy Supply
Coal (Mton) 8.1 0.9 - 5.7 - 12.4 - 0.2 1.4 1.3 0.9 - 1.3 - 2.9 0.4
Oil (Mbbl) 1.7 - 0.6 - 0.5 - 5.8 6.5 3.6 1.5 1.4 1.3 0.5 2.8
Gas (Bm3) 4.3 16.2 - 3.1 1.1 5.1 - 0.7 - 1.1 0.0 4.4 4.4 1.5
Hydro (TWh) 5.5 3.9 - 14.1 14.4 1.4 11.8 0.0 0.2 - 0.2 4.3 2.5
Nuclear (TWh) - 8.4 - 10.1 9.3 9.8 7.0 6.9 4.5 1.8 - 3.4 - 0.6 3.3
Other Renewables (Mtoe) 16.7 8.0 3.3 4.0 12.3 12.3 10.9 11.0 10.5 7.4 11.4
Total (Mtoe) 2.8 1.8 - 1.5 - 4.0 4.6 3.2 1.9 1.8 1.4 0.3 2.6
Coal 5.7 0.6 - 5.3 - 11.9 - 0.6 1.0 0.9 0.6 - 1.5 - 3.3 0.0
Oil 1.5 - 0.7 - 1.0 - 6.0 5.9 3.7 1.4 1.4 1.3 0.2 2.7
Gas 4.4 16.2 - 3.1 1.1 5.1 - 0.7 - 1.1 0.0 4.4 4.4 1.5
Nuclear 6.5 3.9 - 14.1 14.4 1.4 11.8 0.0 0.2 - 0.2 4.5 2.5
Hydro - 7.5 - 10.1 9.3 9.8 7.0 6.9 4.5 1.8 - 3.4 - 0.4 3.3
Other Renewables 16.7 8.0 3.3 4.0 12.3 12.3 10.9 11.0 10.5 7.4 11.4
Total Final Consumption
Coal (Mton) 2.7 - 2.1 - 2.2 - 4.9 5.3 2.6 1.2 0.6 0.5 - 2.7 2.0
Oil (Mbbl) 3.0 - 0.7 - 0.2 - 5.6 6.6 3.7 1.5 1.4 1.3 0.7 2.9
Gas (Bm3) 6.3 7.4 - 4.1 - 3.4 3.3 1.4 0.5 0.9 0.7 1.6 1.3
Electricity (TWh) 2.2 3.6 - 1.1 - 2.2 3.6 2.4 2.1 2.0 1.9 1.0 2.4
Heat (Mtoe) 11.8 9.9 - 1.3 0.4 1.1 3.6 3.7 4.0 1.7 6.2 2.8
Other Renewables (Mtoe) 20.4 5.5 - 2.2 - 1.4 1.8 5.3 3.5 3.9 3.3 3.0 3.5
Total (Mtoe) 3.9 1.2 - 0.9 - 4.0 4.9 3.2 1.5 1.4 1.3 0.6 2.5
Coal 3.1 - 2.6 - 1.3 - 4.6 3.5 1.5 0.2 - 0.1 - 0.3 - 2.6 1.0
Oil 3.1 - 0.9 - 0.6 - 5.7 6.0 3.8 1.4 1.4 1.3 0.5 2.8
Gas 6.0 9.7 - 0.6 - 0.5 5.5 3.1 1.7 1.5 1.3 3.5 2.6
Electricity 2.2 3.6 - 1.1 - 2.2 3.6 2.4 2.1 2.0 1.9 1.0 2.4
Heat 11.8 9.9 - 1.3 0.4 1.1 3.6 3.7 4.0 1.7 6.2 2.8
Other Renewables 20.4 5.5 - 2.2 - 1.4 1.8 5.3 3.5 3.9 3.3 3.0 3.5
Industry 5.0 0.7 - 0.4 - 3.8 5.6 2.5 1.7 1.6 1.4 0.6 2.5
Transport 1.2 0.4 0.0 - 9.4 5.4 6.6 0.7 0.7 0.6 - 0.5 2.8
Buildings 3.1 3.5 - 3.1 0.5 2.4 2.4 1.7 1.8 1.5 1.6 1.9
Energy Demand by Sector - HEG Scenario
(Mtoe)
GACR (%)
2017 2018 2019 2020p 2021e 2022e 2023e 2024e 2025e 15-20 20-25
Industry 142.5 143.5 142.9 137.4 145.1 148.7 151.3 153.6 155.8 0.6 2.5
Coal 32.8 32.0 31.8 30.3 31.4 31.8 31.9 31.8 31.8 - 2.4 0.9
Oil 69.8 69.3 69.2 66.3 71.1 72.9 74.4 75.8 77.2 1.3 3.1
Gas 9.4 11.1 11.4 11.4 12.2 12.7 13.0 13.2 13.4 6.1 3.3
Electricity 23.8 24.4 24.1 23.1 24.1 24.8 25.3 25.9 26.3 0.2 2.7
Heat - - - - - - - -
Other Renewables 6.6 6.7 6.4 6.2 6.3 6.5 6.7 6.9 7.1 1.6 2.7
Transport 42.8 43.0 43.0 38.9 41.0 43.7 44.0 44.3 44.6 - 0.5 2.8
Coal - - - - - - - -
Oil 40.9 40.8 40.8 36.9 38.9 41.5 41.8 42.1 42.3 - 0.5 2.8
Gas 1.3 1.2 1.2 1.1 1.2 1.2 1.2 1.1 1.1 - 2.9 0.6
Electricity 0.2 0.3 0.3 0.2 0.2 0.3 0.3 0.3 0.3 4.3 7.0
Heat - - - - - - - -
Other Renewables 0.4 0.7 0.7 0.7 0.7 0.8 0.8 0.8 0.9 9.3 4.4
Buildings* 45.3 46.9 45.5 45.7 46.8 47.9 48.7 49.5 50.3 1.6 1.9
Coal 0.5 0.4 0.3 0.2 0.3 0.3 0.3 0.3 0.3 - 18.5 4.8
Oil 7.2 6.8 6.1 6.3 6.1 6.0 6.0 6.0 6.0 - 1.5 - 1.0
Gas 14.0 14.7 14.2 14.2 14.9 15.3 15.4 15.6 15.8 2.2 2.2
Electricity 19.6 20.6 20.5 20.5 21.0 21.4 21.8 22.2 22.6 2.0 2.0
Heat 2.4 2.7 2.6 2.7 2.7 2.8 2.9 3.0 3.1 6.2 2.8
Other Renewables 1.6 1.7 1.8 1.9 1.9 2.1 2.2 2.4 2.5 5.9 5.9
Transform 140.8 147.1 143.1 138.4 143.3 147.2 150.7 154.2 156.6 0.2 2.5
Coal 52.8 54.2 50.1 41.8 40.2 40.5 41.0 41.5 40.5 - 3.7 - 0.6
Oil 1.5 1.7 1.2 0.8 0.8 0.6 0.6 0.6 0.7 - 17.8 - 4.9
Gas 46.2 53.2 50.6 50.5 52.6 51.6 50.6 50.4 52.7 3.4 0.8
Nuclear 31.6 28.4 31.1 34.1 36.5 39.0 40.7 41.5 40.1 - 0.4 3.3
Hydro 1.5 1.5 1.3 1.5 1.5 1.7 1.7 1.7 1.7 4.5 2.5
Renewables 7.2 8.0 8.8 9.6 11.7 13.8 16.0 18.4 21.1 12.9 17.0
* include residential, commercial, public∙etc usage
Coal - HEG Scenario
(Mton)
GACR (%)
2017 2018 2019 2020p 2021e 2022e 2023e 2024e 2025e 15-20 20-25 Total Coal Demand 139.8 141.1 133.0 116.6 116.4 118.0 119.6 120.6 119.1 - 2.9 0.4
Transform 89.4 91.8 84.8 70.7 68.1 68.4 69.4 70.2 68.4 - 3.0 - 0.7
Power Generation 89.4 91.8 84.8 70.7 68.1 68.4 69.4 70.2 68.4 - 3.0 - 0.7
Heat - - - - - - - -
Gas Manufacture - - - - - - - -
Total Final Consumption 50.4 49.3 48.2 45.8 48.3 49.5 50.1 50.4 50.7 - 2.7 2.0
Industry 49.3 48.4 47.6 45.3 47.8 49.1 49.8 50.1 50.4 - 2.4 2.1
Transport - - - - - - - -
Buildings 1.1 0.9 0.6 0.5 0.5 0.4 0.4 0.3 0.3 - 19.1 - 9.6
-
Consumption by products
Anthracite 8.3 9.3 7.9 7.2 7.7 7.9 7.9 7.9 7.9 - 7.4 1.9
Bituminous 131.5 131.8 125.1 109.4 108.7 110.1 111.6 112.7 111.2 - 2.6 0.3
Iron making 36.3 34.6 35.0 33.8 35.7 36.9 37.5 37.8 38.0 - 1.7 2.4
Cement 4.2 3.7 4.0 3.4 3.2 3.1 3.0 3.0 3.0 - 6.0 - 2.6
Power Generation 88.3 90.8 83.6 69.8 67.4 67.8 68.8 69.6 67.9 - 2.8 - 0.5
Oil - HEG Scenario
(Mbbl)
GACR (%)
2017 2018 2019 2020p 2021e 2022e 2023e 2024e 2025e 15-20 20-25
Total Oil Demand 937.1 931.8 927.1 873.3 930.1 963.6 977.7 991.6 1 004.9 0.5 2.8
Transform 10.5 11.7 8.6 6.2 5.9 4.9 5.0 5.1 5.1 - 15.8 - 3.7
Power Generation 8.1 8.6 5.7 3.4 2.3 1.1 1.1 1.1 1.1 - 23.4 - 20.3
Heat 1.2 1.1 1.7 1.7 2.4 2.6 2.7 2.8 2.8 17.1 11.0
Gas Manufacture 1.2 2.0 1.2 1.1 1.2 1.2 1.2 1.2 1.2 2.0 1.1
Total Final Consumption 926.6 920.0 918.5 867.1 924.3 958.8 972.8 986.6 999.8 0.7 2.9
Industry 567.0 564.1 566.2 543.0 584.0 599.6 611.9 623.9 635.7 1.6 3.2
Transport 303.2 302.3 303.2 273.9 289.1 308.3 310.2 312.2 313.7 - 0.7 2.7
Buildings 56.4 53.7 49.1 50.1 51.2 50.8 50.7 50.5 50.4 - 1.3 0.1
Consumption by products
Gasoline 79.6 79.7 82.7 81.0 84.2 86.4 87.1 87.8 88.2 1.1 1.7
Diesel(including Transformation) 165.9 164.1 166.9 159.0 167.0 170.7 171.9 173.1 174.0 0.7 1.8 Kerosene(includingTransformation) 19.0 18.9 17.1 17.0 17.2 16.9 16.9 16.8 16.8 0.9 - 0.2 B-C (including Transformation) 35.8 33.7 24.0 23.7 21.7 20.9 20.4 20.0 19.9 - 9.1 - 3.5
Jet Oil 38.2 39.9 38.8 21.7 25.8 39.5 40.1 40.8 41.4 - 8.8 13.8
LPG (including Transformation) 105.1 109.4 122.1 122.4 134.3 139.1 141.2 143.2 144.8 6.4 3.4
Naphtha 458.4 451.2 438.6 405.3 441.6 451.6 460.9 470.1 479.3 - 0.3 3.4
Other Non-Energy 35.1 35.1 36.7 43.3 38.3 38.6 39.3 39.8 40.6 5.1 - 1.3
Gas - HEG Scenario
GACR (%)
2017 2018 2019 2020p 2021e 2022e 2023e 2024e 2025e 15-20 20-25
Total Gas Demand (Mton) 36.4 42.3 41.0 41.4 43.5 43.2 42.8 42.8 44.7 4.4 1.5
Transform 35.3 40.7 38.8 38.7 40.2 39.5 38.8 38.6 40.3 3.4 0.8
Power Generation 15.2 18.5 17.9 18.6 19.6 18.6 17.6 17.2 18.8 5.5 0.2
Heat 1.7 2.3 1.9 1.8 1.8 1.8 1.9 2.0 2.0 2.9 2.4
Gas Manufacture 18.5 20.0 18.9 18.3 18.9 19.1 19.2 19.4 19.6 1.5 1.4
Industry 1.0 1.6 2.2 2.8 3.3 3.7 4.0 4.2 4.4 33.4 9.5
City Gas (Bm3) 22.6 24.3 23.3 22.5 23.2 23.5 23.6 23.8 24.0 1.6 1.3
Industry* 7.8 8.8 8.3 7.6 7.6 7.6 7.5 7.5 7.5 0.7 - 0.2
Transport 1.2 1.2 1.2 1.1 1.1 1.1 1.1 1.1 1.1 - 2.7 0.6
Buildings 13.6 14.3 13.8 13.8 14.4 14.8 15.0 15.2 15.4 2.4 2.2
* exclude industrial LNG usage
Electricity - HEG Scenario
(TWh)
GACR (%)
2017 2018 2019 2020p 2021e 2022e 2023e 2024e 2025e 15-20 20-25
Net Electricity Demand 553.5 570.6 563.0 552.1 578.8 592.7 605.2 617.6 629.2 0.9 2.6
Own use and Losses 45.8 44.5 42.5 42.8 51.3 52.6 53.8 55.0 56.0 - 0.7 5.5
Total Final Consumption 507.7 526.1 520.5 509.3 527.5 540.0 551.4 562.6 573.2 1.0 2.4
Industry 276.7 283.7 279.8 268.7 280.3 288.2 294.4 300.6 306.3 0.2 2.7
Transport 2.8 3.0 2.9 2.7 2.9 3.1 3.3 3.6 3.8 4.3 7.0
Buildings 228.3 239.5 237.8 237.8 244.2 248.7 253.6 258.5 263.1 2.0 2.0
Installed Electrical Capacity
(GW)* 116.4 118.5 124.6 128.5 135.7 140.6 148.2 154.9 159.7 5.7 4.4
Coal 36.8 37.0 37.0 36.9 38.6 39.4 41.4 42.1 40.7 6.2 2.0
Oil 4.1 4.3 3.9 2.2 2.2 1.0 1.0 1.0 1.0 - 12.3 - 13.8
Gas 37.5 37.9 39.4 41.2 41.2 41.5 42.2 43.1 45.7 5.0 2.1
Nuclear 22.5 21.9 23.3 23.3 24.7 26.1 26.8 27.3 26.0 1.4 2.2
Hydro 6.5 6.5 6.5 6.5 6.5 6.5 6.5 6.5 6.5 0.1 0.0
Other Renewables 8.9 11.0 14.6 18.5 22.5 26.2 30.3 34.9 39.7 26.9 16.5
Electricity Generation of
Power Plants* 553.5 570.6 563.0 552.1 578.8 592.7 605.2 617.6 629.2 0.9 2.6
Coal 238.8 238.4 227.4 196.3 192.7 194.7 197.5 199.8 194.8 - 0.8 - 0.2
Oil 5.3 5.7 3.3 2.3 1.6 0.7 0.7 0.7 0.7 - 41.1 - 20.1
Gas 126.0 153.5 144.4 146.1 157.0 148.6 141.0 137.4 149.6 7.7 0.5
Nuclear 148.4 133.5 145.9 160.2 171.4 183.2 191.3 194.7 188.1 - 0.6 3.3
Hydro 7.0 7.3 6.2 7.3 7.2 8.1 8.1 8.1 8.1 4.6 2.2
Other Renewables 28.0 32.2 35.9 40.1 48.8 57.4 66.6 76.8 87.9 14.5 17.0
Fuel Consumption of
Power Plants (Mtoe)* 114.1 117.7 115.6 111.8 116.0 119.4 122.7 125.7 128.0 - 0.1 2.7
Coal 52.8 54.2 50.1 41.8 40.2 40.5 41.0 41.5 40.5 - 3.7 - 0.6
Oil 1.2 1.3 0.8 0.5 0.3 0.2 0.2 0.2 0.2 - 24.4 - 20.2
Gas 19.8 24.2 23.4 24.3 25.6 24.2 23.0 22.5 24.5 5.5 0.2
Nuclear 31.6 28.4 31.1 34.1 36.5 39.0 40.7 41.5 40.1 - 0.4 3.3
Hydro 1.5 1.5 1.3 1.5 1.5 1.7 1.7 1.7 1.7 4.5 2.5
Other Renewables 7.2 8.0 8.8 9.6 11.7 13.8 16.0 18.4 21.1 12.9 17.0
* District Heat is classified by fuel type since 2014
Heat and Other Renewables - HEG Scenario
(Mtoe)