의학석사 학위논문
Population pharmacokinetic analysis of propofol in underweight patients under general anesthesia
울 산 대 학 교 대 학 원 의 학 과
윤 혜 주
[UCI]I804:48009-200000007307 [UCI]I804:48009-200000007307
Population pharmacokinetic analysis of propofol in underweight patients under general anesthesia
지 도 교 수 최 병 문
이 논문을 의학석사 학위 논문으로 제출함
2017 년 12 월
울 산 대 학 교 대 학 원 의 학 과
윤 혜 주
윤혜주의 의학석사학위 논문을 인준함
심사위원 노규정 인 심사위원 최병문 인 심사위원 이용헌 인
울 산 대 학 교 대 학 원
2017 년 12 월
Summary
Background: We previously found that the modified Marsh and Schnider models consistently produced negatively and positively biased predictions in underweight patients, respectively. We aimed to develop a new pharmacokinetic model of propofol in underweight patients.
Methods: Twenty underweight (body mass index [BMI] < 18.5 kg m–2) patients aged 20-68 years were given an intravenous bolus of propofol (2 mg kg–1) for the induction of anaesthesia. Anaesthesia was maintained with a zero-order infusion (8 mg kg–1 h–1) of propofol and target-controlled infusion (TCI) of remifentanil. Arterial blood was sampled at preset intervals. A population pharmacokinetic analysis was performed using nonlinear mixed effects modelling. The time to peak effect (tpeak, maximally reduced bispectral index) was measured in 28 additional underweight patients receiving 2 mg kg–1propofol.
Results: In total, 455 plasma concentration measurements from the 20 patients were used to characterize the pharmacokinetics of propofol. A three-compartment mammillary model well described the propofol concentration time course. BMI and lean body mass (LBM) calculated using the Janmahasatian formula were significant covariates for the rapid peripheral volume of distribution and for the clearance of the final pharmacokinetic model of propofol, respectively. The parameter estimates were as follows: V1(L) = 2.02, V2(L) = 12.9(BMI/18.5), V3(L) = 139, Cl(L/min) = 1.66(LBM/40), Q1(L/min) = 1.44, Q2(L/min) = 0.87 + 0.0189´(LBM-40). The median tpeakof propofol was 1.32 min (n=48).
Conclusion: This study suggests that this three-compartment mammillary model can be used to administer propofol via target effect-site concentration-controlled infusion in underweight patients.
Keywords: pharmacokinetics, propofol, underweight
목차
영문요약··· i
표,그림목차··· iii
서론··· 1
연구방법··· 3
결과··· 7
고찰··· 19
참고문헌··· 22
국문요약··· 26
표, 그림 목차
Table 1. Characteristics of the study patients··· 8 Table S1. Parameter estimates (RSE, % CV) of competing basic and covariate pharmacokinetic models of propofol in underweight patients ···10 Table 2. Population pharmacokinetic parameter estimates, inter-individual variability, and median parameter values (2.5-97.5%) of the non-parametric bootstrap replicates of the basic and final pharmacokinetic models of propofol in underweight patients ···12
Figure. 1. Plasma concentration of propofol over time (A) and goodness-of-fit plots of the final pharmacokinetic model of propofol in underweight patients (n = 20). B: population- predicted plasma concentration of propofol vs. measured plasma concentration of propofol.
C: conditional weighted residuals (CWRES) over time. D: population-predicted plasma concentration of propofol vs. CWRES ··· 9 Figure. S1. Relationship of individual Bayesian predicted values of V2 versus BMI (A), Cl versus LBM (B) and Q2 versus LBM (C), derived from the results of the basic pharmacokinetic model ··· 11 Figure. 2. Predictive checks of the final pharmacokinetic model of propofol with the observed median (solid red line) and corresponding model-predicted 95% prediction lines (solid blue lines) ···14
Figure. 3. Time course of the bispectral index (BIS) after an intravenous bolus injection of propofol 2 mg kg–1···16 Figure. 4. Simulated cumulative doses (A, C) and infusion rates (B, D) over time to maintain a target plasma (A, B) or effect-site (C, D) concentration of 2.5 mg ml-1 for 60 min for the modified Marsh, Schnider, Choi and Eleveld models in a hypothetical underweight patient.
···18
Introduction
An underweight status can result from malnutrition, underlying health conditions such as malignancy, and psychological factors in adults.1) 2) ‘Low body weight’ is a term used to simply describe that a person’s weight is low, whereas the definition of ‘underweight’ usually refers to a person whose weight is low for their height (body mass index [BMI] < 18.5 kg m-2).3)In a previous study, about 2.4% of patients undergoing major intra-abdominal cancer surgery were underweight.4)
The modified Marsh model and the Schnider model are two models commonly used to administer propofol viatarget-controlled infusion (TCI),5)and these two models alone have been embedded in the commercially available TCI pumps in Korea. In our previous study, the predictive performance of these two models in the target effect-site concentration (Ce) range of 2-6 μg ml-1 was evaluated in underweight patients.6) The pooled median (95%
confidence interval) biases and inaccuracies at a target Ce ≤ 3 mg ml-1were -22.6% (-28.8%
to -12.6%) and 31.9% (24.8% to 36.8%) for the modified Marsh model. These values at Ce
≥ 4 mg ml-1 were 19.8% (12.9% to 25.7%) and 36.2% (31.4% to 39.7%) for the Schnider model.6) The clinically acceptable range for pooled inaccuracies in pharmacokinetic predictions of propofol is known to be approximately 20-30%.7)-9) Those of the modified Marsh and Schnider models failed to meet these criteria within a specific target Ce range.
Also, the modified Marsh and Schnider models consistently produced negatively and positively biased predictions, respectively. This may suggest that use of the modified Marsh and Schnider models can lead to inadvertent underdosing and overdosing of propofol in underweight patients. In another retrospective study of ours, general anaesthesia was maintained at a propofol target Ceof 2.5-3 μg ml-1using the modified Marsh model, and the amount of intravenous midazolam and mean infusion rate of remifentanil during anaesthesia were significantly higher in underweight patients than in normal weight patients.10) Unfortunately, the Eleveld model, performed for a wide range of patient groups and clinical conditions,11) showed similar predictive performance to the modified Marsh and Schnider models.6)
The aim of this study was to develop a new pharmacokinetic model for TCI of propofol to underweight patients. In addition, the time to peak effect for calculating the blood brain
equilibration rate constant (ke0) was measured in another group underweight patients.
Methods
Investigation drug
Propofol, formulated in a mixture of medium- and long-chain triglycerides (Propofol- MCT/LCT 1%, Freefol-MCT®; Daewon Pharmaceutical Co Ltd, Seoul, Korea), was used in this study.
Patient population
This prospective clinical trial was conducted from September 2015 to April 2016. The study protocol was approved by the Institutional Review Board of Asan Medical Centre (2015-0957, Seoul, Korea) and registered on an international clinical trials registry platform (http://cris.nih.go.kr; KCT0001760). Twenty American Society of Anesthesiologists Physical Status 1 or 2 underweight patients who were scheduled for elective surgery were enrolled in the pharmacokinetic model building. The patient exclusion criteria included a known allergy to propofol, a preoperative haemoglobin level < 9 g dl–1, clinically significant laboratory findings and evidence of pregnancy.
Procedure
All of the patients fasted from midnight on the day of surgery, without premedication. Once in the operating theatre, they were monitored using pulse oximetry, electrocardiography, end- tidal carbon dioxide partial pressure, non-invasive blood pressure (Carescape™ Monitor B850; GE Healthcare, Chicago, IL, USA) and the bispectral index (BIS®monitor; Covidien, Boulder, CO, USA). All data were recorded continuously until the end of anaesthesia. A 20- gauge angiocatheter was placed in the radial artery for frequent blood sampling. During pre- oxygenation using a face mask with 100% oxygen, 20 mg of lidocaine was intravenously administered prior to propofol injection. Subsequently, an intravenous bolus of propofol 2 mg kg-1 was given to patients. Five minutes later, a zero-order infusion of propofol was started at a rate of 8 mg kg–1h–1until the end of surgery and remifentanil was administered via target effect-site concentration (Ce)-controlled infusion using the Minto model.12) If necessary, midazolam was administered to maintain bispectral index (BIS) values less than 60 during anaesthesia maintenance. The target Ce of remifentanil was titrated to maintain
stable haemodynamics (systolic blood pressure > 80 mmHg and heart rate > 45 beats min-1) within the range of 2-20 ng ml-1. Tracheal intubation was facilitated by administration of rocuronium at 0.6 mg kg-1. The patients were then ventilated with oxygen in air (1:2), and the ventilation rate was adjusted to maintain an end-tidal carbon dioxide partial pressure of 35–45 mmHg. If necessary, ephedrine was administered to maintain stable haemodynamics.
Neuromuscular blockade was reversed via the administration of neostigmine and glycopyrrolate at the end of surgery.
Blood sampling and plasma concentration assay
Arterial blood samples (5 ml) were taken at preset intervals: 0, 0.5, 1, 1.5, 3 and 5 min after a bolus dose of propofol; 5, 10, 20, 40, 60, 90 and 120 min after continuous infusion of propofol; and 0, 5, 10 and 30 min and 1, 2, 6, 12 and 24 h after discontinuation of propofol infusion. Additionally, arterial blood samples were also obtained at the time to loss of consciousness (LOC) and recovery of consciousness (ROC). Time to LOC was determined every 5 s after the bolus injection of propofol viathe loss of response to a verbal command (open your eyes). Time to ROC was assessed every 30 s after discontinuation of propofol via the eyes opening in response to a verbal command.13)Each blood sample was collected in a tube containing ethylenediaminetetraacetic acid and centrifuged for 10 min at 252 × g; the plasma was stored at -70°C until required for the assay. Plasma concentrations of propofol were analysed using ultrafast lipid chromatography (Shimadzu, Kyoto, Japan) coupled with tandem mass spectrometry (API5500; SCIEX, Framingham, MA). An ACE 5 C18 column (Advanced Chromatography Technologies Ltd, Scotland) was used for chromatographic separation. The isocratic mobile phase composition was a mixture of water-acetonitrile (50:50, v/v), and a flow rate of 0.35 ml min-1was used. The column oven temperature was maintained at 40 °C, and the injection volume was 3 μl. Ion pairs of m/z 177.03 → 161.06 for propofol and m/z 149.00 → 133.10 for the internal standard were selected for quantitation. The validated quantification range was 0.1 to 75 μg ml-1. The lower limit of quantification was 0.1 μg ml-1.
Population pharmacokinetics
A population pharmacokinetic analysis was performed with NONMEM VII level 3 (ICON Development Solutions, Ellicott City, MD). Plasma propofol concentrations were fitted to one-, two-, or three-compartment models using the ADVAN 6 subroutines and first-order conditional estimation with interaction. Inter-individual random variabilities of pharmacokinetic parameters were estimated assuming a log-normal distribution. Diagonal matrices were estimated for the various distributions of h, where h represents inter- individual random variability with a mean of zero and variance of ω2. Additive and constant coefficients of variation and combined additive and constant coefficient of variation residual error models were evaluated during the model building process. NONMEM computed the minimum objective function value (OFV), a statistical equivalent to the -2 log likelihood of the model. An α level of 0.05, which corresponds to a reduction in the OFV of 3.84 (chi- square distribution, degree of freedom = 1, p < 0.05), was used to distinguish between hierarchical models.14) The covariates analysed were age, sex (0 = female, 1 = male), total body weight (TBW), height, body surface area,15)BMI, ideal body weight,16)and lean body mass.17)Non-parametric bootstrap analysis served to validate the models internally (fit4NM 3.3.3, Eun-Kyung Lee and Gyu-Jeong Noh; http://cran.r-project.org/web/packages/fit4NM/
index.html; last accessed: March 16, 2011).18)Predictive checks were also performed using fit4NM 3.3.3.19 The level of significance of a covariate was additionally assessed using a randomisation test which randomly permutes the covariate in the original dataset using fit4NM 3.3.3. The differences in objective function values between the reference (without the covariate tested) and covariate (containing the covariate tested) models fitted to the permuted datasets were sorted in ascending order. The value corresponding to the 5th percentile was set as the δ value. If a change in objective function values between the reference and covariate models fitted to an original dataset was greater than the δ value, this was considered to be good evidence that the covariate effect was statistically significant.18) 20)
Time to peak effect (tpeak)
An additional 33 ASA PS 1 or 2 underweight patients undergoing elective surgery under general anaesthesia were enrolled for the estimation of the ke0of the pharmacokinetic model.
An intravenous bolus of propofol 2 mg kg–1 was administered after intravenous lidocaine
pretreatment. Five minutes later, propofol and remifentanil were administered by target Ce- controlled infusion (Asan Pump, version 2.1.3; Bionet Co Ltd, Seoul, Korea). The time to peak effect, defined as the time delay between the bolus injection of propofol and the maximally reduced BIS from the baseline value, was observed. Time to lowest BIS after an initial bolus was determined from the individual data file of BIS. BIS values were calculated with a smoothing rate of 15 s and were collected at 5-s intervals on a laptop computer for offline analysis.
Simulations
Deterministic simulations were performed using Asan Pump ver. 2.1.3 software (Bionet Co Ltd, http://www.fit4nm.org/download; last accessed: June 24, 2014). We calculated the simulated cumulative doses and infusion rates over time to maintain a target plasma or effect-site concentration of 2.5 μg ml–1for 60 min for the modified Marsh,21) 22)Schnider,23)
24) Choi and Eleveld11 models in a hypothetical underweight patient. In the Eleveld model, the pharmacokinetic parameters for the patient were used in the simulation process.11)Weight, height, age and sex were assumed to be 45 kg, 170 cm, 40 yr and female, respectively.
Statistical analysis
Statistical analyses were conducted using R (version 3.3.2; R Foundation for Statistical Computing, Vienna, Austria) or SigmaStat version 3.5 for Windows (Systat Software, Inc, Chicago, IL). Data are expressed as the mean ±standard deviation for normally distributed continuous variables, the median (25-75%) for non-normally distributed continuous variables, or counts and percentages for categorical variables.
Results
Population pharmacokinetics
The study patient characteristics are summarised in Table 1. In total, 455 plasma samples obtained from 20 underweight patients were used to build a pharmacokinetic model. The plasma concentrations of propofol over time are shown in Figures 1A and 1B. The plasma concentrations at LOC and ROC were 18.3 ±9.3 μg ml–1and 0.8 ±0.3 μg ml–1, respectively.
A three-compartment mammillary model best described the pharmacokinetics of propofol in underweight patients. Parameter estimates of the competing base and covariate pharmacokinetic models of propofol are described in the Supplementary Material (Table S1).
BMI was a significant covariate for the rapid peripheral volume of distribution. Lean body mass was also a significant covariate for metabolic clearance and the inter-compartmental clearance of the slow peripheral compartment. The relationship between individual Bayesian predicted values of pharmacokinetic parameters and body size parameters are presented in the Supplementary Material (Figure S1). Table 2 presents the population pharmacokinetic parameter estimates and the results of non-parametric bootstrap replicates of the final pharmacokinetic model of propofol. Goodness-of-fit plots of the final pharmacokinetic model of propofol are presented in Figure 1C and 1D. Predictive checks of the final pharmacokinetic model are presented in Figure 2. The percentage of data distributed outside the 95% prediction intervals of the final pharmacokinetic model was 5.9%, indicating that the final model adequately described the time courses of plasma propofol concentration.
Each change in objective function value between reference and covariate models was larger than each δ value at all covariates, which means all covariates passed the randomisation test.
Table 1. Characteristics of the study patients (n=20)
Male/female 14/6
Age (yr) 38.9 ±15.3 (20–68)
Weight (kg) 45.4 ±6.9 (29.8–55.5)
Height (cm) 167.8 ±7.4 (152.3–180.0)
BMI (kg×m–2) 16.1 ±1.7 (12.3–18.2)
BSA (m2) 1.5 ±0.1 (1.2–1.7)
IBW (kg) 62.5 ±7.0 (48.9–72.6)
LBM (kg) 39.2 ±8.0 (23.2–49.6)
ASA PS 1/2 13/7
Duration of anaesthesia 168.2 ±70.4 (57–332)
Data are presented as counts or means ± SDs (with ranges) as appropriate. ASA PS, American Society of Anesthesiologists physical status; BMI, body mass index; BSA, body surface area calculated using the variation of DuBois and DuBois15); IBW, ideal body weight calculated using the Robinson formula16); LBM; lean body mass calculated using the Janmahasatian formula17).
Figure. 1. Plasma concentration of propofol over time (A) and goodness-of-fit plots of the final pharmacokinetic model of propofol in underweight patients (n = 20). B: population- predicted plasma concentration of propofol vs. measured plasma concentration of propofol.
C: conditional weighted residuals (CWRES) over time. D: population-predicted plasma concentration of propofol vs. CWRES. Patients received an intravenous bolus of propofol 2 mg kg-1 followed by zero-order infusion (8 mg kg–1 h–1) during the operation. The blue dashed line is the line of identity.
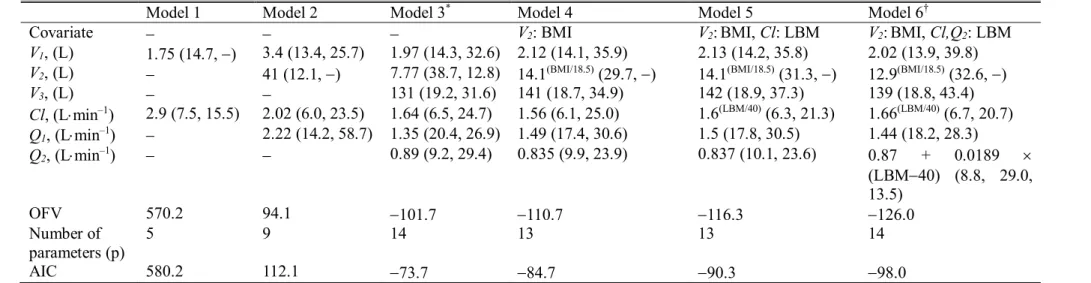
Table S1. Parameter estimates (RSE, % CV) of competing basic and covariate pharmacokinetic models of propofol in underweight patients
Model 1 Model 2 Model 3* Model 4 Model 5 Model 6†
Covariate - - - V2: BMI V2: BMI, Cl: LBM V2: BMI, Cl,Q2: LBM
V1, (L) 1.75 (14.7, -) 3.4 (13.4, 25.7) 1.97 (14.3, 32.6) 2.12 (14.1, 35.9) 2.13 (14.2, 35.8) 2.02 (13.9, 39.8) V2, (L) - 41 (12.1, -) 7.77 (38.7, 12.8) 14.1(BMI/18.5)(29.7, -) 14.1(BMI/18.5)(31.3, -) 12.9(BMI/18.5)(32.6, -)
V3, (L) - - 131 (19.2, 31.6) 141 (18.7, 34.9) 142 (18.9, 37.3) 139 (18.8, 43.4)
Cl, (L×min–1) 2.9 (7.5, 15.5) 2.02 (6.0, 23.5) 1.64 (6.5, 24.7) 1.56 (6.1, 25.0) 1.6(LBM/40)(6.3, 21.3) 1.66(LBM/40)(6.7, 20.7) Q1, (L×min–1) - 2.22 (14.2, 58.7) 1.35 (20.4, 26.9) 1.49 (17.4, 30.6) 1.5 (17.8, 30.5) 1.44 (18.2, 28.3)
Q2, (L×min–1) - - 0.89 (9.2, 29.4) 0.835 (9.9, 23.9) 0.837 (10.1, 23.6) 0.87 + 0.0189 ´
(LBM-40) (8.8, 29.0, 13.5)
OFV 570.2 94.1 -101.7 -110.7 -116.3 -126.0
Number of parameters (p)
5 9 14 13 13 14
AIC 580.2 112.1 -73.7 -84.7 -90.3 -98.0
*selected basic model. †selected final model. OFV, objective function value (-2 log likelihood; -2LL); AIC, Akaike information criteria (-2LL + 2 ´ p); CV, coefficient of variation; RSE, relative standard error = SE/estimate ´ 100 (%); BMI, body mass index; LBM, lean body mass calculated using the Janmahasatian formula17); V1, central volume of distribution; V2, rapid peripheral volume of distribution; V3, slow peripheral volume of distribution; Cl, metabolic clearance; Q1, inter-compartmental clearance of the rapid peripheral compartment; Q2, inter-compartmental clearance of the slow peripheral compartment.
Figure. S1. Relationship of individual Bayesian predicted values of V2versus BMI (A), Cl versus LBM (B) and Q2versus LBM (C), derived from the results of the basic
pharmacokinetic model. V2, rapid peripheral volume of distribution; BMI, body mass index;
Cl, metabolic clearance; LBM, lean body mass; Q2, inter-compartmental clearance of the slow peripheral compartment.
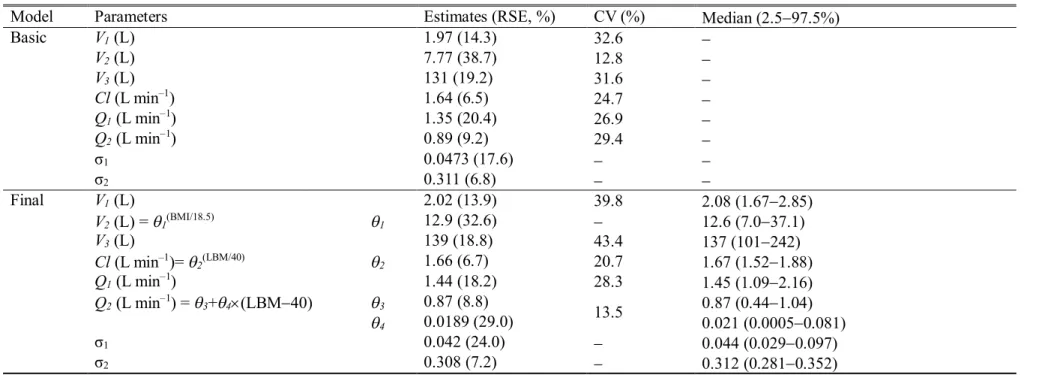
Table 2. Population pharmacokinetic parameter estimates, inter-individual variability, and median parameter values (2.5-97.5%) of the non- parametric bootstrap replicates of the basic and final pharmacokinetic models of propofol in underweight patients
Model Parameters Estimates (RSE, %) CV (%) Median (2.5-97.5%)
Basic V1(L) 1.97 (14.3) 32.6 -
V2(L) 7.77 (38.7) 12.8 -
V3(L) 131 (19.2) 31.6 -
Cl(L min–1) 1.64 (6.5) 24.7 -
Q1(L min–1) 1.35 (20.4) 26.9 -
Q2(L min–1) 0.89 (9.2) 29.4 -
σ1 0.0473 (17.6) - -
σ2 0.311 (6.8) - -
Final V1(L) 2.02 (13.9) 39.8 2.08 (1.67-2.85)
V2(L) = q1(BMI/18.5) q1 12.9 (32.6) - 12.6 (7.0-37.1)
V3(L) 139 (18.8) 43.4 137 (101-242)
Cl(L min–1)=q2(LBM/40) q2 1.66 (6.7) 20.7 1.67 (1.52-1.88)
Q1(L min–1) 1.44 (18.2) 28.3 1.45 (1.09-2.16)
Q2(L min–1) = q3+q4´(LBM-40) q3 0.87 (8.8)
13.5 0.87 (0.44-1.04)
q4 0.0189 (29.0) 0.021 (0.0005-0.081)
σ1 0.042 (24.0) - 0.044 (0.029-0.097)
σ2 0.308 (7.2) - 0.312 (0.281-0.352)
A log-normal distribution of inter-individual random variability was assumed. Residual random variability was modeled using an additive (σ1) plus proportional (σ2) error model. Non-parametric bootstrap analysis was repeated 2,000 times. RSE, relative standard error = SE/mean ´100 (%); BMI, body mass index; LBM, lean body mass calculated using the Janmahasatian formula17); V1, central volume of distribution; V2, rapid peripheral volume of distribution; V3, slow peripheral volume of distribution; Cl, metabolic clearance; Q1, inter-compartmental clearance of the rapid peripheral
compartment; Q2, inter-compartmental clearance of the slow peripheral compartment.
Figure. 2. Predictive checks of the final pharmacokinetic model of propofol with the observed median (solid red line) and corresponding model-predicted 95% prediction lines (solid blue lines). The green dotted lines indicate 95% confidence lines of the 95% prediction lines. +: measured plasma concentration of propofol.
Time to peak effect
Of the 33 underweight patients enrolled in the estimation of the ke0 for the pharmacokinetic model, 5 were excluded from the analysis because of a technical error in BIS file storage (n
= 2) or a failure to observe a definite peak effect (n = 3). Thus, after the addition of the 20 patients enrolled in the pharmacokinetic model building, 48 underweight patients were analysed to calculate the ke0. The time course of BIS values after an intravenous bolus injection of propofol 2 mg kg–1 is shown in Figure 3. The median (25-75%) value of the time to the maximally reduced BIS from baseline was 1.32 (1.07-2.03) min.
Figure. 3. Time course of the bispectral index (BIS) after an intravenous bolus injection of propofol 2 mg kg–1. The thick red line and black dashed lines indicate the mean BIS and observed BIS values of individual patients (n = 48), respectively.
Simulation
Simulated cumulative doses and infusion rates over time to maintain a target effect-site concentration of 2.5 mg ml-1 for 60 min for several models are presented in Figure 4. The Schnider, Choi, modified Marsh and Eleveld models are ranked in order of cumulative dose at 60 min after infusion. The same results were obtained with the fast-infusion rate sequence.
Figure. 4. Simulated cumulative doses (A, C) and infusion rates (B, D) over time to maintain a target plasma (A, B) or effect-site (C, D) concentration of 2.5 mg ml-1 for 60 min for the modified Marsh, Schnider, Choi and Eleveld models in a hypothetical underweight patient.
Weight, height, age and sex were assumed to be 45 kg, 170 cm, 40 yr and female, respectively. For the Eleveld model, ke0 was estimated using the time to peak effect (tpeak = 1.6 min) given in previously published studies.22) 24)
Discussion
It is common for body size parameters such as TBW or lean body weight (LBM) to be included as covariates to explain the inter-individual variability of the pharmacokinetic parameters of propofol.11) 18) 21) 23) 25) In our current study, BMI was found to be a significant covariate of the rapid peripheral volume of distribution, which may be explained by the physical characteristics of underweight patients. As mentioned previously, the term
‘underweight’ is used to describe individuals whose TBW is considered too low for their height. From the perspective of body composition, underweight patients show a significant reduction in fat mass and fat-free mass compared with normal weight patients.26)In previous studies, BMI was a significant covariate on volume of distribution.27) 28) The inclusion of BMI as a covariate of the rapid peripheral volume of distribution led to a greater improvement in the OFV (9.02) than the inclusion of TBW (6.69) or LBM (0.87). We showed that as the LBM increased, the metabolic clearance and inter-compartmental clearance of the slow peripheral compartment increased (see Supplementary Figure S1), which was consistent with previous results showing that LBM was a significant covariate in metabolic clearance.12) 23)Propofol dosing based on a scale that is linearly related to TBW leads to overdosing of obese patients and underdosing of paediatric patients because the relationship between drug clearance and TBW is nonlinear.29) In addition, allometric or lean body mass scaling of propofol pharmacokinetics may be applicable to a wide range of patients ranging from children to obese adults.29) An allometric pharmacokinetic model can predict propofol concentration well for a wide range of patient ages and weights.11)However, the allometric scale approach was not applied in this study for three reasons. First, there was no evidence that allometric scaling works well in an extreme group of patients, such as underweight patients. Second, the Eleveld model with allometric scaling did not perform well in underweight patients.6) Third, Akaike information criteria of the allometric model was not better than the final pharmacokinetic model. When LBM calculated by the James equation is plotted against body weight, an inverted parabolic function is created, which may lead to incorrect results.30) 31)In the present study, LBM, determined using the Janmahasatian formula,17)was used to build the covariate models.
Our previous study showed that target effect-site concentration-controlled infusion of
propofol driven by the modified Marsh and Schnider models can lead to underdosing and overdosing in underweight patients, respectively.32) As demonstrated in Figure 4, the simulated dose requirement to maintain a target plasma concentration of 2.5 mg ml-1for 60 min in the Choi model (349.6 mg) was about halfway between the modified Marsh (318.2 mg) and Schnider (435.8 mg) models, indicating that the Choi model may provide appropriate dosing when underweight patients receive propofol via target effect-site concentration-controlled infusion. In the same hypothetical person, the simulated dose requirement to maintain a target plasma concentration of 5 μg ml-1 for 60 min in the Choi, modified Marsh and Schnider models were 699.2 mg, 635.8 mg and 871.6 mg, respectively.
In TCI, doubling the target concentration will double the dose requirement because the infusion algorithm of TCI is based on linear pharmacokinetics.33) The pharmacokinetics of propofol are linear over a large dosage range.23) Although target effect-site concentration- controlled infusion of propofol using the Choi model may be applicable to underweight patients, a predictive performance evaluation of this model is required before its use in clinical practice.
In general, target effect-site concentration-controlled infusion is mainly used instead of target plasma concentration-controlled infusion because the former can ensure prompter onset and titration of hypnotics and/or analgesics in response to surgical stress during anaesthesia. For target effect-site concentrations, a TCI system should incorporate pharmacokinetic parameters and the blood–brain equilibration rate constant (ke0).5) 34)The ke0can be estimated in two ways. First, an integrated pharmacokinetic/pharmacodynamics modelling technique should be used in a single population, which is the standard method. Second, a model- independent time to peak effect (tpeak) can estimate the ke0, which can be used when pharmacodynamic and pharmacokinetic data are not available for the same population group.5In the present study, it was difficult to intraoperatively evaluate the effect of propofol alone on the central nervous system because remifentanil was being concomitantly administered. For this reason, the ke0was estimated using the tpeakmethod in this study. The ke0 is 0.2792 min-1for a hypothetical underweight female patient with an age, body weight and height of 40 yr, 45 kg and 170 cm, respectively. One ‘arm-brain circulation time’ of propofol is known to be less than one minute.35) A tpeak of 1.32 min is seen as a
physiologically acceptable value. In previous studies, the estimated tpeak was 1.6 min,22) 24) which is somewhat different from that found in this study. This discrepancy may be explained by differences in patient characteristics and propofol formulations. The mean tpeak
values measured using the BIS data in Chinese children and adult patients were 1.08 and 1.23 min, respectively.36) 37) The median value of the time to a maximally reduced BIS from baseline after injection of an intravenous bolus of 1 mg kg–1 microemulsion propofol was 1.68 min.38)
One limitation of this study is that the pharmacokinetic modelling was conducted in surgical patients. To exclude various factors affecting the plasma concentrations of propofol, including surgical stress, anaesthetics and fluid volume and blood loss, a pharmacokinetic study of propofol should be conducted in healthy volunteers. In fact, there are differences in the pharmacokinetic parameters of propofol between healthy volunteers and patients.11 However, it is practically impossible to enrol underweight adults as volunteers. It is also unethical in some respects. For this reason, this study was conducted on underweight patients undergoing elective surgeries. Additionally, concomitant medication including remifentanil may directly and indirectly influence the pharmacokinetics of propofol. However, previous studies have shown that propofol affects the pharmacokinetic characteristics of remifentanil, whereas remifentanil does not influence those of propofol.39) High concentrations of remifentanil may reduce cardiac output, which may reduce blood flow to the liver, which in turn may affect the clearance of propofol. Because the mean blood pressure was generally well maintained during operation (Supplementary Figure S2), propofol clearance would not have decreased.
In conclusion, the time course of plasma propofol concentration is well described by the three-compartment mammillary model. BMI is a significant covariate for the rapid peripheral volume of distribution. LBM is also a significant covariate for both the metabolic clearance and inter-compartmental clearance of the slow peripheral compartment in the final pharmacokinetic model of propofol. The median time to a maximally reduced BIS from baseline was 1.32 min. The Choi model can be used to administer propofol viatarget effect- site concentration-controlled infusion in underweight patients. However, a predictive performance evaluation of this model should be performed before its use in clinical practice.
References
1 Ali SM, Lindstrom M. Socioeconomic, psychosocial, behavioural, and psychological determinants of BMI among young women: differing patterns for underweight and overweight/obesity. European journal of public health2006; 16: 325-31
2 Bosaeus I, Daneryd P, Svanberg E, Lundholm K. Dietary intake and resting energy expenditure in relation to weight loss in unselected cancer patients. Int J Cancer 2001; 93:
380-3
3 Physical status: the use and interpretation of anthropometry: report of a WHO Expert Committee. WHO Geneva.
4 Mullen JT, Davenport DL, Hutter MM, et al. Impact of body mass index on perioperative outcomes in patients undergoing major intra-abdominal cancer surgery. Ann Surg Oncol2008; 15: 2164-72
5 Absalom AR, Mani V, De Smet T, Struys MM. Pharmacokinetic models for propofol--defining and illuminating the devil in the detail. British journal of anaesthesia 2009; 103: 26-37
6 Lee YH, Choi GH, Jung KW, et al. Predictive performance of the modified Marsh and Schnider models for propofol in underweight patients undergoing general anaesthesia using target-controlled infusion. British journal of anaesthesia2017; 118: 883-91
7 Vuyk J, Engbers FH, Burm AG, Vletter AA, Bovill JG. Performance of computer- controlled infusion of propofol: an evaluation of five pharmacokinetic parameter sets.
Anesthesia and analgesia1995; 81: 1275-82
8 Glen JB, Servin F. Evaluation of the predictive performance of four pharmacokinetic models for propofol. British journal of anaesthesia2009; 102: 626-32 9 Michel M.R.F. Struys ARA, Steven L. Shafer. Intravenous Drug Delivery Systems.
Philadelphia: Churchill Livingstone, 2015
10 Park SK, Park JH, Kang HU, Choi BM, Noh GJ. Comparison of the clinical performance of the modified Marsh model for propofol between underweight and normal- weight patients with Crohn's disease. Korean J Anesthesiol2017; 70: 606-11
11 Eleveld DJ, Proost JH, Cortinez LI, Absalom AR, Struys MM. A general purpose pharmacokinetic model for propofol. Anesthesia and analgesia2014; 118: 1221-37
12 Minto CF, Schnider TW, Egan TD, et al. Influence of age and gender on the pharmacokinetics and pharmacodynamics of remifentanil. I. Model development.
Anesthesiology1997; 86: 10-23
13 Jung JA, Choi BM, Cho SH, et al. Effectiveness, safety, and pharmacokinetic and pharmacodynamic characteristics of microemulsion propofol in patients undergoing elective surgery under total intravenous anaesthesia. British journal of anaesthesia2010; 104: 563-76 14 Beal S, Sheiner L (1992) NONMEM User's Guides. In: Part V Introductory Guide, p 48. San Francisco: NONMEM Project Group, University of California.
15 Mosteller RD. Simplified calculation of body-surface area. N Engl J Med 1987;
317: 1098
16 Robinson JD, Lupkiewicz SM, Palenik L, Lopez LM, Ariet M. Determination of ideal body weight for drug dosage calculations. Am J Hosp Pharm1983; 40: 1016-9
17 Janmahasatian S, Duffull SB, Ash S, Ward LC, Byrne NM, Green B. Quantification of lean bodyweight. Clinical pharmacokinetics2005; 44: 1051-65
18 Choi BM, Lee HG, Byon HJ, et al. Population pharmacokinetic and pharmacodynamic model of propofol externally validated in children. Journal of pharmacokinetics and pharmacodynamics2015; 42: 163-77
19 Choi BM, Lee YH, An SM, Lee SH, Lee EK, Noh GJ. Population pharmacokinetics and analgesic potency of oxycodone. British journal of clinical pharmacology2017; 83: 314-25
20 Wahlby U, Jonsson EN, Karlsson MO. Assessment of actual significance levels for covariate effects in NONMEM. Journal of pharmacokinetics and pharmacodynamics 2001;
28: 231-52
21 Marsh B, White M, Morton N, Kenny GN. Pharmacokinetic model driven infusion of propofol in children. British journal of anaesthesia1991; 67: 41-8
22 Struys MM, De Smet T, Depoorter B, et al. Comparison of plasma compartment versus two methods for effect compartment--controlled target-controlled infusion for propofol. Anesthesiology2000; 92: 399-406
23 Schnider TW, Minto CF, Gambus PL, et al. The influence of method of administration and covariates on the pharmacokinetics of propofol in adult volunteers.
Anesthesiology1998; 88: 1170-82
24 Schnider TW, Minto CF, Shafer SL, et al. The influence of age on propofol pharmacodynamics. Anesthesiology1999; 90: 1502-16
25 Kim KM, Choi BM, Park SW, et al. Pharmacokinetics and pharmacodynamics of propofol microemulsion and lipid emulsion after an intravenous bolus and variable rate infusion. Anesthesiology2007; 106: 924-34
26 Coin A, Sergi G, Beninca P, et al. Bone mineral density and body composition in underweight and normal elderly subjects. Osteoporos Int2000; 11: 1043-50
27 Samtani MN, Vermeulen A, Stuyckens K. Population pharmacokinetics of intramuscular paliperidone palmitate in patients with schizophrenia: a novel once-monthly, long-acting formulation of an atypical antipsychotic. Clinical pharmacokinetics 2009; 48:
585-600
28 Jin SJ, Jung JA, Cho SH, et al. The pharmacokinetics of letrozole: association with key body mass metrics. Int J Clin Pharmacol Ther2012; 50: 557-65
29 Coetzee JF. Allometric or lean body mass scaling of propofol pharmacokinetics:
towards simplifying parameter sets for target-controlled infusions. Clinical pharmacokinetics 2012; 51: 137-45
30 La Colla L, Albertin A, La Colla G, et al. Predictive performance of the 'Minto' remifentanil pharmacokinetic parameter set in morbidly obese patients ensuing from a new method for calculating lean body mass. Clinical pharmacokinetics2010; 49: 131-9
31 Tahari AK, Chien D, Azadi JR, Wahl RL. Optimum lean body formulation for correction of standardized uptake value in PET imaging. J Nucl Med2014; 55: 1481-4 32 Lee YH, Choi GH, Jung KW, et al. Predictive performance of the modified Marsh and Schnider models for propofol in underweight patients undergoing general anaesthesia using target-controlled infusion. British journal of anaesthesia2017
33 Shafer SL, Gregg KM. Algorithms to rapidly achieve and maintain stable drug concentrations at the site of drug effect with a computer-controlled infusion pump. Journal of pharmacokinetics and biopharmaceutics1992; 20: 147-69
34 Lee SH, Park HW, Kim MJ, et al. External validation of pharmacokinetic and pharmacodynamic models of microemulsion and long-chain triglyceride emulsion propofol
in beagle dogs. Journal of veterinary pharmacology and therapeutics2012; 35: 329-41 35 Eger EI, 2nd. Characteristics of anesthetic agents used for induction and maintenance of general anesthesia. Am J Health Syst Pharm2004; 61 Suppl 4: S3-10
36 Munoz HR, Leon PJ, Fuentes RS, Echevarria GC, Cortinez LI. Prospective evaluation of the time to peak effect of propofol to target the effect site in children. Acta Anaesthesiol Scand2009; 53: 883-90
37 Zhang MZ, Yu Q, Huang YL, Wang SJ, Wang XR. A comparison between bispectral index analysis and auditory-evoked potentials for monitoring the time to peak effect to calculate the plasma effect site equilibration rate constant of propofol. European journal of anaesthesiology2007; 24: 876-81
38 Choi BM, Bang JY, Jung KW, Lee JH, Bae HY, Noh GJ. The comparison of predictive performance in bispectral index prediction during target effect-site controlled infusion of propofol using different blood effect-site equilibration rate constants in the same pharmacokinetic model. Korean J Anesthesiol2013; 65: 299-305
39 Bouillon T, Bruhn J, Radu-Radulescu L, Bertaccini E, Park S, Shafer S. Non- steady state analysis of the pharmacokinetic interaction between propofol and remifentanil.
Anesthesiology2002; 97: 1350-62
국문요약
연구목적:마취유지를 위해 프로포폴을 지속적으로 정주하는 방법에는 주로modified
Marsh model과 Schnider model이 사용되고 있다. 하지만 우리는 선행 연구를 통해 두
가지 모델을 저체중 환자에 적용하게 되면 프로포폴이 실제 필요량보다 과하게 주입 되거나 적게 주입됨을 알 수 있었다.이 한계점을 극복하기 위해 우리는 저체중 환자에 서 프로포폴 주입을 위한 새로운 약동학적 모델을 개발하였다.
연구방법:체질량 지수(body mass index [BMI])가18.5 kg m–2이하인20세에서68세 사 이의 저체중 환자20명을 대상으로 연구가 진행되었고 마취유도를 위해2 mg kg–1의 프로포폴을 먼저 주입하였다. 마취유지를 위해서 프로포폴을8 mg kg–1h–1의 속도로 주입하였고 레미펜타닐은 목표농도 조절 주입(Target controlled infusion)의 방법으로 주입하였다. 정해진 시간마다 동맥혈 채취를 하였고,인구 약동학 분석은 비선형 혼합 효과 모델링을 이용하였다.최대약효시간(Time to peak effect)는 Bispectral index (BIS) 가 가장 낮을 때로 정의하였고 추가로28명의 저체중 환자를 포함시켜 분석하였다.
연구결과: 20명의 저체중 환자로부터 총455개의 혈장 농도 측정이 가능했고 이를 통 해 프로포폴의 약동학을 분석하였다. 삼구획 모델이 프로포폴 농도의 시간에 따른 변 화를 가장 잘 설명해주고 있었다.체질량 지수가 빠른 말초 구획 분포용적의 의미있는 공변량이었고, 제지방 체중(lean body mass [LBM])은 청소율에 대하여 의미있는 공변 량이었다. 약동학 모수 추정치들은 다음과 같았다. V1(L) = 2.02, V2(L) = 12.9(BMI/18.5),
V3(L) = 139, Cl(L/min) = 1.66(LBM/40), Q1(L/min) = 1.44, Q2(L/min) = 0.87 +
0.0189´(LBM-40). 프로포폴 최대약효시간의 중앙값은1.32분이었다.
결론:이 연구를 통해 얻어낸 삼구획 모델을 저체중 환자의 프로포폴 효과처 목표농도 조절 주입(target effect-site concentration – controlled infusion)시 유용하게 적용할 수 있 을 것으로 보인다.
중심단어:약동학,프로포폴,저체중