Recursive General Equilibrium Model
Hong Chong Cho
Economics, Dankook University
June 14, 2012
Introduction
I Main Issue
I Fast growing numbers of old population in the U.S. incurs huge fiscal pressures, in particular, on Social Security and Medicare
I This paper tries to include explicitly
I changing demographic structure of population
I health status of households, respectively, single and couple
I labor, consumption and medical expenditure decisions affected through idiosyncratic health shocks
I Model features are
I Heterogeneous Agents in terms of age, education, health, marriage status
I CGE(Computable General Equilibrium)
I OLG(Overlapping generation)
Social Security, Medicare and Health Capital in A Recursive General Equilibrium Model Hong Chong Cho
What’s new?
I Explicitly include health capital accumulation depending on household formation
I Comprehensively consider health insurance market structure
I Calibrate the current U.S. Economy and simulate it until 2080
I Compare the baseline model with some counterfactural experiments
I Quantify the effect of demographic changes and health cost inflation on Social Security and Medicare in a general setting
Overview of Results
• Calibration with parameters and simulation with a baseline scenario,
I Baseline model: dependency ratio1 from 20% to 32.2% + 60% increase in health care cost
I capital-output ratio: 3.0→3.15
I Social Security benefit/output: 4.5%→7.0%
I social assistance program/output: 1%→5%
I labor taxation: 23%→36%
I average hours worked: 12% increase
I when Social Security benefit is fixed at 4.5%, labor taxation:23%→32%
1#of population aged 65 and over
# between 20-64
Social Security, Medicare and Health Capital in A Recursive General Equilibrium Model Hong Chong Cho
Literature Review
I Social Security
I Auerbach and Kotlikoff(1987): first paper of social security in OLG
I Huggett and Ventura(1999): heterogeneous agent model
I Domeiji and Floden(2006): to model international capital flows
I Medicare
I Finkelstein(2007): to model the supply of health services
I French and Jones(2007): to include health shocks and medical costs in a life cycle model
I Attanasio, Kitao, Violante(2008): how to finance Medicare
I Health in utility function
I Suen(2006): consider technological progress in medical industry
I Borgor et al.(2008): representative model and many details in health conditions
I Jung and Tran(2011): HSA(Health saving account)
Economic Environment
• Demographics
I J overlapping generations with growth rateg
I j: age
I working starts at age j = 1 and retire atj =jR
I e: educational attainment,ηe: fraction of type e in each cohort
I h: health capital
I εe,jωe(h): labor productivity
Social Security, Medicare and Health Capital in A Recursive General Equilibrium Model Hong Chong Cho
Health Capital Formation
I Single
h0 =ζ(m) + (1−δh)h+u
I ζ: health production function
I m: medical spending
I δh: health depreciation rate
I u: idiosyncratic health shock
I Θe,j(u): distribution, Θe,j(u0,u): transition probability
I Λhe,j(h): distribution, Λhe,j(h0,h): transition probability
I Q
e,j(h): survival rate,h={h1, . . . ,hj−1}: health history, Q
e,j(h): probability of surviving until agej for a new born of typee
Health Capital Formation
I Couple
h0 =f(hh0,h0w)
h0c =Zcmc+ (1−Dc)hc+uc
I hc: household health status vector consisting of husband(hh
and wife(hw)
I mc: medical spending vector
I Zc: health production matrix
I Dc: health depreciation matrix
I uc: idiosyncratic health shock vector
I Θce,j(uc): variance-covariance matrix with non-zero covariances
I Θce,j(uc0,uc): transition probability
Social Security, Medicare and Health Capital in A Recursive General Equilibrium Model Hong Chong Cho
Family Structure
• Couple households have decreased 10% since 1980 and vise versa are single households
U.S. Census 2010
Health Correlation Between Couples
• Correlation decreases as period of living together lasts
1994 1996 1998 2000 2002 2004
0.23 0.24 0.25 0.26 0.27 0.28 0.29
year
correlation
Correlation of husband’s health and wife’s health(1994−2004)
0.277
0.256 0.262
0.255
0.246
0.233
HRS(Health Retirement Survey)
Social Security, Medicare and Health Capital in A Recursive General Equilibrium Model Hong Chong Cho
Preference
I Household Utility U =E0
J
X
j=1 e
Y
j
(h)βj−1u(cj,1−nj)
β: the discount factor, c: consumption,n hours worked.
Health Insurance(1)
m: medical expenditure,q: relative price of medical services to consumption,
I Private Insurance
I κω: a fraction of working age medical expenditure covered by ESHI(Employer-Sponsored Health Insurance)
I κret: a fraction of retirement age medical expenditure covered by ESHI
I premium
0 if no insurance, i= 0
pω if ESHI only working stage, i= 1
pω+ξωpret working stage,
(1−ξ¯ret)pret retirement if ESHI throughout life,i= 2
ξω: firm’s fraction in working and ¯ξret: firm’s fraction in retirement
Social Security, Medicare and Health Capital in A Recursive General Equilibrium Model Hong Chong Cho
Health Insurance(2)
I Medicare
I κmed: coverage by Medicare
I pmed: premium
I φmed: administrative cost by Medicare
I Social Assistance Programs: Medicaid, Supplemental Security Income
I ¯c: minimum consumption level
I tr: transfer when disposal asset fall below ¯c
Commodities, goods and input markets
Three markets are competitive
I Final goods used for private consumption, public consumption, and investments
I Medical services
I Labor services
Social Security, Medicare and Health Capital in A Recursive General Equilibrium Model Hong Chong Cho
Technology
Aggregate production function
Y =ZF(K,N) Resource constraint
Y =C +K0−(1−δ)K +qM+G
M: aggregate expenditures on medical services (including administrative costs associated with employer based health insurance and Medicare)
Fiscal Policy
Five types of government fiscal policies: general public
consumptionG, Medicare expenses, Social assistance payments, Social security benefits, and services to public debt
I Social Security
be =ρe
1 jR −1
jR−1
X
j=1
¯ ye(j)
¯
ye(j): average earnings of households of type e and agej,ρe: benefit fraction of the average earnings of typee in the cohort
I Government supplies one-period risk-free debt D which carry the return r as physical capital.
Social Security, Medicare and Health Capital in A Recursive General Equilibrium Model Hong Chong Cho
Fiscal Policy(revenues)
Revenues
I τω: labor income tax
I τc: consumption tax
I τr: capital tax
I pmed: Medicare premium
I accidental bequest
(τc,τr,pmed,ρe,D,G): are parameters, lettingτω determined in the model
Working stage
V(e,i,j,h,x) = max
c,n{u(c,1−n) +βY
e,j
(h)EV(e,i,j+ 1,h0,x0)}
subject to
x0 = [1 + (1−τr)r][x−(1 +τc)c+tr]
+(1−τω)[ωεe,jωe(h)n−d(i)]−(1−κω·I{i>0})qm
d =
0 if i= 0
pω if i= 1 pω+εωpret if i= 2 tr = max{0,(1 +τc)¯c−x}
c ≤ x+tr 1 +τc
h0 ∼ Λhe,j(h0,h) and m∼Λmj,h(m)
Social Security, Medicare and Health Capital in A Recursive General Equilibrium Model Hong Chong Cho
Working stage
I x: disposable resources
I I{·}: indicator function
I d(i): health insurance premium
I a≡x−(1−τc)c +tr: household’s asset holdings
Retirement stage
Vr(e,i,j,h,x) = max
c {u(c,1) +βY
e,j
(h)EVr(e,i,j+ 1,h0,x0)}
subject to
x0 = [1 + (1−τr)r][x−(1 +τc)c+tr]
+be−[1−κmed−κret·I{i=2}]qm
−pmed−(1−ξ¯ret)pret·I{i=2}
tr = max{0,(1 +τc)¯c−x}
c ≤ x+tr 1 +τc
h0 ∼ Λhe,j(h0,h) and m∼Λmj,h(m)
Social Security, Medicare and Health Capital in A Recursive General Equilibrium Model Hong Chong Cho
A Recursive Competitive General Equilibrium
I Given survival rates {Q
e,j(h)},
I Fiscal variables {G,D, ρe, τc, τr,tr(s)}, and
I Relative price of medical services q, Arecursive competitive equilibriumis a set of:
1. value function V(s),
2. decision rules for the households {c(s),n(s)}
3. firm choices {K,N}, 4. insurance premia{pω,pret}, 5. labor income tax rate τω, and
6. a measure of households µsuch that:
Households, Firms, and Labor Markets
1. Working households choose optimally consumption and labor supply by solving problem, and retired households choose optimally consumption by solving problem
2. Firms maximizing profits by setting their marginal productivity equal to factor prices
w = ZFN(K,N) r+δ = ZFK(K,N)
3. The labor market clears N=
Z
S|j<jR
εe,jωe(h)n(s)dµ
Social Security, Medicare and Health Capital in A Recursive General Equilibrium Model Hong Chong Cho
Asset, Health Insurance Markets
4. The asset market clears K +D =
Z
S
a(s)dµ
5. The private insurance market for working households, and retired households clears
pω Z
S|j<jR,i∈{1,2}
dµ = (1 +φ)κωq Z
S|j<jR,i∈{1,2}
mλmj,h(m)dµ pret
Z
S|j≥jR,i=2
dµ = (1 +φ)κretq Z
S|j≥jR,i=2
mλmj,h(m)dµ with all insurance companies making zero profits for the two separate pools
Final Good Market
6. The final good market clears
ZF(K,N) =C +δK +qM+G where
C = Z
S
c(s)dµand M = Z
S
m(s)dµ+ Φ
and Φ represents the total administrative costs associated with the employer-based insurance and Medicare.
Social Security, Medicare and Health Capital in A Recursive General Equilibrium Model Hong Chong Cho
Government Budget Constraint
7. The government budget constraint satisfies
τcC+τωωN+τrr Z
S
a(s)dµ+pmed Z
S|j≥jR
dµ+ Z
S
[1−Y
e,j
(h)]xdµ
= G+rD+ Z
S
tr(x)dµ+ (1−φmed)κmedq Z
S|j≥jR
mλmj,h(m)dµ+ Z
S|j≥jR
bedµ
Measure and Transition Function
8. For all sets S≡(E×I×J×H×X)∈ΣS, the measureµ satisfies
µ(S) = Z
S
Q(s,S)dµ
where, for j >1, the transition function Q is defined as Q(s,S) =I{e∈E,i∈I,j+ 1∈J}Λhe,j(h0∈H,h)Pr{x0∈X|s}Y
e,j
(h)
Social Security, Medicare and Health Capital in A Recursive General Equilibrium Model Hong Chong Cho
Demographics
I Household enter at age 20(j = 1)
I die at age 100(j = 81) or less than health standard
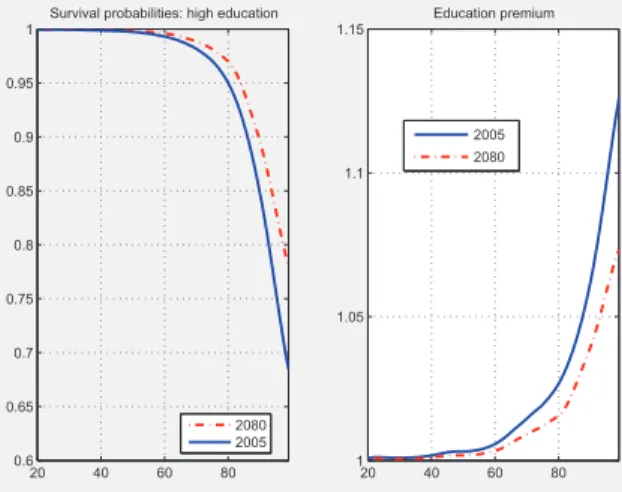
I e = 1: high education, e = 0: low education,ηe: 0.30
I mandatory retirement at age 65(jR = 46)
I survival rate by SSA
Survival Rate
20 40 60 80
0.6 0.65 0.7 0.75 0.8 0.85 0.9 0.95 1
Survival probabilities: high education
2080 2005
20 40 60 80
1 1.05 1.1 1.15
Education premium
2005 2080
Figure 1: Left-panel: survival rates by age for the college graduates in 2005 (data) and 2080 (projected). Right panel: Ratio of survival rates of college graduates to non college graduates by age in 2005 and 2080.
Social Security, Medicare and Health Capital in A Recursive General Equilibrium Model Hong Chong Cho
Preference and Technology
u(c,1−n) = c1−γ
1−γ +χ(1−n)1−θ 1−θ
I γ = 2 (Attanasio(1999)), χ= 2.028, market work=0.33
I ((1−n)/n)/θ= 0.5: intertemporal labor supply elasticity impliesθ= 4(Browning, Hansen, and Heckman (1999))
I β = 0.9955 so that wealth to GDP ratio: 3.4 Yt=ZKtαL1−αt
I α= 0.33
I δ = 0.06
Labor productivity
20 25 30 35 40 45 50 55 60
1 1.5 2 2.5 3 3.5 4
Age
Labor Productivity
Life−cycle Profiles of Labor Productivity by Education and Health Status
High education/Good health High education/Bad health Low education/Good health Low education/Bad health
Social Security, Medicare and Health Capital in A Recursive General Equilibrium Model Hong Chong Cho
Health Status
Medical Expenditure Panel Survey(MEPS) Low Education High Education
good bad good bad
20-29 good 0.95 0.04 good 0.98 0.01 bad 0.41 0.58 bad 0.58 0.42 30-39 good 0.94 0.05 good 0.97 0.02 bad 0.32 0.67 bad 0.31 0.68 40-49 good 0.92 0.07 good 0.95 0.04 bad 0.20 0.79 bad 0.29 0.70 50-64 good 0.87 0.12 good 0.94 0.53 bad 0.16 0.83 bad 0.22 0.77 65+ good 0.86 0.13 good 0.89 0.10 bad 0.13 0.86 bad 0.20 0.79
Medical Expenditure
MEPS($ in 2004) good health
1-60% 61-95% 96-100% average 20-29 153 1,875 10,192 1,253 30-39 321 2,762 13,482 1,833 40-49 453 2,928 19,606 2,277 50-65 1,002 5,124 22,609 3,525 65+ 2,047 8,990 33,190 6,034
bad health
1-60% 61-95% 96-100% average 20-29 484 4,453 23,484 3,023 30-39 758 6,027 40,605 4,595 40-49 1,262 8,243 42,861 5,785 50-65 2,363 12,399 59,730 8,744 65+ 3,946 16,194 60,556 11,063
Social Security, Medicare and Health Capital in A Recursive General Equilibrium Model Hong Chong Cho
Health Insurance and Government
I κω= 0.70, κret = 0.30,κmed = 0.50: coverage rate
I Medicare cost: 2.4% of GDP
I pmed = 0.0224: Medicare premium
I ξ¯ret = 0.6: retiree’s insurance paid by the employer (Buchmueller (2006))
I φmed = 0.1: administrative cost
I τr = 0.4,(by Mendoza(1994))τc = 0.057, τω= 0.23
I social security replacement rate: ρe = 0.4 for e = 0,ρe = 0.3 for e = 1
I D = 0.4: public debt to GDP
I ¯c = 0.1: minimum consumption
I δh= 0.81(Suen(2006)),
Baseline Simulation
• Calibrate and simulate the model in order to analyze basic changes in 2080
I Baseline model: dependency ratio from 20% to 32.2% + 60%
increase in health care cost
I capital-output ratio: 3.0→3.15
I Social Security benefit/output: 4.5%→7.0%
I Medicare costs/output: 2.4%→6.3%
I social assistance program/output: 1%→5%
I labor taxation: 23%→36%
I average hours worked: 12% increase
I when Social Security benefit is fixed at 4.5%, labor taxation:23%→32%
Social Security, Medicare and Health Capital in A Recursive General Equilibrium Model Hong Chong Cho
Sensitivity Analysis
I Health care cost varies 1.0%, 1.3%, 1.9%
I 0.1% of excess health care annual inflation leads to a rise of 1% of labor income tax rate
I saving falls due to lack of self-insurance
I social assistance doubles when 1.6%→1.9%
I Population growth
I 0% growth rate=d.r.=41.3%: labor tax 41%
I 1.4% growth rate=d.r.=25.1%: labor tax 32%
Limitation and Extension
I Incomplete information+Optimal Taxation
I Sophisticate household structures
I structure of household formation like # of kids
I structural changes in single and non-single distribution
I Financial market
I Open market in medical industry or financial market
Social Security, Medicare and Health Capital in A Recursive General Equilibrium Model Hong Chong Cho
Appendix
I s ≡ {e,i,j,h,x}: the individual state vector
I e ∈ E,i ∈ I ={0,1,2},j ∈ J ={1,2, . . . ,J},h∈ H, x ∈ X = [x,x]
I BH,BX: Borel Sigma-algebras ofH andX
I P(E)P(I) andP(J) be the power set of E,I and J
I The state space: S ≡ E × I × J × H × X
I ΣS: sigma algebra on S defined
I as ΣS ≡P(E)⊗P(I)⊗P(J)⊗ BH⊗ BX
I (S,ΣS): the corresponding measurable space
I µ: the stationary measure of households on (S,ΣS)