본 연구에는 금 나노입자를 적용한 표면 강화 라만 산란의 기초 연구, 메커니즘 연구 및 응용 연구가 포함됩니다. 마지막으로 금속 표면과 상호작용이 없거나 안정성이 부족한 분자에 표면 강화 라만 산란을 적용하기 위해 초분자를 도입하고 응용 연구를 진행했다.
Introduction
1. SERS
There are two complementary mechanisms for SERS, explained in terms of strong enhancement and sufficiently proven by many studies.5-8 One is electromagnetic enhancement (EM), which focuses on the surface plasmon resonance of metals, usually plasmonic nanoparticles, which have localized surface plasmon resonance (LSPR ). Since EM and CE work individually but mutually synergize each unexplained weak point, the effort to deeply understand each mechanism, especially CE and ratio, should be essential to find the perfect mechanism for SERS.
2. Gold nanoparticles
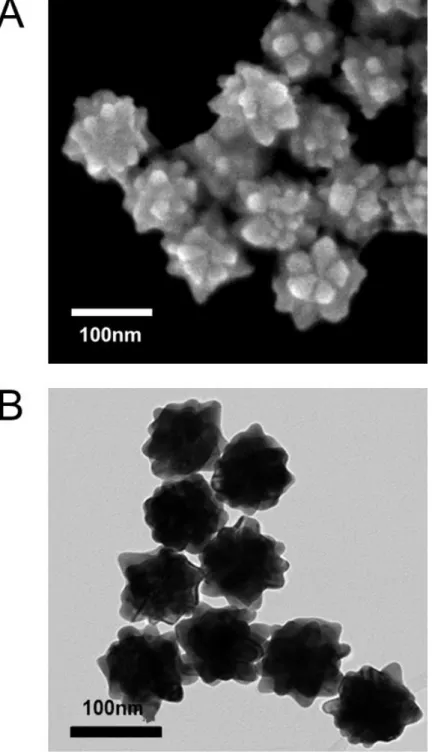
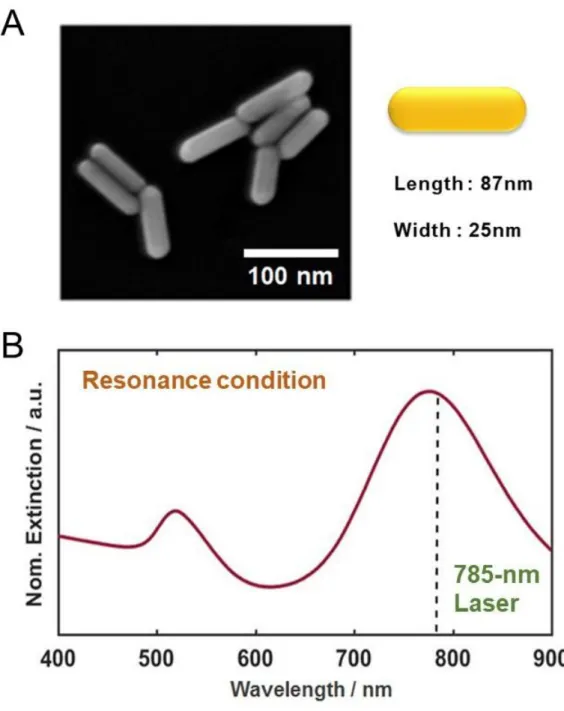
Based on the unique shape, we expect the large improvement with AuNU due to the larger surface area than simple, smooth structures and the high sensitivity from the tip effect between hot spots.20-21.
3. Cucurbit[n]urils
Efficient SERS substrates in the near-infrared (NIR) region are suitable for reducing the effect of Rayleigh scattering.17 In addition, the nanorod has 3 different types of facets related to surface energies and favorable for efficient adsorbing of molecules on the surface forming stable complexes.19 Therefore, these remarkable properties make AuNRs suitable for SERS. This means that CB[n] can effectively induce strong hot spots between AuNPs for SERS.22 In addition, the encapsulation within CB[n] can contribute to the improved stability of the structure for SERS and enable enhancement without direct interaction between AuNPs. and probe molecules because they allow indirect interaction through the carbonyl portals of CB[n], which is placed on the metal surface due to the trapped state associated with the EM enhancement.
4. Objectives of study
We attempted to make stable assemblies of AuNRs using CB[7] for regular alignments to convince the role of CB[7] and the interaction between AuNRs and CB[7] as shown in Scheme 3B. CB[7] allowed to achieve a stable encapsulation of R6G in the CB[7] cavity, which was verified by the stable signal in the SERS study.
Experimental section
1-2. SERS mechanism focused on chemical effect
Probe molecules including cysteamine, p-aminothiophenol (ATP), p-mercaptophenol (MP), thiophenol (TP), p-chlorothiphenol (CTP), p-mercaptobenzoic acid (MBA), p-trifluoromethylthiophenol (TFMTP), and p-nitrothiophenol (NTP) were obtained from Sigma-Aldrich ((St. Louis, MO, USA). The rinsed AuNRs sample was dispersed in ethanol and the solutions of the probe molecules were added appropriately concentrated. The prepared samples were placed in the capillary tube with the size of 0.25mm wall, 100mm length.
In the case of real-time experiment, 1 mM NTP and AuNRs in ethanol were used with the sample method as SERS sample preparation. As soon as two solutions were mixed, it was measured in the capillary tube and repeated every 3 minutes until the signal was saturated. Each end of the capillary tube was sealed to prevent loss of solvent due to evaporation.
1-3. Application study with cucurbit[7]urils
2. Instrumentations
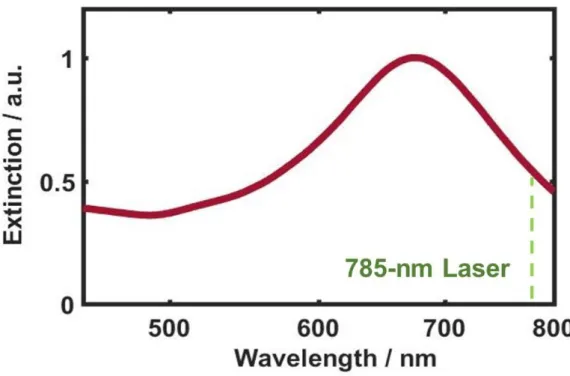
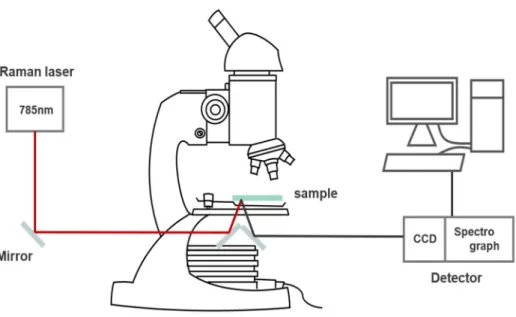
In this study, DF scattering microscopy was performed under a Nikon inverted microscope (ECLIPSE Ti-U, JAPAN). We used an Andor iXonEM+ CCD camera (iXon Ultra 897, UK) to acquire the scattering images of DF AuNPs. A custom-built Raman spectroscopy system with a 785 nm diode laser (Thorlabs, Newton, NJ, USA) was used for Raman and SERS measurements.
The capillary tubes with the samples were placed on the microscope stage, and the laser power was set to ∼60 mW. However, the actual power arriving at the sample was about half of the initial power due to the loss through the road and mirrors. The monochromator with the spectral resolution of 0.1 nm was used with 600 I/mm grating and the slit width was approximately 100 μm.
Results and Discussion
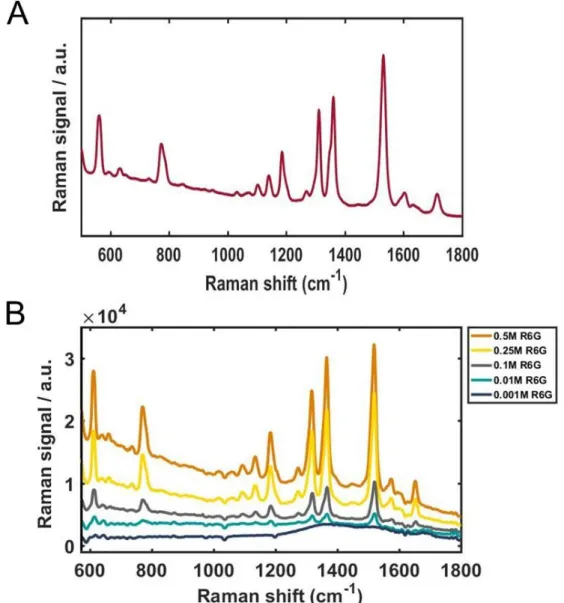
1-2. Raman study of rhodamine 6G
1-3. SERS study with parameters
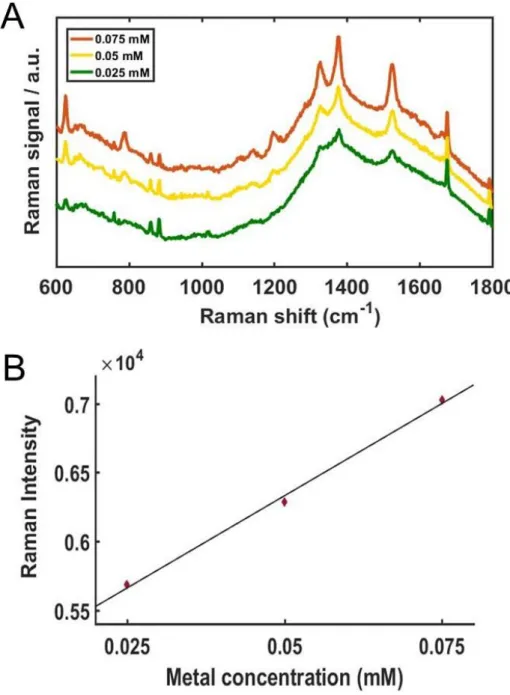
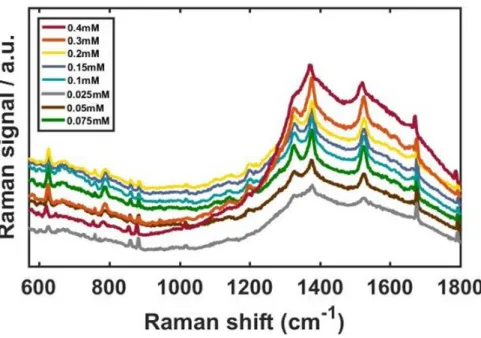
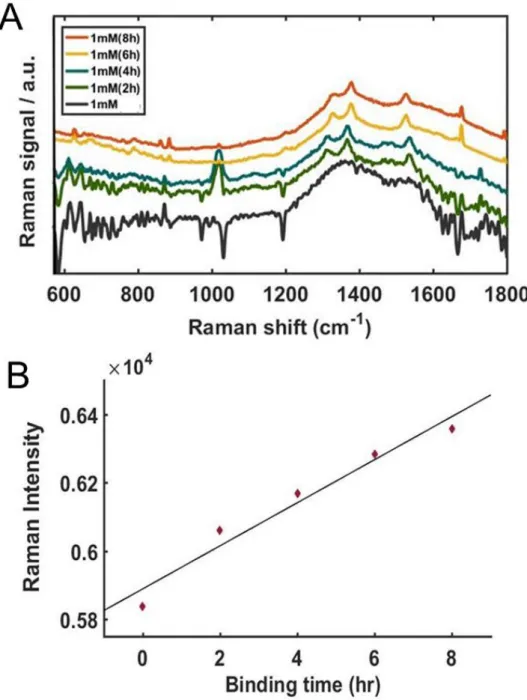
With increasing concentrations of AuNU, the SERS signals were noticeably enhanced with improved resolution, shown in Fig. 6A. For a clearer comparison, the Raman intensities at 1370 cm−1 were fitted to a linear function as shown in Figure 6B, and the experimental data were well fitted by the linear function. Detailed data with multiple concentrations are in Figure 7 (A), Raman intensities at 1370 cm−1 obtained from the SERS spectra shown in (A).
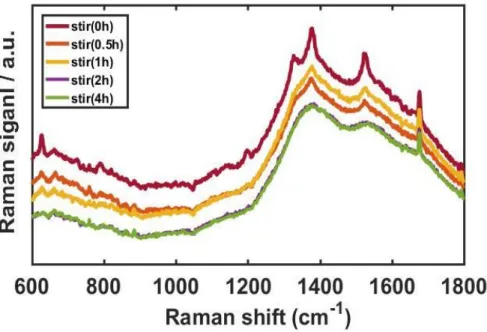
As shown in Figure 9, we noticed that the longer stirring time degraded both intensity and resolution. The red curve in Figure 9, of the unstirred sample, showed the distinct Raman peaks of R6G. The UV-Vis extinction spectrum of AuNRs in Figure 10B indicates two localized surface plasmon resonance (LSPR) peaks derived from the shape effect.
2-2. Benzene ring effect
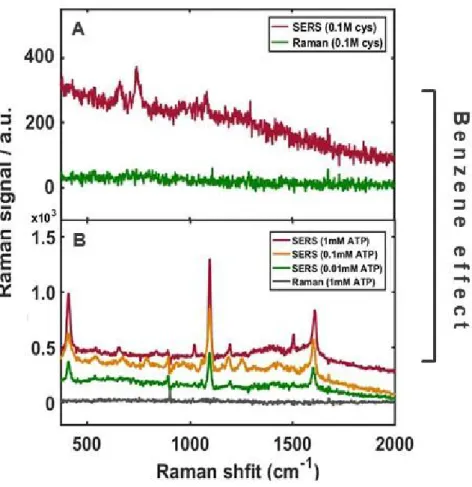
In order to optimize this experiment, we control all factors affected in the EM effect with the same condition and have obtained the same EM effect, expecting high improvement, but focusing CE well. This means that six carbon atoms in benzene can share electrons equally and beneficially for fast and active electron flow, resulting in higher SERS enhancement. In addition, all thiophenol derivatives show the more intense signals than cysteamine, suggesting the distinct contribution of the benzene ring to SERS enhancement with the following results.
It is undoubtedly benzene ring to successfully amplify the signals due to its structural properties. SERS and Raman spectra of cysteamine and ATP for studying the effect of benzene ring.
2-3. Electron withdrawing group effect
Therefore, when the molecule underwent a small refinement, the functional peak could not be displayed or was relatively weak in the spectrum. As shown in Figure 14, we could observe that the peak of the functional groups became larger when the functional group was stronger EWG at 560 cm-1 CTP, 896 cm-1 MBA, 407 cm-. Even NTP showed a peak at 1357 cm-1 assigned to the nitro group (-NO2), the highest peak in the spectrum, above the C-S vibration and a large enhancement up to 100 nM, as shown in Figure 16.
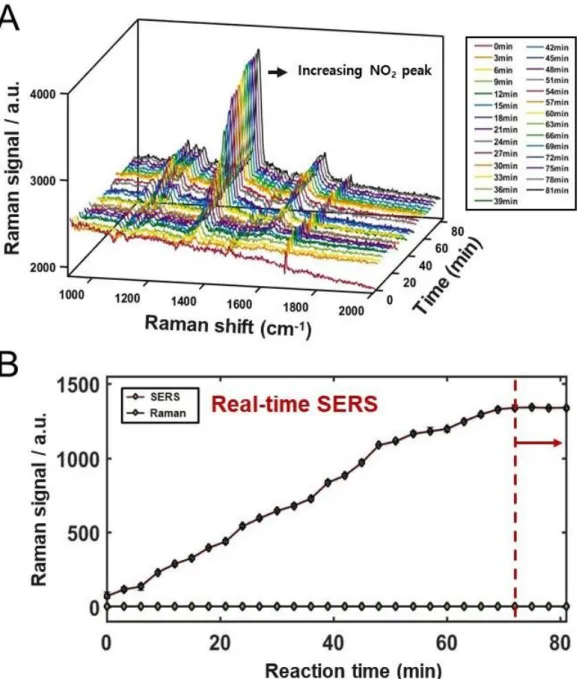
Moreover, peaks corresponding to b2 state appeared gradually, showing the correlation of CE effect and results, when the molecules had stronger EWG in structure, and this means that there is no doubt that there is a correlation between the results and the charge transfer of the adsorbed molecules on metal, not mainly EM effect. Real-time SERS data for NTP from 0 min (after mixing) to 81 min showing the growth of the distinct peaks (A), the relative Raman and SERS intensities of a peak at 1357 cm-1 assigned to NO2 -vibration, finally saturated after approx. 69 min (B). SERS spectrum of NTP with the lower concentration up to 100 nM, indicating the strong enhancement.
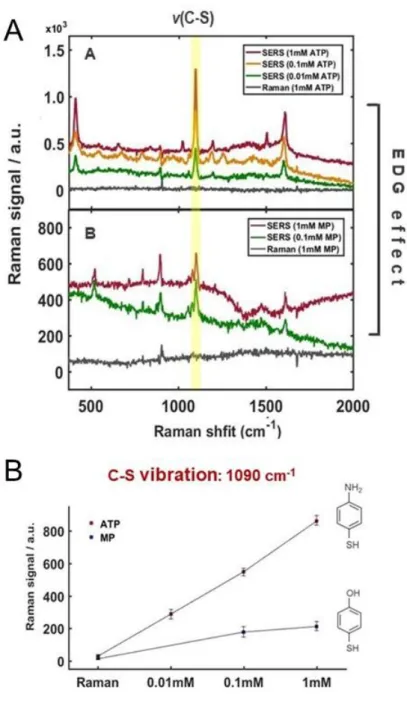
2-4. Electron donating group effect
With ATP, there is a tendency to aggregate AuNRs with the intense signals and slow motions of spots. The effect of intermolecular interaction cannot be overlooked with some evidence, but it is not the dominant explanation for the result and there is certainly another factor. NNRS, the number of molecules in normal Raman sample, is ideally estimated by capillary tube and NSERS, which means the number of molecules adsorbed on AuNRs is calculated by the following method.41.
ISERS: Intensity of SERS signal NSERS: Number of molecules in SERS INRS: Intensity of normal Raman signal. First, to obtain the NNRS, the focal laser spot is calculated with the slit width, 100 μm and the capillary tube with the inner diameter, 0.8 mm. For the factor, NSERS, the number density of gold nanoparticles (Nd) is determined by the concentration of stock solution purchased from Sigma aldrich (St. Louis, MO, USA), 6.72x10¹⁰/ml, and the total volume of SERS samples is 200 μL, with the ideal shape of Figure 21 determined with SEM images, around 7810 nm2.
3. Application study with cucurbit[7]urils
3-1. The role of cucurbit[7]urils between gold nanorods
From these data, it is demonstrated that AuNPs can easily form aggregation with the presence of CB[7]. We compared two modes of SERS effect as shown in Scheme 7 and expected that the encapsulation could be useful for constant enhancement through the interaction with AuNPs and CB[7], even indirect interaction with R6G. In normal SERS, with only AuNRs and R6G as shown in Figure 24A, the enhanced signals weaken over time and even after 20 days there are rarely distinguishable peaks in the spectrum.
Meanwhile, Fig. 24B shows the SERS spectrum in the case of the presence of CB[7] as a container. These results suggest information about the generalization potential in SERS even when the molecule does not interact with the metal surface, indicating a rather good direct interaction with similar enhancement and long-term stability. Schematic of two different SERS patterns, mixture of AuNRs and R6G (A), AuNRs with R6G encapsulation in CB[7] (B).
![Figure 22. Photographs of pure AuNRs solution and one with CB[7] (A), SEM images of AuNRs with CB[7] and without CB[7] (B)](https://thumb-ap.123doks.com/thumbv2/123dokinfo/10443868.0/71.892.161.739.357.943/figure-photographs-pure-aunrs-solution-sem-images-aunrs.webp)
Conclusion
CB[7] also shows high potential as sample containers, resulting in long-term stability up to 20 days with constant and sufficient enhancement of SERS. The molecules that have been difficult to use for SERS due to low binding ability on the metal surface or insolubility can be introduced to SERS with CB[7].
Y.; Xia, Y., Generation of hotspots with silver nanocubes for single molecule detection by surface-enhanced Raman scattering. Suzuki, M.; Niidome, Y.; Terasaki, N.; Inoue, K.; Kuwahara, Y.; Yamada, S., Surface-enhanced nonresonance Raman scattering of rhodamine 6G molecules adsorbed on gold nanorod films. M.; Vo Dinh, T., pH-sensing nanostar probe using surface-enhanced Raman scattering (SERS): theoretical and experimental studies.
Wang, Y.; Wang, Y.; Wang, W.; Sun, K.; Chen, L., Reporter-embedded SERS tags of gold nanorod seeds: selective immobilization of reporter molecules at the end of nanorods. Wang, Y.; Zhao, B.; Ozaki, Y., Exploring the effect of intermolecular hydrogen bonding and its application in label-free enantioselective discrimination by SERS. Hu, X.; Wang, T.; Wang, L.; Dong, S., Surface-enhanced Raman scattering of 4-aminothiophenol self-assembled monolayers in sandwich structure with nanoparticle shape dependence: off-surface plasmon resonance condition.