The results of tests with different temperature ranges show that the thermomechanical behavior of the composite is strongly influenced by the thermal decomposition of the matrix material. By using the thermally degraded properties of the matrix, the thermomechanical response of the smooth woven textile composite material is achieved.
Introduction
Introduction
They simulated the nonlinear behavior of the 8HS textile composite using a bi-linear approximation that simply linearizes the elastic and plastic regimes, respectively. A number of studies have also been conducted to analyze the mechanical behavior of textile composites using meso-scale cell models [47]-[50].
Organization of the thesis
In Chapter 4, the epoxy material and the textile composite are tested with 0o and 45 o orientations in high temperature environments to study the degradation of properties. Using the numerical model in Chapter 3, the mechanical response of the textile composite as the temperature increases is simulated in the elastic regime.
Experimental Analysis
- Introduction
- Manufacturing of specimens
- Overview
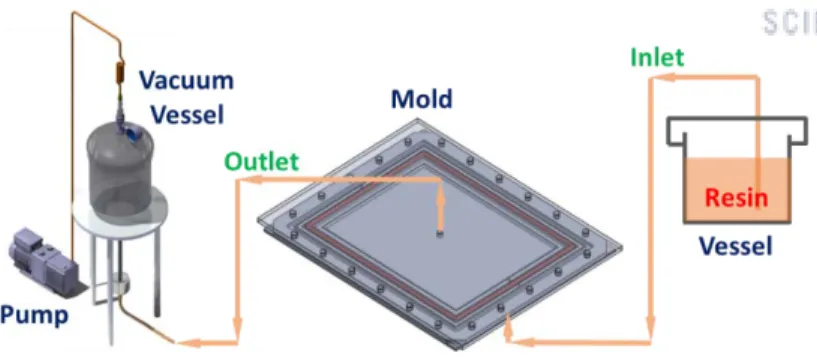
- Mold design
- Manufacturing process
- Microstructure geometry
- Overview
- Measurement procedure and results
- Tension tests with 0 o and 45 o orientations
- Overview
- Tension tests on virgin matrix
- Tension tests on textile composites with 0° orientation
- Tension tests on textile composites with 45° orientation
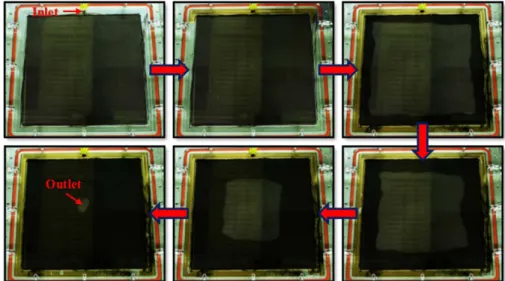
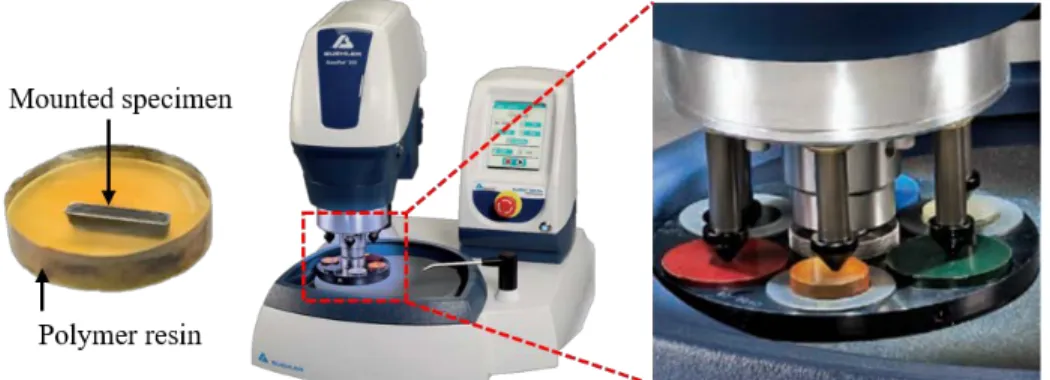
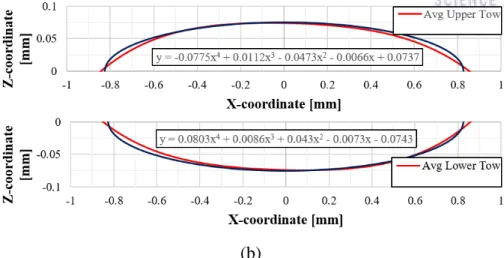
Mechanical properties of the resin system used in this study are listed in Table 2-1. The resin outlet is located under the dry preform in the center of the base mold. Using a digitizing software, the contours of the tensile cross-section are examined as shown in Figure 2-9(a).
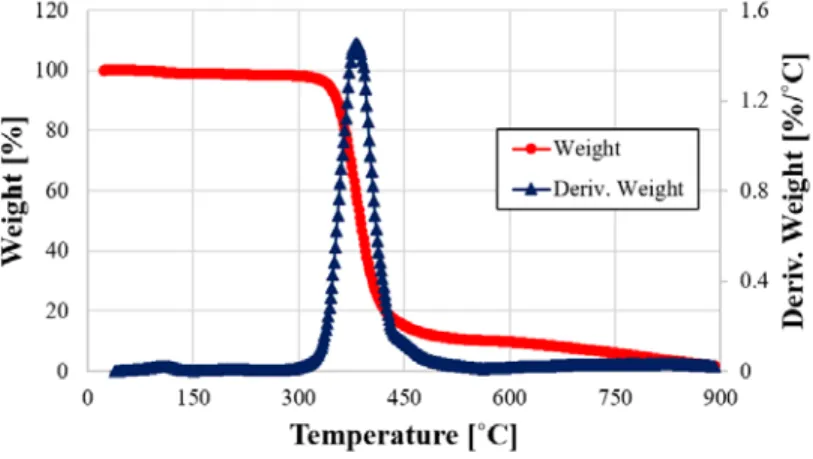
Grayscales of the images are first binarized only in black and white as shown in Figure 2-10. A sample of the resin material of about 15 grams is heated at 20°C/min and TGA results are shown in Figure. In this section, mechanical properties of the plain woven textile composites and the epoxy materials are reported.
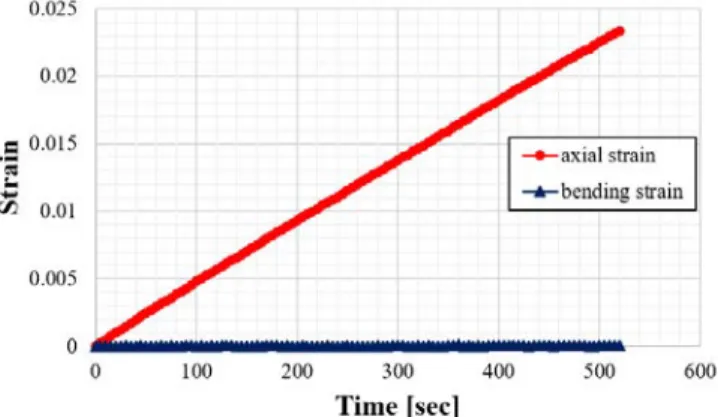
Simple tensile tests are performed to identify the stiffness and strength of the composite and base matrix material. Two digital single-lens reflex (DSLR) cameras are positioned to photograph the front and back of the samples, as shown in Figure 2-16. The strength and tenacity of the textile composite in the direction of the warp and weft strands are obtained by tensile tests on samples with fiber strands aligned with the load direction.
The shear response of a textile composite can be obtained by tensile tests on specimens with fiber strands oriented at an angle of 45° to the direction of loading.
Numerical Analysis
Introduction
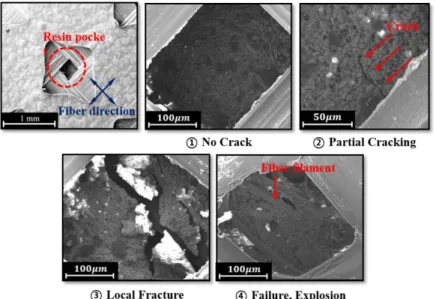
These damage processes appear to be nonlinear stress-strain responses at the macroscale as shown in Figure 2-21. Fibertows are composed of thousands of fiber filaments and a matrix material that binds them together. Although the fiber can be modeled as an elastic material, blue exhibits non-linear stress-strain response in some directions.
As shown in Figure 3-1, along the direction of the fibers, fibertow is easily expected to exhibit linear stress-strain response due to the strong and stiff fiber. To account for the nonlinearity of a fiber tow that is different in each direction, an anisotropic elastoplastic model is used. The geometric data measured and reported in Chapter 2 are also reflected in the present numerical model to consider geometric nonlinearities.
The numerical approach in this study is a two-step analysis consisting of a micro- and meso-scale model. The micro-scale model is used to predict the direction-dependent material properties of the fiber fibers, and the meso-scale model is used to predict the overall mechanical response of the plain weave textile composite.
Micro-scale model
- Overview
- Periodic boundary condition (PBC)
- Virtual tests on the micromechanics model
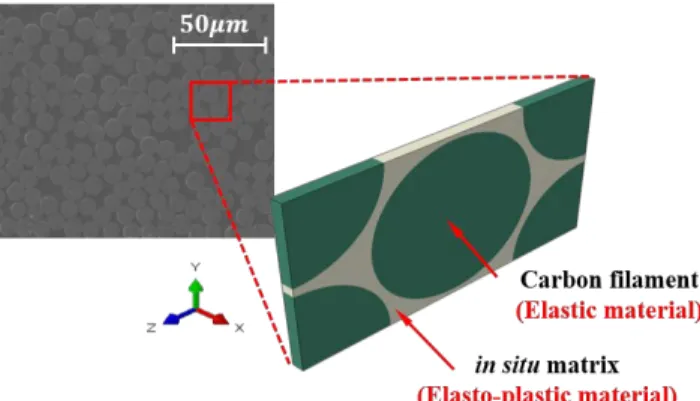
However, in the direction across the fibers, the matrix properties mainly determine the mechanical properties of the bladder, as the fibers are very thin in these directions. However, it is technically impossible to experimentally measure the stress-strain response of the fiber tow in 2 and 3 directions. Instead, a micromechanics model is used to obtain the mechanical properties of the fiber tow.
The fiber volume fraction in a blister reported in Table 2-2 is used to create the micromechanics model. By applying mechanical stress to this model in different directions, the stress-strain response of the fiber tow in different material directions can be obtained. The hexagonally packed fiber/matrix micromechanics model is created based on the assumption that the representative structure is repeated throughout the area of the fiber tow.
The fiber/matrix micromechanics model is used to perform virtual tests in order to obtain the tensile mechanical properties of the fiber. From the stress-strain curves, elastic stiffnesses as well as yield strength values for each direction can be identified.
Meso-scale Representative Volume Element (RVE) model
- RVE under tensile loading
- RVE under shear loading
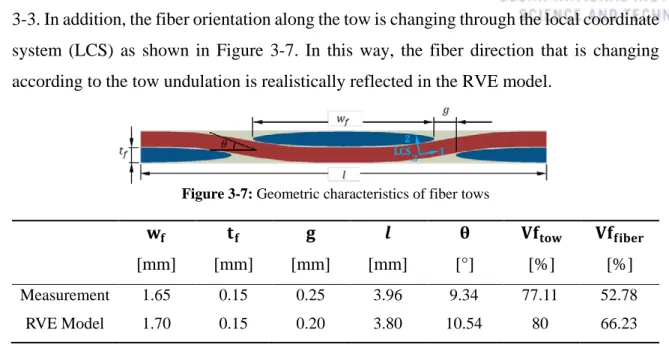
In this way, the fiber direction changing according to the tow wave is realistically reflected in the RVE model. In addition to the conditions in Figure 3-9, periodic boundary conditions introduced in section 3.2.2 are also enforced for the RVE model. The mechanical behavior of the plain woven textile composite is investigated using the RVE model with ABAQUS/Standard 6.14-2.
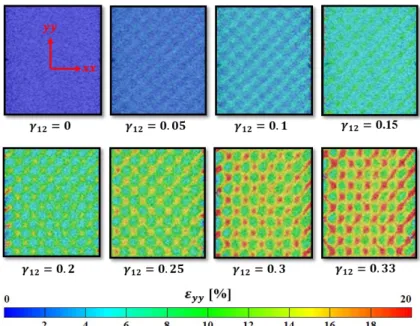
The plain weave fabric architecture is moderately reflected in the strain contour from the DIC and FEA results in Figure 3-12. A shear strain in the xz plane of 5% is applied to the RVE model via a periodic boundary condition as shown in Figure 3-9. As can be seen from the figure, the die is much more stressed in the case of shear than tension.
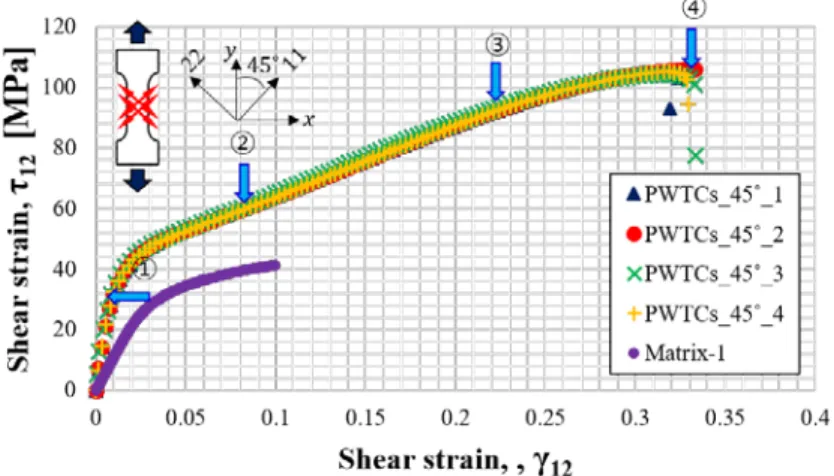
Furthermore, since the matrix exhibits nonlinear stress-strain response, the RVE model also exhibits nonlinear behavior as can be seen in Figure 3-14. In the figure, the FEA results agree very well with the experimental data taken from Figure 2-27.
Application: Prediction of Matrix Properties using an RVE Model
- Overview
- Inverse analysis procedure
- Results and discussion
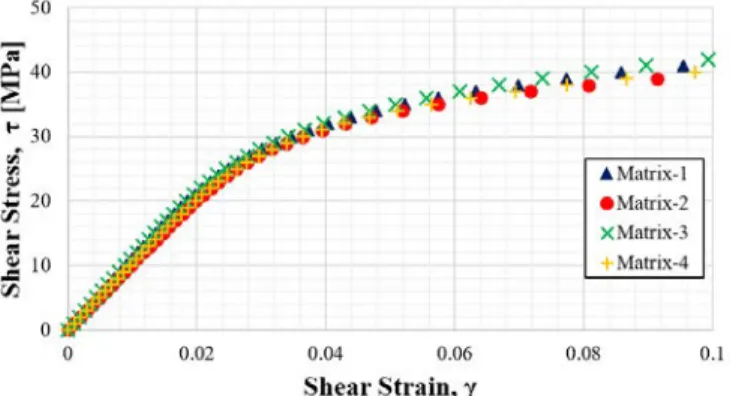
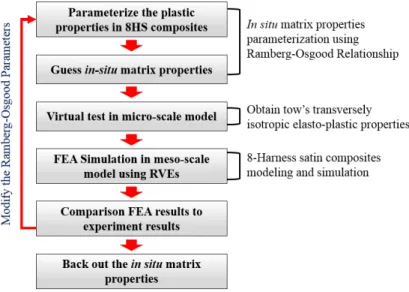
However, using the approaches presented in the previous section, it is possible to extract matrix properties from the mechanical properties of composites. They performed off-axis tension tests on 8HS textile composites, but matrix properties were not reported in their work [17]. The first step is to parameterize the shear stress and shear strain data of the 8HS textile composite using the Ramberg-Osgood relationship.
In the present inverse analysis, initial values of the Ramberg-Osgood parameters for the in situ matrix are the same as those of the 8HS composites taken from the off-axis tension test results. Depending on the trend of differences between the two data, the Ramberg-Osgood parameters of the matrix are adjusted and finite element analysis is performed again. This process is performed iteratively until the RVE model reproduces the experimental data of the 8HS assembly.
As can be seen in Figure 3-20, the predicted shear stress–shear strain response best matches the test data when the properties of the Guess 3 matrix in Figure 3-19 are used. We can conclude that the properties of the PMR-15 matrix follow the yellow curve in Figure 3-19.
Introduction
Experimental analysis
- Overview
- Tension tests on the virgin matrix
- Tension tests on textile composites with 0 o orientation
- Tension tests on textile composites with 45 o orientation
The test procedure is the same as the protocols described in Sections 2.4.3 and 2.4.4 and the configuration of the samples is shown in Figure 4-4. From the observation of failed specimens in Figure 4-6, as the temperature increases, the elongation of the specimens becomes small and nonlinear behavior such as necking almost disappears. In order to investigate the deterioration of mechanical properties of the plain weave textile composite as temperature increases, tension tests are performed at the same temperature conditions that were used for the virgin matrix in Section 4.2.2.
The dimensions of the samples are the same as those discussed in Section 2.2 and the test results are shown in Figure 4-7 and Figure 4-8. This is because delamination results from the breakdown of the matrix material and load transfer does not occur smoothly between the fiber and the matrix. Off-axis tension tests are carried out to investigate the reduction in shear properties of the textile composite.
Since the entire area of the sample undergoes large deformation, the strain gauges are not sufficient to record the strain field during the test. In the off-axis stress test, the matrix has a dominant influence on the response of the textile composite and thus the deterioration of the material properties is clearly observed in Figure 4-9 as the temperature increases.
Numerical analysis
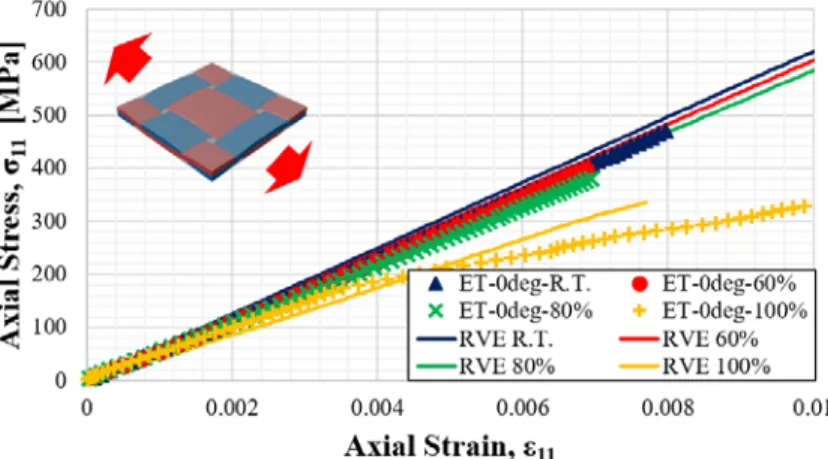
In this section, numerical analysis is performed to predict the mechanical behavior of the textile composite using thermally degraded matrix properties. First, using the fiber/matrix micromechanics model with the thermally degraded matrix properties, the effective material properties of the fiber cable are first calculated. Using these values, the effective stiffness values are found from the fiber/mechanics model listed in Table 4-4.
The RVE model is then used to predict the thermally degraded properties of the textile composite. As can be seen in Figure 4-11 and Figure 4-12, the degraded elastic properties are accurately predicted by the present numerical approach. As the temperature increases, the numerical approach is somewhat inaccurate in the nonlinear regions mainly due to the thermal degradation of the matrix properties.
However, as the temperature increases, the interfacial bond between the fibers and the matrix gradually weakens because the polymer chains inside the matrix material undergo degradation and, as a result, the bonding forces degrade. It is therefore noted that the current approach is still valid in the elastic region even at elevated temperatures, but has some limitations in predicting the non-linear behavior of the textile composite as the temperature increases.
Conclusion
Conclusion
Novelty and contribution
Future works
The molecular dynamics model is a good candidate for studying the thermomechanical behavior of an epoxy material subjected to simultaneous thermal and mechanical loading. Antisymmetric elastic properties of satin fabric composite panels: Journal of Fiber Science and Technology, Vol. Coefficients of in-plane thermal expansion and thermal deflection of fabric composites: Journal of Composites Materials, Vol.
Experimental confirmation of the theory of elastic moduli of fabric composites: Journal of Composite Materials, Vol. Modeling and characterization of textile structural composites: a review: Journal of Strain Analysis for Engineering Design, Vol. Micro and mesomechanics of 8-harness sateen woven composites: I — evaluation of elastic behavior: Journal of Composites Part A.
E., "An Investigation of the Mechanical Behavior of SCS-6/Ti-6-4 Metal Matrix Composite at Elevated Temperatures," Composites Science and Technology. Zhou, Multiscale analysis of 3D woven composite based on periodicity boundary conditions, Journal of Composite Materials, Vol.