Introduction, background and thesis objectives
- Introduction to carbon nanotubes
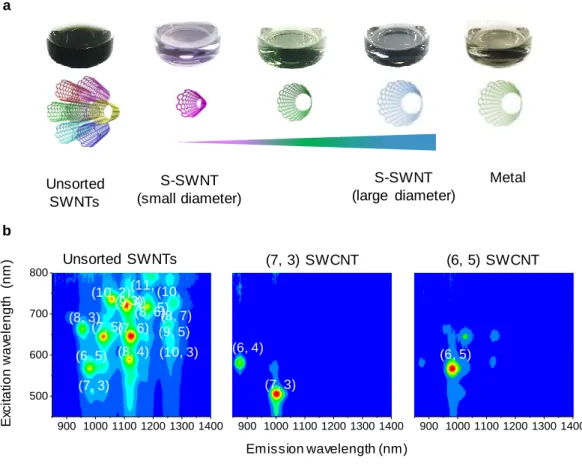
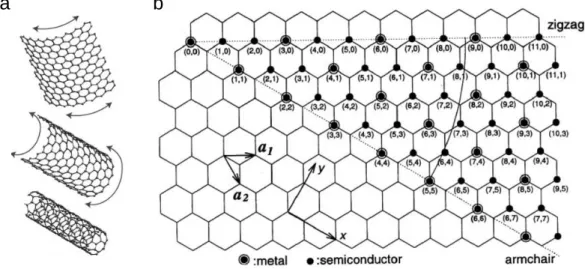
- Basic structures of SWNTs
- CNT properties
- Synthesis of CNTs via chemical vapor deposition (CVD)
- Introduction to exterior transport along the carbon nanotubes
- Driving forces for exterior transport along carbon nanotubes
- Exterior transport driven by electrowetting
- Accumulation of ions on the carbon-based surface via cation- π interactions
- Thesis motivation and objectives
As shown in Figure 1.6, CVD-SWNT can be characterized using Raman spectroscopy and Atomic Force Microscopy (AFM). The inhomogeneous thermal gradients along the nanotube can be caused by joule heating. e) the direction of Au loading is independent of electric field (red arrow), proving transport driven by thermomigration.
Cation-preferring 1D transport along the exterior of SWNTs
Introduction
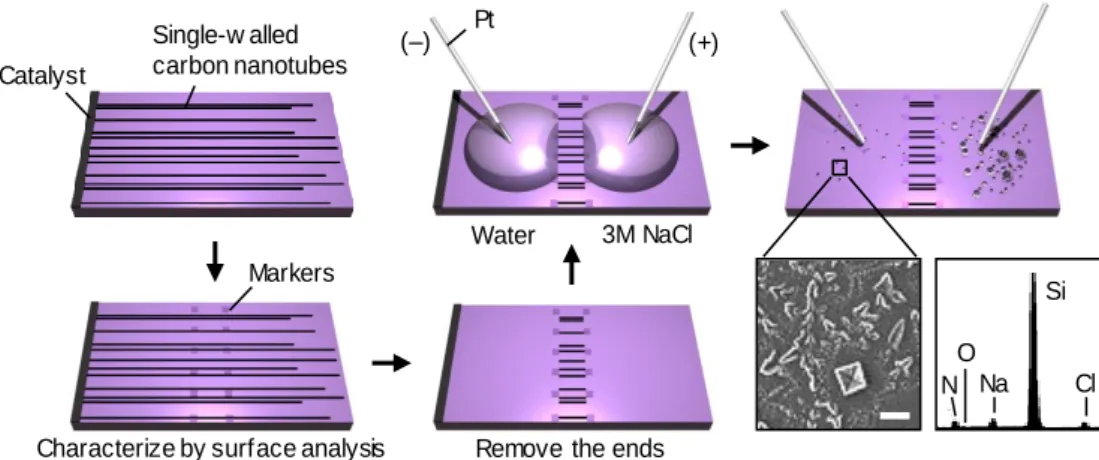
Transport of ionic species through the SWNTs
Evidences of exterior transport of ionic species along SWNTs
As shown in Figure 2.3, we also performed the possibility of diffusive transport of ions along the nanotube. In addition, without ionic species, bright and dark lines did not form along the nanotubes in SEM (Figure 2.3b).

Identification of major charge carriers in the system
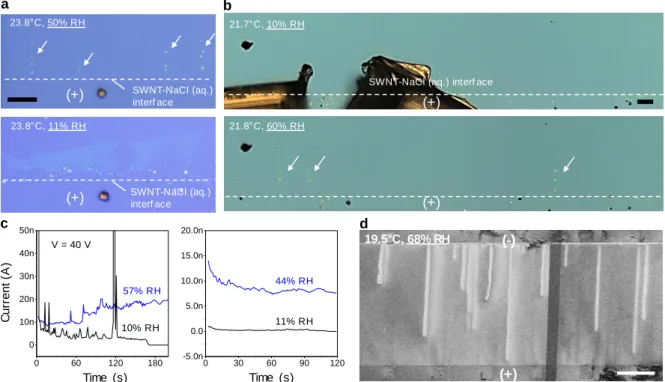
We investigated electrochemical oxidation of SWNTs and associated electron flow to further confirm the dominance of ion flow in our system. We observed damage to the nanotubes at the interface between droplets and nanotubes after the outward transport of ions. Instead, we performed the experiment described in Figure 2.2a using a 10 μm wide and 1 mm long strip of graphene.
The electrochemical oxidation of graphene at 40 V can be monitored microscopically in situ due to the slight color change of graphene during oxidation as verified by ex situ Raman spectroscopy (Figure 2.7). Thus, we conclude that the current is a direct measure of the flow of ions along the exterior of the nanotubes.
Non-uniform distribution of charges around the SWNT
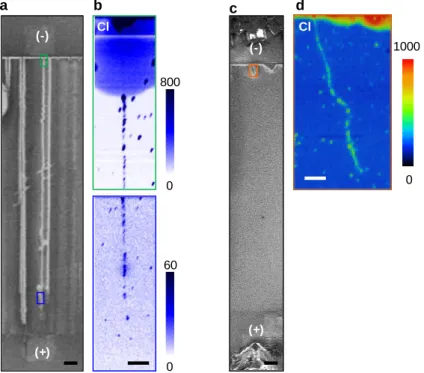
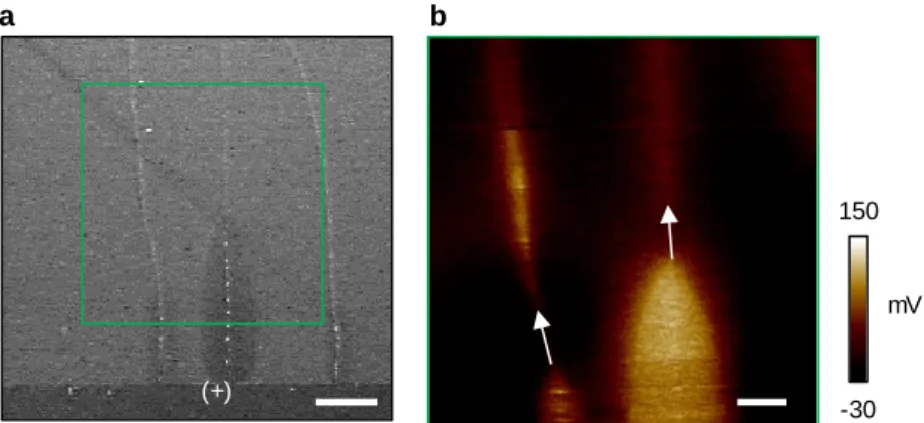
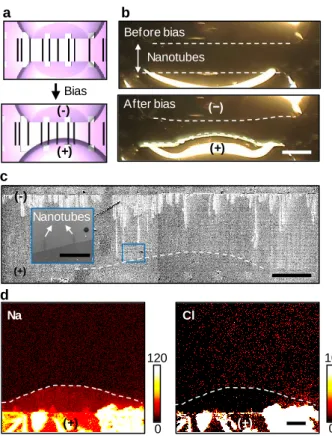
The dotted menisci of the two droplets, which were initially parallel to each other, were distorted by the bias. Inset showing magnified view of dark cone-shaped regions protruding from the deformed droplet along the nanotubes. In Figure 2.10, we also performed the surface potential map in the deformed area at the anode (+) side using a Kelvin probe force microscopy (KPFM), which further confirmed that the dark regions in the SEM image are positively charged in our system.
Here, the positively charged regions extend along the nanotubes as bright lines in the KPFM image, implying the migration of Na + -enriched solution along the outside of the SWNT.
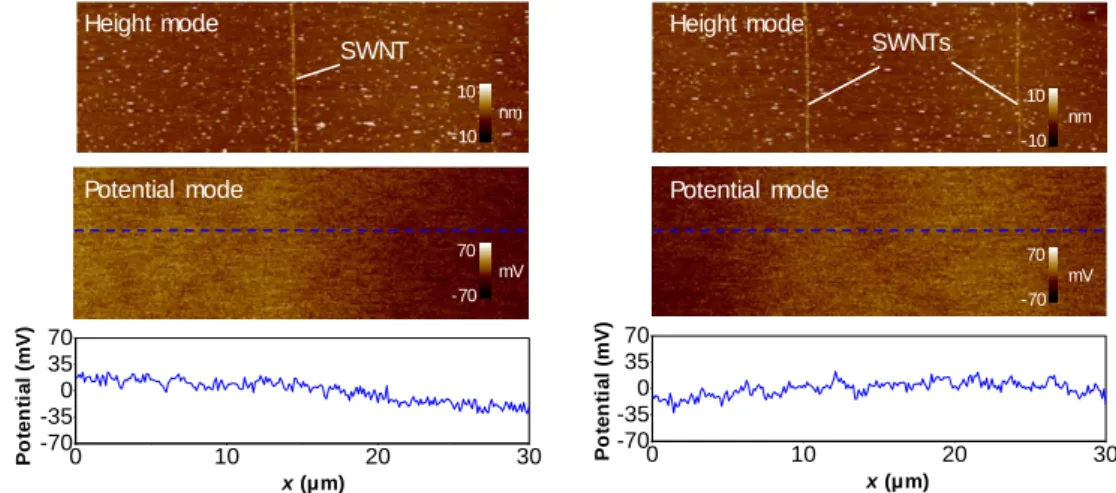
A SWNT as a cation-preferring 1D nanochannel
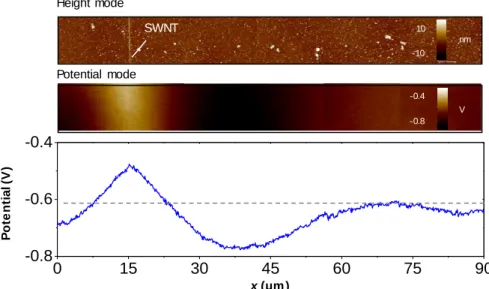
Without applying electrical bias, there is no local enrichment of charges along pristine SWNTs grown on SiO2 substrate as shown in the AFM, KPFM images and potential profiles along the dotted lines. AFM height mode (top), KPFM potential mode (middle) and the potential profile (bottom) over the scanned area, confirming positive charges along the nanotube and negative charges in the adjacent substrate. However, the SWNT channels in our study in both cases preferred the transport of cations as described in Figures 2.13 and 2.14, while the anion-enriched solution migrated along the adjacent substrate.
The EDX analysis of the salt crystals formed along the nanotubes confirms that the crystals are cation-enriched with the cation-to-anion ratio of or K/Cl = 1.43) (Figure 2.14). The AFM height image of the crystals (Figure 2.14, left) and corresponding potential image in KPFM (Figure 2.14, right), which show positively charged crystals, further confirm the cation enrichment.
Other mechanisms to consider for resulting in non-uniform distributions of charges
Cation–π Interaction for the preferential transport of cations
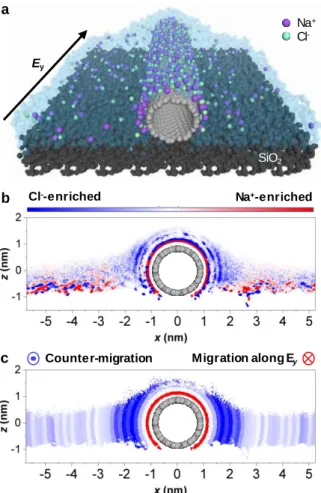
The non-uniform distribution of charges resulted in positively charged states (red) directly outside the SWNT and negatively charged states (blue) adjacent to the SWNT. This simulation result is consistent with the SEM image, showing dark and bright lines along the SWNT and adjacent substrate, respectively. Upon application of an electric field, the non-uniform charge distribution induced the specific charge transport of ions along the SWNT.
On the other hand, the Cl-enriched and thus negatively charged solution migrated in the opposite direction along the substrate adjacent to the SWNT (blue). Red color indicates migration in the direction of the electric field and blue color indicates migration in the opposite direction.
Effect of functionalization on the cation-preferring transport
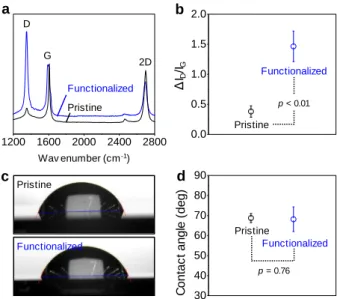
Considering the limited scan size of the KPFM, we have reduced the size of the line and space functionalization to 5 μm. The line-and-space in the G- and D-map of the SWNT in Figure 2.16d verifies the successful diazonium chemistry. As expected from the SEM image in Figure 2.16c, only the pristine parts of the nanotube exhibited relatively strong positive charges or cation enrichment.
The functionalized parts were also positively charged compared to the neighboring regions, but to a lesser extent, probably due to the incomplete removal of π-electrons. Our previous report40 showed a hint of outward transport of ions, but the role of cation-π interaction in outward transport in comparison is still largely unknown.
Shrinkage and growth of salt crystals by the exterior transport of ions
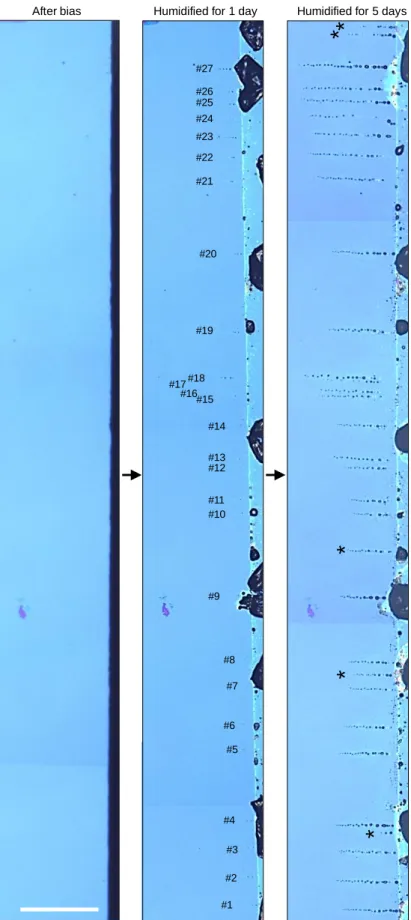
The force (F) acting on a charged species in an ionic conductor consists of a direct electrostatic force (Fd) and a wind force (Fw), or F = Fd + Fw.46 Fd and Fw arise from the applied electrical bias and ion flux, respectively. Figure 2.18b shows the crystals formed with the outer part of the covered SWNTs, which blocked the ion current (Fw ~ 0). Compared to crystals 1 and 2, crystals 3 and 4 in Figure 2.18b were not only micron in size, but continued to grow and often merged with neighboring ones.
The crystal diameters plotted against time in Figure 2.18c clearly show the difference between the two. Thus, we concluded that the successive shrinkage and growth of the crystals in Figure 2.18a was caused by Fw or ion migration.
Conclusions
Experimental details
TOF-SIMS image pixels) were collected by TOF-SIMS 5 (IONTOF GmbH, Münster, Germany) with a liquid bismuth metal ion gun as the primary ion source in burst tuning mode, and the pulsed primary ion current was 0.04 pA for Bi+ at a dose density of 6.0. For TOF-SIMS images, the acceleration voltage of Bi+ was 25 keV and electron flooding was used for charge neutralization. SWNTs grown on a SiO2 substrate were immersed in aqueous solution of 0.1 mM or 10 µM 4-bromobenzenediazonium tetrafluoroborate (4-BBDT) in 10-4 M NaOH for 1.5 h.
The tip-to-substrate distance was set at 108.1 nm, and the drive amplitude was 500 mV. The scan rate was approximately 0.6 Hz with the drive path applied to the tip for surface potential measurements.
Hygroscopic micro/nanolenses along carbon nanotube ion channels
Introduction
Decoration of salt micro/nanocrystals along SWNTs via exterior transport of ion
This optional step helped define the meniscus of the droplet by imparting hydrophilicity to the etched area, but did not affect the efficiency of crystal formation. The salt crystals can be removed non-destructively by simply rinsing with water (Figure 3.3a), and Raman spectroscopy of the nanotubes before and after crystal formation confirmed that no damage occurred to the nanotubes (Figure 3.3b). The shape and size of the crystals did not change during baking of the substrate at 100 °C, collection of SEM images under a vacuum or storage under different ambient conditions for 28 days (Figure 3.4).
The logarithmic normal distribution of the crystal diameters was shifted to the right (i.e. larger crystals) at the stronger electric field (Figure 3.5b). Here, the ionic transport along the nanotubes was mainly driven by the repulsion between the cations accumulated near the edge of the droplet under an electric field.

Hygroscopicity of salt crystals formed along nanotubes
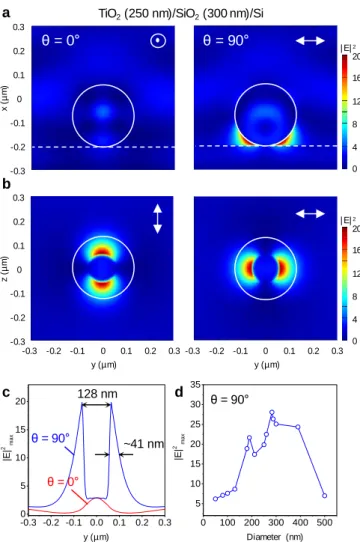
NaCl crystals having a refractive index (n) of 1.54 and a plano-convex shape (Figure 3.10) serve as micro/nanolenses to amplify the Raman scattering of the underlying specimen. The chirality and diameter of the nanotubes were determined based on the Kataura plot7 and the relation, d (nm) = 248/RBM(cm-1).38. The intensity profile on the substrate (Figure 4.1c), where y = 0 represents the TiO2 substrate contact, confirms the presence of two sharp peaks after polarization of the incident light at θ.
Experimental measurement of the subdiffraction optical phenomena described in Figure 4.1 requires sophisticated optics and is therefore challenging. Experimental verification of the results described in Figure 4.1 requires the formation of spherical nanoparticles on the SWNT surface.
Salt crystals as a micro/nanolenses that amplify Raman scattering
Probing various molecular species through the micro/nanolenses
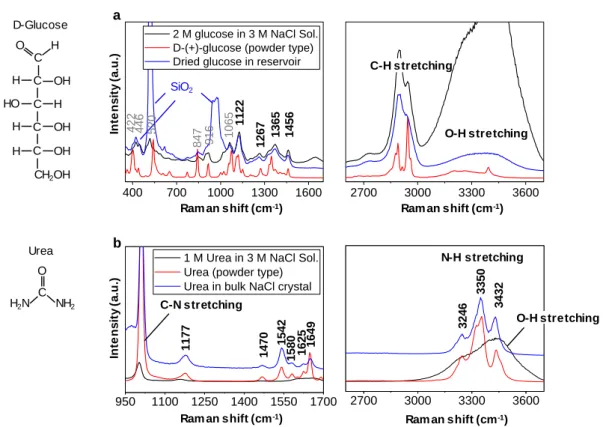
For reference, spectra were collected from NaCl crystals in the reservoir (green); the fingerprint Raman modes for glucose and urea are marked with stars (Figure 3.20). Assuming a hemispherical lens with a diameter of 2 μm and no enrichment of analytes in the lens, our result corresponds to the detection of ~2 attomoles of glucose or urea. We have also shown that lens (d = 3.8 μm) is able to detect down to 10 mM level of concentration of glucose solution (Figure 3.21), showing that it is possible to detect ~0.14 atomole of glucose .
Use of salt micro/nanolenes for searching for Raman active molecular species. a) Schematic of the transport of a Raman-active molecular species along the nanotube and its capture within the lens. Thus, our results demonstrate the great promise of using these salt lenses for the search for analytes with high salt content, for example, in animal body fluids, cell culture media, and marine environments (Figure 3.22).
Modulation of Raman scattering using the interference micro/nanolens
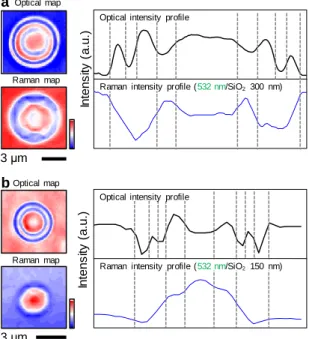
A similar interference behavior in Raman scattered by the LiCl lens (d = 4 μm) on 150 nm SiO2/Si substrate is shown in Figure 3.24b. Shown in Figure 3.29 is Raman map of G-band and corresponding Raman spectra with (blue) or without (black) the lens. At θ = 0°, the enhancement of the electromagnetic field is marginal in the xy plane, and the maximum intensity is obtained at the particle-substrate contact.
The Raman scattering of the SWNTs is plotted against |y| (Figure 4.11c) to ensure cross-sectional independent analysis of Figure 4.11c as supported by Figure 4.12. This decrease by 11.3% in the presence of TiO2 explains the reduced Raman modes of graphene in Figure 4.14.
Modulation of Raman scattering of 1D SWNT using the interference micro/nanolens
Conclusions
In conclusion, we demonstrate a 1D array of salt micro/nanolens selectively patterned along the exterior of single-walled carbon nanotubes by ion transport. The hygroscopicity of the salt ensures long-term stability of the lenses in various environmental conditions. Since our approach is based on 1D transport phenomena, which are still largely unexplored, further studies are needed to understand how the properties of nanotubes (i.e., their diameter, chirality, and metallicity) affect crystal formation.
The focusing behavior through the lens is strongly related to the interference conditions and the lens diameter. This study can provide a new understanding of micro/nanolens focusing behavior and is applicable to related studies including sub-diffraction-limit microscopy, spectral amplification, and light harvesting in solar cells.
Experimental details
Probing a sub-diffraction optical confinement via the polarized Raman spectroscopy
- Introduction
- Dual-band confinement of light by TiO 2 nanoparticle
- Polarized Raman spectroscopy of 1D nanostructure for sub-diffraction optics
- Independence of incident polarization in 2D graphene
- Conclusions
- Experimental details
The FDTD simulation verifies that the dual-band optical confinement shown in Figure 4.1 is generic over a wide range of excitation wavelengths and particle diameters. The double-band limitation is only pronounced when the refractive index of the nanoparticle is greater than 2 (Figure 4.5) and when the substrate is present (Figure 4.6). We obtained a Raman map of the TiO2 graphene at different polarizations of the incident laser, as shown in Figure 4.14a and 4.14b, where the TiO2 nanoparticles are indicated by green dotted circles.
As shown in Figure 4.15, TiO2 nanoparticles cause strong dual-band light confinement, but the effect of this confinement is not pronounced in the graph. As experimentally shown in Figure 4.18, both the G and 2D states of graphene are reduced by the presence of a TiO2 microsphere at both polarization angles.
Summary and future perspective
Poster] 2018 MRS Fall Meeting, "The exterior of single-walled carbon nanotubes as a millimeter-long cation-preferred nanochannel" Boston, USA (selected Best Poster Award nominee). Poster] The 7th International Conference of Manufacturing Technology Engineers 2018, "The exterior of single-walled carbon nanotubes as a millimeter-long cation-preferential nanochannel". Oral] 2017 MRS Spring Meeting, "Preferential transport of cations along the exterior of single-walled carbon nanotubes assisted by cation-π interaction" Phoenix, USA.
Poster] 2015 16th International Conference on Nanotubes and Low-Dimensional Materials Science and Applications, “Ion Transport Along the Exterior of Single-Walled Carbon Nanotubes”. Oral] 2015 Korean Institute of Chemical Engineers Spring Meeting, “Ion Transport Along the Exterior of Single-Walled Carbon Nanotubes” Jeju, Korea.