Thanks to the digitization of historical knowledge through the efforts of many experts over decades [1], students can now access this information on the Internet with just a few clicks. Using Wikipedia [2] as a data source, EduVis covers historical events, which are relevant to three events in the history course: the First World War, the Second World War and the Cold War. From our history collection, we extract the date and location entities to present the historical articles in the visual interface.
Because supporting exploration within this space is one of the main objectives in the visualization system, researchers have applied visualization techniques to implement visual systems for educational purposes [5]. And then, we build a history collection that has 3,019 relevant Wikipedia documents on three events in the course of history: World War I, World War II, and the Cold War. They allow users to explore EduVis information by location, time and topic in the 20th century.
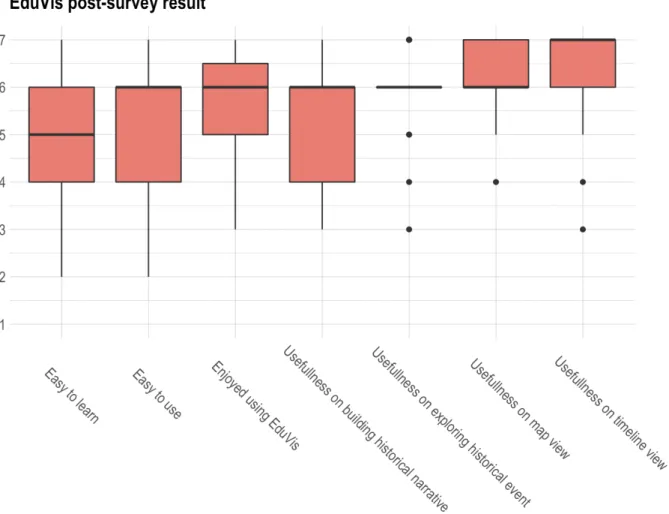
We also provide feedback to our domain experts describing whether EduVis meets the course objectives, based on the results of participants in the user studies. We also discuss the limitations and possible directions to improve EduVis' learning experience based on the exit survey result.
Characteristics of Wikipedia as a Data source
Visualization Systems for Education
From another point of view, Liang and Sedig [8] emphasize the importance of navigation for exploring ILE information as it becomes very large and complex.
Visualization Systems for Cultural Heritage and Cultural History
While they evaluate the system with architecture students, accustomed to the Roman Square area, we evaluate our system with general students, who are unfamiliar with both history and visualization of whole world events. Among the experts, there were two who majored in history (a professor with a PhD in history and an instructor with an MS in history) and who had taught more than one history class at a university each semester. According to our experts, the course covers a wide time range in history, from ancient times to modern times.
The course participants are primarily freshmen and sophomores, none of whom are majoring in history. In recent semesters, the professor and the lecturer have given essay assignments during the course, the aim of which is to ask the students to use not only naive historical facts, but also the relationships between the events and various supplements such as film clips and image sources. So, relying on the textbooks or online messages in history education may lead the students to just repeat the written events and prevent the students from thinking improperly.
We find that teachers expect students to explore and navigate self-interested historical events and connect their new findings to the main topics they learn in the history course rather than simply acquiring and memorizing historical facts. DC1: The system should allow users to explore their own interesting events within the domain of history. DC3: The system must be easy to use because our target users, students, have no specific knowledge of visualization interface and history.
1] target users, students taking history classes, are treated as casual users because they are not majoring in history. So we decided to use the following designs in our interface keeping the designs in our mind. It provides a way to explore and navigate through time to support organizing narratives in chronological order.
And the system should also help users record their findings and questions as they explore the system to keep track of their orientation.
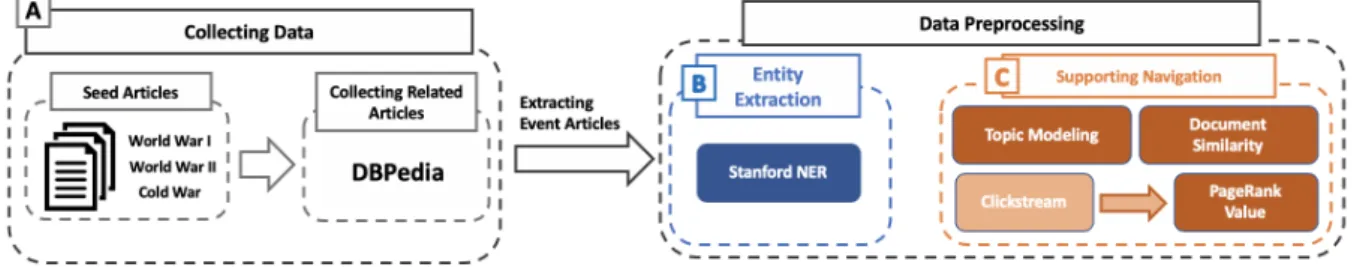
Data Pre-processing
Additionally, we classify them using topic modeling and build two other collections, document similarity and PageRank, to support user navigation within EduVis. We extract 20 topics which are included in the EduVis historical event collection using the Latent Dirichlet Distribution (LDA) topic modeling method [3]. As a result of topic modeling, when an item is included in more than one topic and has a weight greater than 0.25 for each topic, thr items are included in multiple topics.
If not, the articles are included in one topic without considering the topic weight value. We also calculate document-to-document similarities and PageRank scores using Wikipedia Clickstream data [10].
EduVis: The User Interface
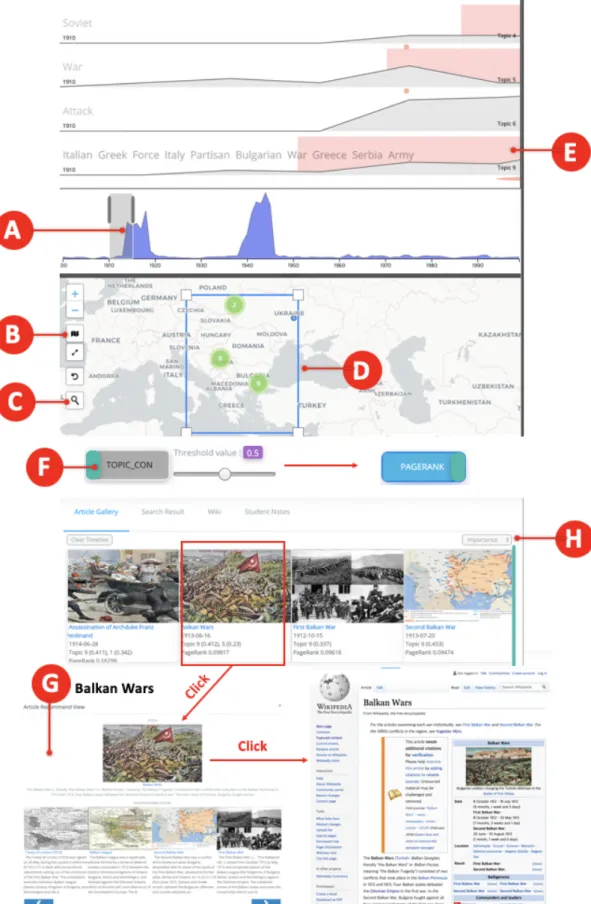
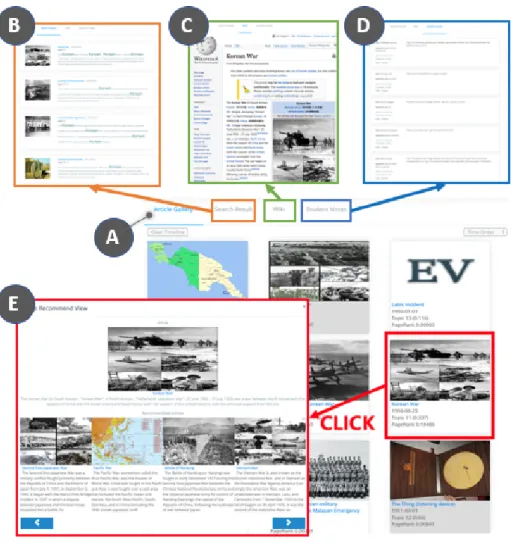
First, users can draw a rectangle through a button (Figure 5 B) to focus the events within it (Figure 5 D). Second, users can click on a country of interest one by one to see the events related to that country (Figure 4 E). Additionally, there is a geography search function that allows users to find an unknown location (Figure 1 C).
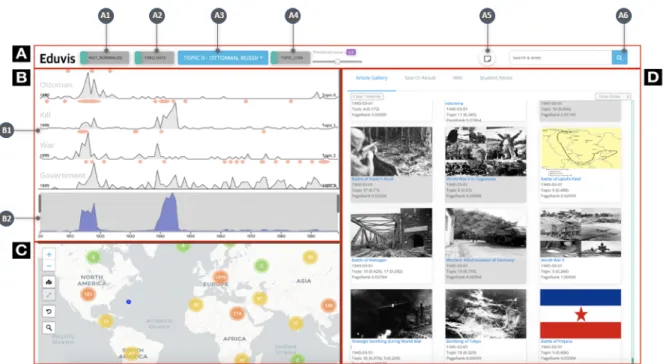
Users can sort articles by time, topic weight importance, or page and topic ranking value. The search results tab also lists articles in response to users' search in the search bar (Figure 1 A6). When users select one in the gallery tab or search result, it displays a pop-up window that presents the selected item and related items that are recommended by document similarity or clickstream data (Figure 3 E).
A1) can be used to normalize the y-axes of the event lines with the maximum number of articles displayed in the event view. When (A1) is turned on, because the number of documents for each topic is not evenly distributed, it is often difficult to notice changes in the line with a small number of documents in the topic. Users can choose to use all dates or just one representative date associated with an event when drawing the event view (A2).
For example, when (A2) is turned off, the "World War II" event is only associated with it, and users can only find it at the one time point in the event line that it is included in. But when (A2) is on, the WWII event is linked to multiple dates, so it appears multiple times in the event line. Using (A3), users can decide which topics to show or hide in the event view.
With (A4), users can choose to receive suggestions based on topic weight or PageRank value.
Interactions between Coordinated Multiple Views
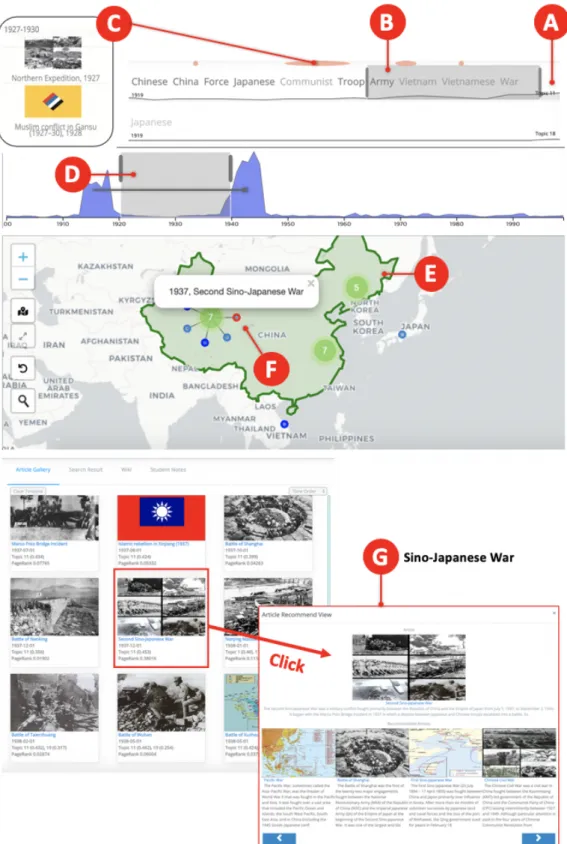
The gallery tab (Figure 3 A) lists Wikipedia articles with their metadata, including title, date, topic, topic weight, and PageRank value. Since suggested events have different representations in event lines and map views, they are colored in gray here. At the top of the interface (Figure 1 A), there are the switches for various functions to configure advanced EduVis setting.
When topic weight is used, the suggestion criterion is the topic weight of the articles in a topic. And when pagerank is used, the suggestion criterion is the PageRank value calculated by the clickstream network. The slider bar (right of Figure 1 A4) is used to set the criterion value as the threshold to recommend documents in three previous views.
When the (A2) option is on, if any of the dates associated with the events are included, they also appear. In the same context, when the users select region of interest by drawing a square or clicking countries in the map view, other views are updated accordingly. Especially in the case of drawing a rectangle in the map, light red areas in the event lines briefly indicate where the filtered events are which topics they include (Figure 5 E).
Additionally, when users click on a circle of an event element on the map and not on a clustered marker, the article gallery automatically scrolls to display the document associated with the selected event in yellow. Finally, in the Article Gallery tab, when a user hovers over an article, the center of the map view moves to the location. Then the corresponding clustered marker is spirally distributed and the target event is highlighted in red (Figure 4 F).
Below, two usage scenarios describe how Edu-Vis can be used to explore and navigate through different events and to interpret connections between events.
Usage Scenario 1: Building a narrative while exploring information
This section presents two usage scenarios performed by real users, one graduate and one undergraduate student of Computer Science, along with history education specialists.
Usage Scenario 2: Building a narrative for a given question
Participants, Tasks, and Procedures
Result Analysis
Once participants find an interesting event in the region, they tend to explore events in neighboring countries without changing the time frame. Regardless of the local, temporal, and current perspective, a rich visual context allows participants to explore the time periods with peaks in the event graphs or high-density areas on the map. They determine the range of the period in the timeline filter and create a brush around Africa.
It found three events 'Ekumeku Movement', 'Battle of Zanzibar' and 'Battle of Kakamas' in West, East and South Africa respectively. Of the keywords in topic 14, which contains most of the events in the early 1910s and in Africa, 18. Initially, experts see EduVis as a tool that can provide students with opportunities to explore new findings, which are not covered in conventional classroom materials.
In particular, experts are encouraged with cases of T1 and T6 who voluntarily seek to find and interpret events in a region where a smaller number of events occur in the event view. Experts also agree that T1, T6 and C13 try to draw a big picture on the relationship between historical events in the early 1910s based on their findings. We expect to be able to overcome this issue by using the collective intelligence of students in history class.
Michal, "Application of the visualization techniques in engineering education," in International Carpathian Control Conference. Christopher, "Incorporating Nonlocal Information into Information Extraction Systems by Gibbs Sampling," in Association for Computational Linguistics, 2005, pp. Markus, "(don't) mention the war: a comparison of wikipedia and britannica articles on national histories," in International World Wide Web Conferences, 2018, pp.
Stavros, "Vistpro: Spatiotemporal processes visualization in engineering education and crisis training," i IEEE Global Engineering Education Conference, 2017, s. Huamin, "Vismooc: Visualizing video clickstream data from massive open online courses," i IEEE Pacific visualization symposium, 2015 , s. Mina, "Visualisering for ændringer i relationer mellem historiske personer i kronikker," i International Conference on Information Visualisation, 2012, pp.