Abstract
List of Tables
List of Abbreviations
Introduction
This study aims to investigate IPOs in India, focusing on short-term stock performance, which will include both the initial low price in the range of 1 to 30 trading days and the performance factors that influence price changes. The objectives of the research are to measure the performance of IPOs during the first 30 trading days to confirm whether investors can earn a positive return at the end of those trading days. The thesis will determine whether issue size, company age IPO, return on assets (ROA), earnings per share (EPS), net profit margin (NPM), profit after tax (PAT),.
Dsouza (2021) proved in their paper that underpricing exists on the first day of trading in Indian markets. This paper considered all 81 IPOs issued in 2021 and 2020, and the stock price return of trading days 1, 7, 15 and 30 will be analyzed for underpricing. The type of data analysis will be cross-sectional, meaning that data from all initially provided companies will be analyzed at one point in time.
Also, panel data analysis was used in the research, in other words the offered companies will be analyzed in different periods of time. Other studies have investigated both short-term and long-term performance, this research has focused only on the short-term, for deeper evaluation and analysis of influencing factors.
Literature review
Initial Public Offerings theory…………………………………………….……………...2-3
Another important factor that has influenced the results of the IPO is the corporate governance of the company. India has relatively fewer requirements for the company's listing compared to other countries such as lower capitalization of the company. India is the second market in the world in terms of the number of internet users.
The age of the company will be measured as the difference between the date of the IPO and the date of establishment of the company. The coefficient of the age variable was negatively related to underestimation, which means it was not statistically significant. NPM is the percentage of net profit after tax divided by the company's sales or revenue.
Promoter's holding is the amount of shares held by the promoter who is involved in the establishment of the company and operational processes. The price, usually driven by supply and demand and the new price, reflects the present value of the company's future cash flows and profits.
Hypothesis development
Research methodology
Research design………………………………………………………………………10-12
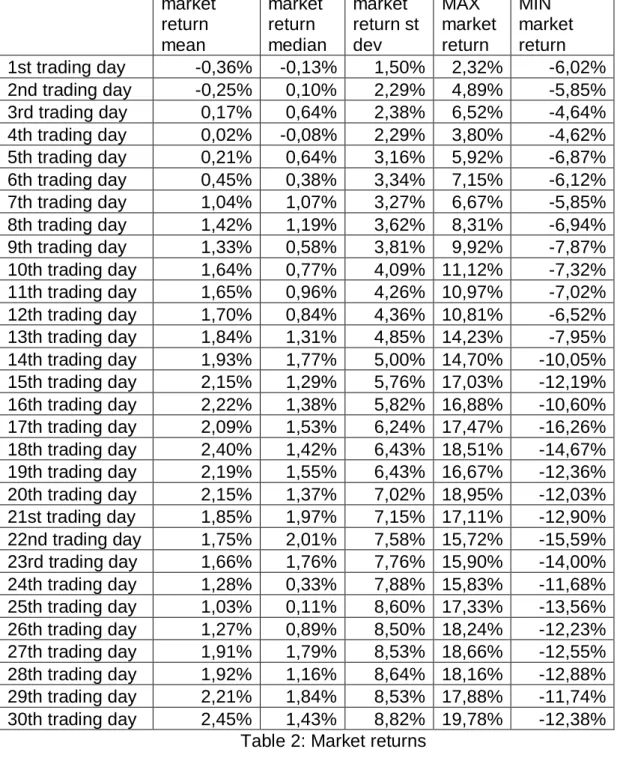
For the benchmark, the returns of the S&P BSE IPO index are also calculated as the difference in natural logarithms: Rm,d = Ln(M1) – Ln(M0). Rm,d – the return on the index at the end of the d-th day; M1 – the closing value of the S&P BSE IPO index on the d-day; M0 – the closing value of the S&P BSE IPO index on the stock's offering day. An abnormal return describes the unusually large profits or losses generated by a particular investment over a period of time, the formula of abnormal return – Ri,d (IPO shares) – E (R).
The expected return is calculated by the formula Re=Rf+β*Rm, the risk-free rate is obtained from the Damodaran database, as the industry-specific country risk premium associated with each IPO company. After calculating the expected return, abnormal return was found by subtracting the return of the IPO stock. The presence of abnormal returns, which can be positive or negative in direction, helps investors determine risk-adjusted performance.
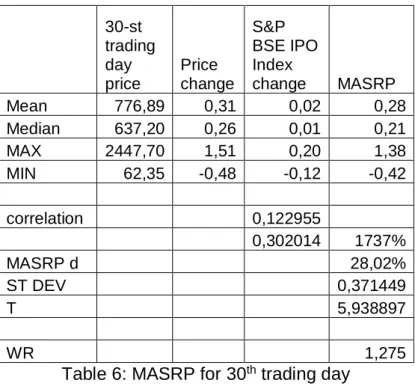
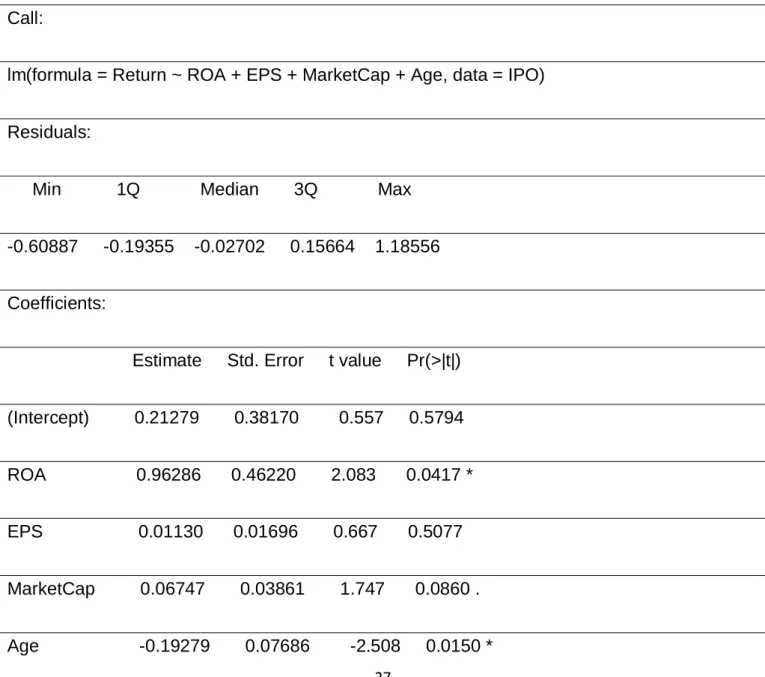
The asset relative ratio has also been used to measure the short-term performance of groups of IPOs in relation to market returns; WRd = (1+ 1/N ΣRi,d) / (1+ 1/N ΣRm,d). Through multiple regression analysis, which has been carried out by R Studio program, the research analyzes such key figures as ROA, market capitalization, company age, NPM and EPS, issue size, oversubscription, promoters' holding and PAT to show the influence of the listed company's financial performance on stock returns at the end of 30 trading days. This technique helps to recognize the direction of the relationship between the dependent variable and the chosen independent.
Regression shows high R-squared data and adjusted R-squared data showing the proportion of variance for the dependent variable (y) explained by the independent variables (x). IPOs listed on a national stock exchange and traded for short-term analysis are common stocks. Information relating to the offer price, listing date, issue price and closing asking prices was available.
For the factors influencing the price performance analysis of IPOs: all IPOs for which data are available are considered for the study. There are a total of 81 IPOs for the years 2020-2021, after applying the sampling criteria, there is 1 company that has been removed from the list, 18 companies were from the financial industry and have no information available.
Data collection…………………………………………………………………………12-13
The choice was made between the NIFTY 500, NIFTY 50 and S&P BSE IPO indexes, which consist of IPO companies, and after testing for correlation between index returns and initial returns, the S&P BSE IPO index was chosen, which is a showed a higher significance level and return of the index. index will be used to analyze abnormal returns. The S&P BSE IPO Index is designed to measure the performance of companies listed on BSE Ltd. After sample selection, there are 62 companies that met the criteria, representing 77% of all offers for the chosen period.
IPO underpricing levels………………………………………………………………13-17
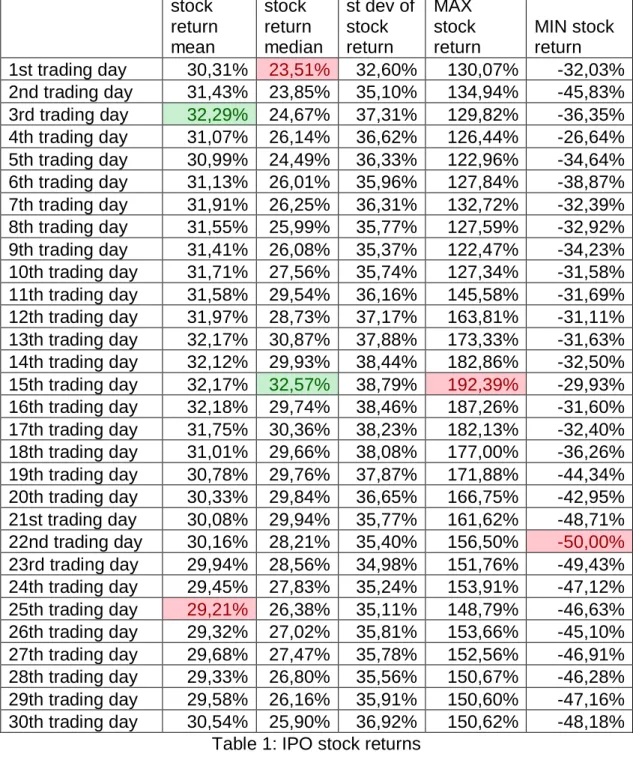
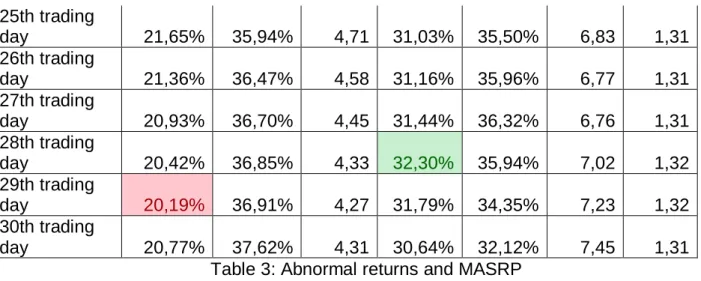
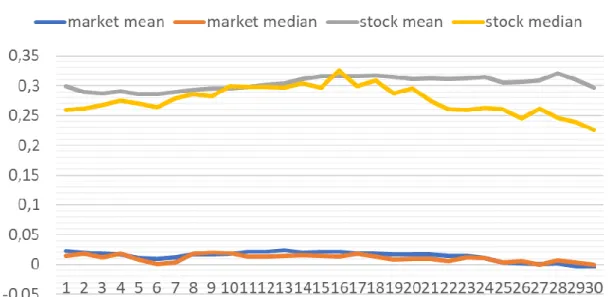
From the analysis we can conclude that on the 3rd trading day the highest average stock return and on 15th trading day the highest median return, also maximum value of return. Wealth relative index is higher than 1, which means that all 30 trading days IPO stocks have outperformed the market. Chopram Phil (2011) to measure the short-term performance of risk-adjusted IPOs, assuming that the systematic risk of the newly listed stock is 1.
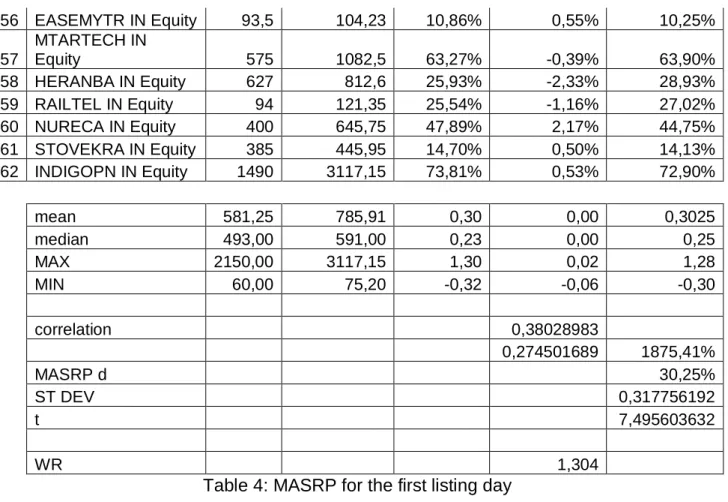
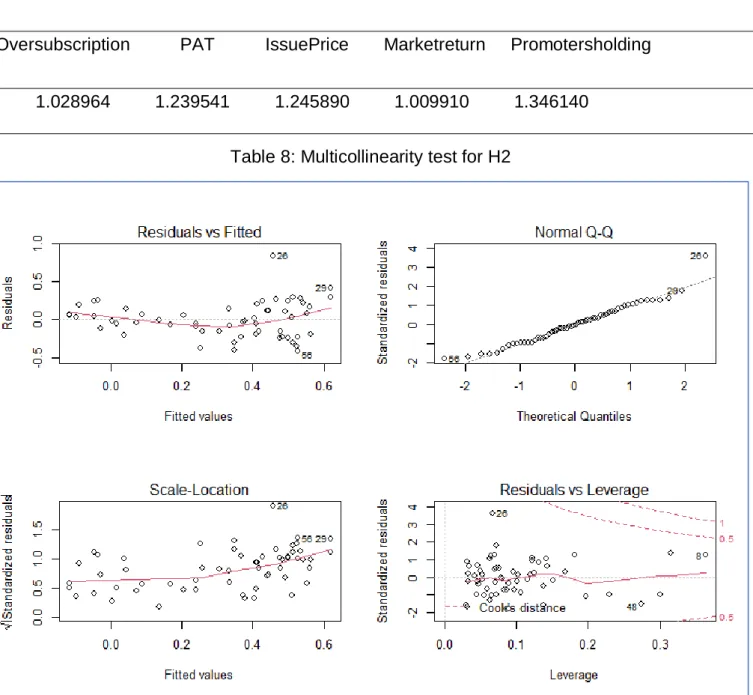
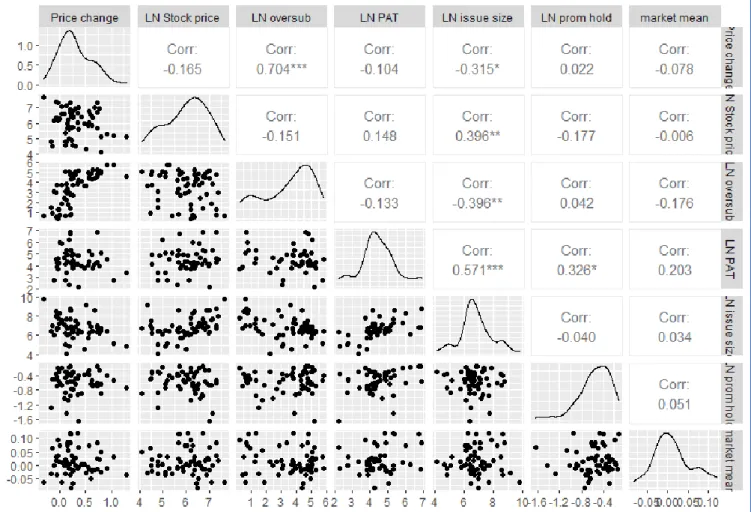
From the analysis, it is said that average and average highest return on 15th trading day, maximum return on 15th trading day as well. Average correlation between each IPO stock and market return – 0.36, which means the data can be used for analysis. Initial IPO returns are regressed on firm age, issue size, issue price, market returns.
Oversubscription, PAT and Promotersholding, β0 is the intercept, β1 to β5 are the coefficients of various independent variables and εi is the error term of the regression equation. Multicollinearity test showed that in all variables low level of VIF, which means that there is no bias of multicollinearity. For 1 unit increase in age of the firm, IPO stock return decreases for 0.193, which means that there is negative relationship between variables.
The regression analysis shows that only the oversubscribed value and age of the company influence the return on the IPO shares. Net profit margin exhibits a multicollinearity bias among other regressed variables and was therefore removed from the regression analysis. Investors can use the oversubscription factor and the age of the company to analyze and predict future returns of the stock.
Moreover, the tested variables used in this study were not statistically significant, which means that other financial and non-financial indicators should be used to obtain higher R-squared and adjusted R-squared in multiple regression analysis. Initial Public Offerings Short and Long Term Performance of MENA Countries, European Scientific Journal, Vol. An empirical investigation of the short-term performance of IPOs in India, International Journal of Financial Management, Vol.2, 11-16.
The Economic Times, Official Citation, 2022 https://economictimes.indiatimes.com/hp-adhesives-ltd/stocks/companyid-2020833.cms [accessed 1 January 2022]. An investigation of the short-term performance of the Canadian IPO market, Research in International Business and Finance, 102-113. A study of the peculiarities of the organization of the IPO process as a tool for attracting investments in Russia, 1-14.
IPO over-subscription data, quote, 2022 https://www.chittorgarh.com/report/ipo-subscription-status-live-bidding-data-bse-nse/21/?year=2021 [Accessed 1 January 2022 ].