1
CHAPTER 1
INTRODUCTION
1.1 Background
Electricity has become one of the most prominent necessities in this world today.
With fast development and emerging industries worldwide, the requirement for a good and reliable power supply have become an important factor. There are many challenges in power distribution, which includes maintaining a good power quality at all time. Power quality has since become a major concern in the power networks. By definition, power quality is a set of electrical boundaries that allows an equipment to function in its intended manner without significant loss of performance or life expectancy [1]. An ideal power system is defined such when a perfect sinusoidal voltage signal is seen at load- ends. In reality, however, such idealism is hard to maintain, as any deviation from the perfect sinusoidal waveform is considered as distortion [2]. Voltage and current distortions or also referred as ‘harmonics’ has since become an active topic for researchers and entrepreneurs in finding for a solution.
Harmonics are currents or voltages with frequencies that are integer multiples of the fundamental power frequency. Harmonics current are fed by the non-linear equipments, which disrupts the desired ideal linear system [3]. These distorted current pulses, due to Ohm’s law, will also begin to distort the voltage waveforms, where it would be carried back to the distribution network [4]. Till date, the increasing use of nonlinear loads in industry keeps harmonics a rising issue in distribution network despite countless efforts being tested and implemented to obtain optimum power quality [5]. Power networks with
2
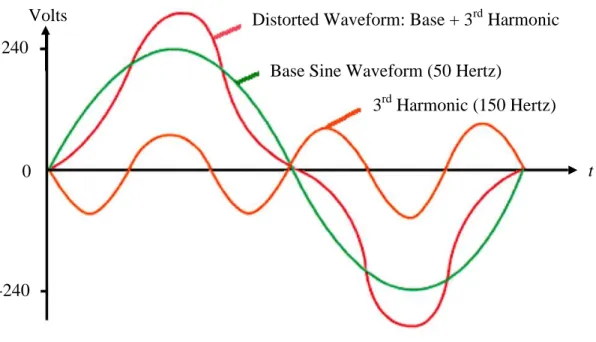
harmonics above tolerance deteriorate the power quality and hence cause undesired problems and issues at both generation and user-ends. IEEE Standard 519-1992 outlines the normal tolerance of harmonics voltage to be not more than 5% THD [6]. For better comprehension, decomposition of 3rd-order harmonics from a distorted waveform is illustrated in Figure 1.1. The 150 Hertz waveform is defined as 3rd-order harmonics due to its third integer multiple of the fundamental power frequency of 50 Hertz, which is the base sine waveform.
Figure 1.1 Distorted waveform composed of base sine waveform and 3rd-order harmonics
Harmonics form a very broad field of study. Hence, understanding the type and source of harmonics in each individual network is essential for a fairly accurate analysis and system optimization. In a distribution network, power is being generated and supplied to various types of equipment. The presence of harmonics in the system is an obvious problem but to which extend is the necessity to observe and minimize this distortion? Generally, harmonics can be categorized into positive sequence, negative sequence and zero sequence. Harmonics of 1st-order, 4th-order, 7th-order, 10th-order and
Distorted Waveform: Base + 3rd Harmonic Base Sine Waveform (50 Hertz)
3rd Harmonic (150 Hertz) 240
0
-240 Volts
t
3
subsequent orders are defined as positive sequence. Whereas, the negative sequence harmonics consists of the 2nd-order, 5th-order, 8th-order, 11th-order and its subsequent orders. Zero sequence harmonics falls in a same trend as above harmonic orders, in which every order in the trend is followed by the third order from the former; harmonics of 3rd- order, 6th-order, 9th-order, 12th-order and 15th-order falls under zero sequence [7].
Harmonics with a positive sequence generally causes overheating of conductors, transformers and circuit breakers. Negative sequence harmonics can cause the same heating problems as positive harmonics plus additional problems with motors. Unlike positive and negative sequence harmonic currents, the zero sequence harmonics does not cancel but add up arithmetically at the neutral bus, causing overheating and related harmonics issues [8]. The major concern is the effect that harmonics distortion could impose; such as potential fire hazard, excessive heat, false tripping of branch circuit breakers, increased risk of faults from overvoltage state developed on power factor correction capacitors and subsequently increases maintenance cost [5,9].
The biggest challenge utilities face at present, is to provide reliable services to support the ever growing power demand. For instance, India faced critical power issue with several blackouts in 2012 due to the energy suppliers’ failure to meet the growing demand [10]. The solutions are often very costly.
As part of the EPRI Reliability Benchmarking Methodology project, investigators explored the idea of estimating the voltages at locations without prior inspection. This led to the development of the power quality state estimator (PQSE), which uses feeder models and recorded data to estimate the system output [11]. There are two parts to state estimation (SE); modelling and algorithms. The overall approach is to use a model to foretell the behaviour of the system in a particular state, and then compare it with the actual telemetry from the system. This is to conclude which state is most likely to produce the observed system behaviour [12]. However, these assumptions have simplified the implementation but generate several practical problems.
Harmonics analysis consists of three main stages; harmonics pseudo-measurement or data recording, harmonics state estimation and post-fault analysis, as shown in Figure 1.2.
4
Figure 1.2 Block diagram of harmonics analysis process
Before an estimation model is being constructed, a set of known data derived from intended location is essential. These data, or also called as pseudo-measurements, are gathered using power analyzers. The complexity of the equipment influences its price and affordability. As an alternative, harmonic estimation and time-series prediction are being explored.
Estimation capacity is defined as logarithmic information measure [13], which provides reliable information for the analysis. Early studies suggest the usage of Global Positioning System (GPS) receiver at every local system to synchronize harmonic phase measurements with accuracy of 1µs. However, the high expense of harmonic instruments and installation of communication channels limits the number of meters in network [14].
Therefore, harmonic estimations are essential to solve complex problems. Before the invention of power analyzers, harmonics estimation is carried out by measuring the load current and then computing the harmonics via Fourier series [15, 16]. The size and complexity of modern power networks makes it difficult to monitor a complete system.
Time-series prediction or often called as forecasting, on the other hand, works as a planning tool that helps management in its attempt to cope with uncertainty of the future,
Harmonics pseudo- measurement
Harmonics State Estimation
Post-fault analysis
Stage 1 Stage 2 Stage 3
- Data collection - Error elimination - Filter installation - Maintenance
5
relying mainly on data from the past and analysis of trends. Forecasting can be simply categorised into long-term, mid-term and short-term. A long-term forecast is usually applied by futurologists to explore the low-probability, high-impact events. For instance, this is practised by the projects on National Security Reform’s Vision Working Group [18]. Whereas, mid-term forecasting concentrates on the factors that drive the evolution of power and challenges the conventional notions of waning plants or resources [19].
Short-term forecasts seek to understand the not-too-distant future, but are, all the same, enlightened by the developments occurring at presence [20]. Hence, short-term forecast is the most essential forecast technique to prepare for harmonic issues, which are to occur in the not-too-distant future if left untreated.
Once pseudo-measurements are collected, they would be fed into the Harmonics State Estimation (HSE) model to economically determine the location and magnitude of harmonics in a power network and identify its source of harmonics.HSE is the fundamental for harmonics analysis in power networks. There are two main parts to state estimation (SE); modelling and algorithms. The overall idea of a HSE model is to use feeder models and recorded data to foretell the behaviour of the system in a particular state, and then compare it with the actual system [21]. Many mathematical methods, such as Fast Fourier Transform (FFT) and Least Squares (LS) have been developed over the years and have been proven that by using only partial or selected measurement data, the entire harmonic distribution of the actual power system can be obtained effectively [22].
Hence, it is important to determine the harmonics voltages in power network in order to take appropriate corrective measures. The possible solutions for power system harmonics include passive filter, active filter or hybrid filter. The most common method for harmonics filtering is by installing passive filters at power network where necessary.
It filters harmonics within a selected bandwidth, while active filters shows a more sophisticated filtering concept of real-time harmonics cancelling [23]. Hybrid filter, on the other hand, combines the advantage of both active and passive filter.
6 1.2 Scope of study
This research focuses on a specific stage of harmonic analysis; harmonic pseudo- measurement. A real-life situation is investigated and a proposed solution is discussed.
The proposed technique aims to fully utilize existing resources, and therefore leads to a novel approach. Although the system is developed with MATLAB environment on an offline network, it is fully aimed to improve power quality of the intended distribution network and prevent future undesired occurrences. This study also highlights the importance of reducing cost at the first stage of harmonic analysis to reduce the overall maintenance cost of any distribution system. A comparative study between an existing system and the proposed system is also carried out through MATLAB simulation to validate the claim that the proposed system is better than the existing system.
1.3 Problem Statement
University Teknologi PETRONAS (UTP), located in a small town Tronoh, was established in 1997 with a unique attempt to utilize gas to produce chilled water for air- conditioning and waste heat for power generation. It is configured to lower the peak load demand and reduce investment for peaking capacity especially for a large building complex [24]. A typical gas district cooling plant can be simply illustrated as in Figure 1.3.
As potential as it can be, however, this power generation does not meet its expectation in producing reliable power supply. In an online survey conducted around the campus area in May 2011, the students’ response shows that harmonic issues do exist in the system (Refer to Appendix A). The survey was categorized based on students from different residential villages in UTP to identify the most troubled village. It targets students from various clusters and year of study. Out of 100 students whom participated in the online survey conducted, 86% of students agree to have experienced power failure/blackout in campus and 10% complained of frequent occurrences of such incidents. Among the 10%
7
of student whom complaint frequent power shortage, a surprising figure of 8% was found to be resided in residential village 3 while the remaining 2% mentioned power troubles during class and laboratory hours. Among the issues brought forward were loss of important data and documents in personal computers due to sudden power failure and long hours of laboratory due to frequent power failure, which also causes complications to the laboratory equipment.
In 2009, the research and technology division from PETRONAS, or also known as Group Technology Solutions (GTS), was invited to conduct harmonic study around the new academic complex to investigate on the multiple power failures. As an outcome, GTS reported THDV to be 4.4% of the fundamental at every phase in selected academic blocks; Block 2, 3, 5, 13, 17, and 22. This information is vital and has led to many harmonics analysis conducts at UTP distribution network [24] - [26]. However, in recent years, despite much harmonic issues that has aroused, no proper analysis has been carried out due to limited resources. Therefore, there is a need to supervise the UTP distribution line in the most cost-efficient and reliable method.
The summary of problem statements is listed below;
a) In midst 2011, under a research grant in UTP, a power analyzer was purchased for academic purposes. Although the analyzer has huge potentials, the usage is limited to data collection for research and academic purposes due to its cost and complexity. Only a single unit of power analyzer cannot serve the purpose of complete harmonics monitoring across the campus. Therefore, the campus clearly lacks a reliable system to monitor and prevent future harmonic-related incidents, which has also subsequently increased the maintenance costs.
b) Since the study focuses on the harmonic issues at load-end (i.e.: power shortage at residential villages and academic blocks), a non-linear system would serve best for the harmonic monitoring due to the fact that an electric load is a non-linear function. Therefore it is indispensable for development of optimal ANN-based harmonics monitoring system to optimize the use of the existing power analyzer in UTP. Intelligent techniques on the other hand, require optimal network
8
structure with the most appropriate training algorithms to suit the targeted distribution network. Careful selection on these techniques will then improve the accuracy of the final product as well as the performance of the network.
1.4 Research aim and objectives
The impetus of the study is mainly to optimize the use of the power analyser and monitor as many locations as possible at a time with minimal cost. The research objectives are set to solve the problems that have been brought up, which are;
a) to propose an intelligent system that provides complete monitoring of harmonic fluctuations at UTP distribution line,
b) to develop a reliable algorithm for the short-term harmonic monitoring by utilizing the actual harmonics data from UTP campus, and
c) to forecast harmonic voltages ahead, which allows preventive measure to be taken beforehand.
The proposed system shows novelty as no previous work has been recorded to neither propose nor overcome harmonic issues in UTP distribution network. Since the usage of power analyser tool currently, limits the number of monitoring station to one at a time, the proposed system is expected to increase efficiency of complete distribution network surveillance and reduce monitoring time and cost
In order to accomplish these objectives, it is very important to carry out network assessments on the bases of the average estimation and forecast error, and network performance using different training approaches. The models are carefully trained by feeding reasonable data gathered from the power analyzer. Possibilities for minimizing the error means of other intelligent-based technique are also explored and evaluated.
9 1.5 Assumptions
To achieve the aforementioned research objectives, a number of assumptions have to be made;
a) it is assumed that the instrument error is below tolerance since the tool is fairly new purchase and implies to the standard calibration. Fluke 1750 power analyzer calibrated with harmonics current and voltage reading to be ± 0.5 % reading and
± 0.2 % full scale for the 1st to 20th orders, while from 21st to 50th order harmonics, the voltage and current expected to be ± 1 % reading and ± 0.3 % full scale; with current sensor accuracy of 1% from 10 mA to 5 A.
b) The phase angle is not considered in the system since the power analyzer used to log data was not able to record the phase angle data. Therefore, the phase angle is considered stable.
1.6 Research Motivation
The residents or students in UTP currently do not enjoy the benefits of such intelligent power generation system due to the issues that occur very often. At present, no preventive measures are taken beforehand to prevent power failures in the campus area. This is mainly due to lack of tool or instrument, and also expertise to monitor the harmonic fluctuations in the distribution line. Therefore, the campus is in need for a reliable surveillance system that is not only user-friendly but also cost-efficient.
An optional tool that enables efficient harmonics monitoring in UTP distribution network would allow a virtual surveillance system to be implemented and thus, reduce probability of power failures in near future.
This is expected to reduce the maintenance cost as prior measures can be taken to avoid future power failures. Reduction in terms of equipment will also be possible as each surveillance point can be operated
10 1.7 Outline of the Thesis
This thesis contains five chapters, neatly divided to elaborate each section. The first chapter provides a background study on harmonics and the need for harmonics estimation at UTP’s distribution network. Thesis objectives and scope of study are clearly outlined here.
Chapter 2 discusses classical methods and the state of art in general. This section attempts to provide a review on harmonics studies over time and weighs the advantages and disadvantages of several common and famous techniques.
Chapter 3 demonstrates the proposed harmonics pseudo-measurement monitoring system using AI techniques. The AI concept and techniques are also introduced and discussed further on its applications to the proposed system.
Simulation results and discussions are presented accordingly in Chapter 4. The estimated and forecast values are compared with the actual data collected from data logging using Fluke 1750 power analyzer to determine its validity. The competence of the monitoring system is clarified further by comparing the proposed system with a traditional system.
Chapter 5 concludes the thesis by providing a review on the whole work and recommendations on future works.
11 CHAPTER 2
LITERATURE REVIEW
2.1 Introduction
The presence of harmonics in distribution line was noted ever since alternating current was introduced. However, this issue of distortion that affects the power quality was not understood initially and was merely referred as a ‘mystery’. One of the first documentation on harmonics was recorded back in 1894 by Edwin J. Houston and Arthur E. Kennelly [27], where a keen understanding of harmonics as well as its effects on transformers and motors was neatly described with simple graphical interpretations. The basic idea in harmonics studies is to measure the harmonics injected by the non-linear loads and minimize the unwanted harmonics [28]. Various studies have been conducted on harmonics and distortion since 1960s. Before the invention of AI techniques, harmonics issues were treated with conventional mathematical models to detect and minimize unwanted harmonics in distribution line.
One of the most primitive methods used to calculate the steady-state solution was to integrate the accompanying system of non-linear differential equations for as many cycles as required, until the transient response disappears, leaving only the periodic, steady-state response. This is the case in any of the highly developed electromagnetic transient programs; EMTP and PSCAD/EMTDC [29]-[31]. This approach, however, does not always yield satisfying results because some power networks are lightly damped and because of difficulties in establishing suitable steady-state initial conditions [32]. This solution approach is also time-consuming and sometimes inconclusive [33].
12
2.2 The revolution of Harmonics State Estimation in power systems
Initial growth in power quality was the replacement of conventional analysis of harmonics by state estimations; harmonic state estimation (HSE). Early researches commonly suggests fast Fourier transform (FFT) and least-square methods for state- estimation [9, 17, 34]. Fourier transform is an old method of computation, which was developed in attempt to determine the orbit of certain asteroids [35]. It is later been adopted and tested in various fields due to its computational advantages. FFT offers reduced computations that other methods and also involves the transformation of sequences [36]. FFT methods were advantageous when computations are to be performed on a machine with limited core storage. However, FFT has been proved of its non-feasibility in a recent research. It is found that FFT enables estimation of the fundamental amplitude and its harmonics with a reasonable approximation but compel disadvantages on window dependency resolution. FFT also performs well for estimation of periodic signals in stationary state but fails to perform well for detection of sudden or fast changes in waveform [37]. State-estimation by least-squares technique uses direct solution using rectangular coordinate system. A.P. Sakis Meliopoulos [16] implements sensitivity and observability analysis to increase precision of least-square estimation.
However, in the research, the confidence level computation showed the existence of constant instrument error. Huaiwei Liao [38] later, pointed out that standard least-square based method have difficulty obtaining reliable estimates when measurements are less than state variables, which are identified as underdetermined system.
In any traditional method, a common challenge often faced in harmonics state estimation issues is the underdetermined systems of equations. This issue is often solved by assuming those busses with or without loads thought not likely to contribute harmonic emission, as zero harmonic injection. In 2005, T. L. Tan [39] underlines that the problem with this technique that the voltage measurements at those buses known or assumed not to have harmonics producing devices cannot be used. Loads that are thought not likely to emit harmonics may not be true. Later, Huaiwei Liao [38] showed that underdetermined
13
system can be observable by utilizing the spatial sparsity of harmonic sources under proper measurement arrangement. However, this approach is rather time-consuming and expensive in meter placements.
The most common state estimation technique in industry is based on the weighted least squares (WLS) method [40]. It usually operates in a cycle of estimation-detection- elimination until an acceptable result is obtained [41]. Despite its advantages in detecting and identifying single and multiple gross measurement errors, WLS is rather time consuming to perform such bad-data detection and identification procedures online for large systems [42]. A basic Newton Raphson WLS method has a very long computational time due to the gain and Jacobian matrices associated with the basic algorithm which requires large storage and has to be evaluated every iteration. N. Mohd Nor [43], attempts to reduce the time taken to construct the Jacobian matrix by reconstructing or rearranging the H matrix and proves its effectiveness in reducing the computational-time. Though, the WLS based estimator cannot effectively detect and identify multiple interactive and conforming bad data. The most important drawback of least square method and alternatives is their high sensitivity to outliers. This is a due to the usage of squares as squaring exaggerates the magnitude of difference (e.g., the difference between 20 and 10 is 10 but the difference between 202 and 102 is equal to 300) and therefore gives a much stronger importance to extreme observations [44].
2.3 Artificial Intelligence Techniques in Harmonic Analysis
Since the early to mid 1980s much of the effort in power system analysis has turned away from formal mathematical modelling to the less rigorous techniques of Artificial intelligence (AI) [45]. AI began with “an ancient wish to forge the gods”. Modern AI was developed by classical philosophers, back in 1940s, who attempted to describe the process of human thinking as a mechanical manipulation of symbols [46]. AI techniques have been introduced to overcome the disadvantages of non-parametric techniques, such as the Fast-Fourier transform (FFT) and wavelet transform (WT) [47].
14
In early years, neural network have been actively used for estimation of harmonic components in power system [48]-[53]. Various techniques were proposed. For non- linear systems, several Fuzzy Kalman filtering algorithms have been developed to extend Kalman filtering for such system. Hazem N. Nounou [54] presented multi-scale fuzzy state estimation using stationary wavelet transforms or known as multi-scale Fuzzy Kalman (MSFK) filtering algorithm. A fuzzy system is an approximator which consists of a set of IF-THEN type rules, each of which has a premise and a consequent part. Fuzzy models have been found very useful for control purposes as for their ability to describe complex system in an efficient manner. However, to achieve a good fuzzy control, reliable state estimation is essential. In terms of harmonics state estimation where measured data usually contain multi-scale features, fuzzy filtering techniques are not effective. Fuzzy filtering techniques are single scan methods where it is assumed that the measured process data only contains features with fixed contribution over time and frequency. MSFK then uses scaling function coefficients of the data obtained using Stationary Wavelet Transform (SWT), and then selecting the optimum fuzzy Kalman filter, which minimizes a cross-validation estimation error criterion [54]. Although Kalman Filter is fairly accurate, it has high mathematical burden which limits its use for on-line tracking [55]. Wavelet-based signal processing algorithm in general, introduces lag that is equal to the length of the used window and hence, impose limitation on on-line applications.
Adaptive perceptron approach in neural networks has been tested and applied successfully for power systems harmonic estimation [56]-[57]. The neural estimator was based on the use of an adaptive neuron called ADALINE. Adaptive tracking of harmonic components of a power system could easily be done using this algorithm [58]. However, ADALINE network is limited to only one output neuron. The convergence of ADALINE slows as the number of harmonics included increases and it is also subjected to fall in local minima [59]-[61].
Another common method is the back-propagation neural network, which uses supervised training approach to identify selected harmonics. This method treats harmonics detection problem as a pattern recognition problem [62]. ANN is one of the
15
earliest methods used in AI. In 1990, R.K. Hartana [63] had published a patent work using ANN method for harmonic source monitoring and identification, while in 1992, another patent [64] has been recorded to implement ANN based method for power systems harmonics voltage prediction. Due to its reliability regarding many other techniques available, ANN is still a popular technique in current researches; in harmonic estimation [65] and also harmonic analysis [66]. A review by M. Tarafdar [67] shows that application of ANN in power systems have shifted from analysis to the operation phase, where forecasting of systems has a special interest.
However, a common drawback is seen in a basic back propagation approach where the time taken for convergence is fairly long and the solution often stuck at local minima [68]-[70]. M. Gupta [55] introduced a faster training algorithm for estimation purposes, which utilizes particle swarm optimization (PSO) combined with gradient descent (GD) to train weights of neural network. This hybrid algorithm has also been proved to be more advantageous than genetic algorithm (GA), PSO or GD on stand-alone. The advantage of this hybrid algorithm is fast convergence with no possibility of getting stuck in local minima. The surety of not getting stuck in local minima is due to PSO and fast convergence is because of GD. The NNs are trained to uniquely identify various types of devices using their distinct harmonic “signatures” as their input.
In 1994, while ANN technology was actively being explored in harmonic studies, D.K.Ranaweera [71] highlighted the concern that the ANN methods applied for load- forecasting problems do not flag mathematically when they are extrapolating from the training data, and therefore creates room for invalid forecast as a result. Classical ANN techniques concentrate on global fit, while gives poor fit on local regions [72]. Therefore, it underlines the main unmet need of users who wishes to use ANN techniques in forecasting; the determination of confidence intervals for each load forecast. Newer generation Radial Basis Function (RBF) techniques employs hybrid algorithms, in which varies nonlinear time-varying techniques are adopted when training the RBF neural network (RBFNN) [73]. Real time experiment of time-series prediction on different practical load types of Taiwan power system (Taipower) were carried out to compare between an RBFNN network with nonlinear time-varying evolution PSO (NTVE-PSO)
16
algorithm and existing PSO algorithm [73]. Simulation results proved NVTE-PSO algorithm has better forecasting accuracy and computational efficiency for different electric demand.
The idea of RBF was drawn from the theory of function approximation. An RBF network is similar to a feed-forward neural network, only with slightly different approach [74]. RBF methods were tested on harmonic studies for over a decade and has gained popularity in time-series prediction in early 1990s [75] and have since continuously applied and enhanced to suit various needs [46], [76]-[77]. In general, it is capable of approximating highly nonlinear functions, the training can be done in a sequential manner, and the use of local approximation gives better generalization capabilities [66]- [68]. However, this method seems to show the same disadvantages found in a back propagation neural network approach [46].
2.4 Artificial Intelligence in Harmonic Estimation
Each system display unique attributes and therefore, a suitable problem solving method need to be identified before evaluating its performance. D.O. Abdeslam [65]
proposes a new approach to improve the performance of conventional Active Power Filters (APFs) by using ANN for harmonic estimation. The separation of powers is implemented with an Adaline NN based on a prior knowledge of frequency waveform, in which, a multilayer NN was used to generate reference currents to cancel the unwanted harmonics. To test the effectiveness of the proposed method, a common power quality environment was created mathematically, with nonlinear loads to create distortion. The method is justified by showing estimation error to be 0.01%, whereas the THD parameter reduced to 0.85% after the neural estimation compensation currents are applied.
Although M.J. Ringrose [78] in his paper aims to monitor multiple harmonic sources using state estimation, the initial measurements or pseudo measurements are provided using NN. NN serves the purpose well due to the highly complex and poorly defined input-output relationships between the harmonic and power flow measurements and the
17
harmonic sources. Using this technique, harmonic sources could be monitored using only a few harmonic-monitoring stations. Similar approach was used by R.K. Hartana [63]
back in 1990. NN used to make initial estimates of harmonic sources, which are then used as pseudo measurements for harmonic state estimation, which further improves the measurements.
Another recent research [79] exploits the few real-time measurements from distribution systems to provide an initial estimation of harmonic currents. Bayesian approach was used to estimate the source of harmonic distortion in the tested distribution network; laboratory scaled small low-voltage single-phase network. However, similar to earlier researches, a prior knowledge about the harmonic behavior of the load was determined. The a prior information was modeled with Gaussian distributions so that a closed-form solution of the estimation problem was possible. To evaluate the quality of these estimates, a posteriori check on the coherence between the obtained results and the initial assumptions. The proposed technique was validated by performing tests on a small-sized low-voltage distribution network in a laboratory scale.
Other applications of ANN in harmonic estimation include [80] extraction of selective harmonics contents in the signal based on separated and sequential training with RBFNN technique. It demonstrates the capability of RBFNN to estimate the harmonics with half fundamental cycle. To train the algorithm, desired output were computed using FFT on several fundamental cycles of source current waveform.
In short, most researches aims to efficiently estimate harmonics in order to reduce error at HSE. Although PQ analyzers are easily available in market today, attempts to develop virtual analyzers to replace these equipment are being looked at. The virtual PQ analyzer, which is developed with ADALINE technique, provides a flexible analytical and measuring platform without taking hardware requirements into account. The performance was later tested with a series of test signals generated via the arbitrary waveform generator (AWG).
18
2.5 Artificial Intelligence in Harmonics Time-series Prediction
ANN based approach have also gained popularity in prediction of power system harmonic voltages in early 90’s. Mori. H [81] tested the effectiveness of recurrent neural network back in 1991. Unlike the conventional feed-forward ANN, the recurrent neural networks have the advantage of being able to consider the dynamics of a time-series. In early 1995, [82] applied RBFNN model and a back-propagation model to provide peak and total load forecasts for the next day and showed strong results indicating RBFNN to perform better than the back-propagation model. Pacific Gas and Electric Company’s (PG&E) load data for 1985 were used to train the networks and holidays were excluded from both training and testing data sets to ensure that the observations were free from any irregular load patterns.
Most researchers develop approximation tools using a lab or MATLAB-based model.
[83], for the first time, utilize a practical power distribution offered by Thaipower Company. The actual hourly load data was used for the time-series prediction of one-day (24-hr) ahead and five-days ahead. Three different schemes were introduced with 504 numbers of training data for each scheme; to forecast weekdays for spring season, weekdays for autumn season, and weekends across two seasons respectively. Simulation results of the proposed non-linear time-varying evolution particle swarm optimization as the training phase of radial basis function neural network (NTVE-PSO-RBFNN) has better forecast accuracy, superior convergence rate, and shorter computation time than other PSO-RBFNNs in time-series prediction.
2.6 Summary of Chapter
Each network has its own limitations. To overcome these drawbacks, hybrid algorithms were formed and tested for their effectiveness. Although the techniques used in these researches appear to be similar, they were each designed for different problems and conditions. Hence, problem identification is merely as important as choosing the
19
technique for solving. In short, feed-forward neural network with back-propagation training method is the most anticipated approach in estimating harmonics, whereas RBF technique is more widely selected for harmonics prediction. In the following chapter, harmonics estimation in UTP distribution network is carried out using back-propagation neural network technique. Whereas, harmonics time-series prediction uses RBF approach.
20
CHAPTER 3
METHODOLOGY
3.1 Introduction
This chapter will provide an insight of the solution proposed to overcome the problem as stated in Chapter 1, as well as abide with the objectives of the study. The tools used to measure and develop the proposed system are also defined carefully to provide better understanding. Before presenting the proposed system, it is important to understand and learn on the research background, the tools to be used along the process, and the research design that includes data collection technique and interpretations. In short, this chapter discusses on the knowledge acquisition and pre-processing, data collection, in-depth discussion on the proposed algorithm and the algorithm developments. A comparative study is also proposed at the end of the chapter between Virtual Harmonic Analyser and Forecaster (V-HAF) system and a typical system with a forecast network to evaluate the reliability of the proposed V-HAF system.
3.2 Establishing a Research Territory
This research is systematically organized to enable reader to understand the experiments carried out, their purposes and the outcome recorded, with discussions along the chapter for better understanding. The experiments and data logging were carried out
21
at student residency village in UTP, in which powered by Gas District Cooling (GDC).
GDC system will be further discussed in following section as research background. An academic-based tool, MATLAB is proposed due to its user-friendly interface, reliability, and flexibility to compare with other research works.
The techniques used in this research are merely adoption from previous successful research works. After a careful analysis on the most suitable techniques for this study, they are developed with the aid of MATLAB version 7.1 software, and implemented for the case of harmonic distortion in UTP distribution network. A well-known estimation model, which was proven to have shown successful results, is picked for harmonic estimation. The model is briefly known as feed-forward Neural Network. As for time- series harmonic prediction, which forms the second proposed network in V-HAF system, the RBF technique is chosen based on qualities that are discussed further in this chapter.
Section 3.5.1 brings in depth the process of data collection; from meter placement to data segregation.
A systematic research framework is then applied to present the proposed system.
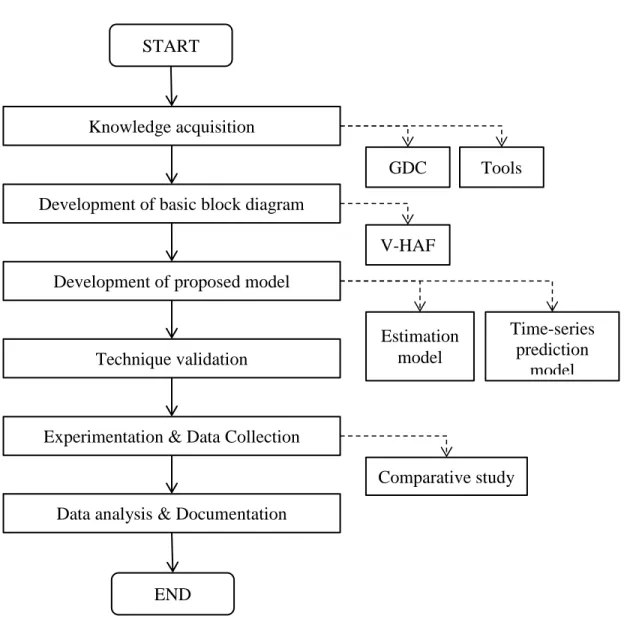
Section 3.5.2 to 3.5.4 discusses on the knowledge acquisition, development of basic block diagram and development of proposed model for each system. Technique validation, experimentation and data collection, analysis and documentation are presented in the following chapter. In short, the research is strictly guided by research framework shown in Figure 3.1.
Upon establishing the two-network system, known as V-HAF, a comparative study is conducted to compare the performance of V-HAF based on the predicted future harmonic voltages. A Non-linear Auto-Regressive with eXogenous (NARX) dynamic recurrent Neural Network is used for the comparative study. The results are evaluated based on MAPE, correlation coefficient and the execution time.
22
Figure 3.1 Research framework flow-chart for research presentation
3.3 Research Background – Gas District Cooling (GDC)
GDC is a co-generation system that utilizes gas to produce chilled water for air- conditioning and waste heat for power generation. Such a configuration helps to lower the peak load demand and reduces investment for peaking capacity especially for a large building complex [86]. There are a total seven districts cooling systems in Malaysia that
START
Knowledge acquisition
Development of basic block diagram
Development of proposed model
Technique validation
Experimentation & Data Collection
Data analysis & Documentation
END
GDC Tools
V-HAF
Estimation model
Time-series prediction
model
Comparative study
23
are all fuelled by natural gas, with two standalone operations and five are cogenerated.
The GDC systems were pioneered in Malaysia by Gas District Cooling Sdn. Bhd.
(GDCSB), with the first plant established in 1997. The plants are located in major cities;
Kuala Lumpur City Center, Putrajaya Plant 1, Kuala Lumpur International Airport, Putrajaya Plant 2, and UniversitiTeknologi PETRONAS (UTP). Unlike other plants, the GDC plant supplying UTP was build out of necessity. The campus is located at the end of power distribution lines in industrial surroundings and therefore, the quality of the available power was not complying with the university’s requirements [84]. Figure 3.1 provides a good illustration of a GDC system, which uses gas and diesel fuel.
Figure 3.2 A typical Gas District Cooling System Schematic for the Kuala Lumpur International Airport Plant [84]
However, it can be said that, to a certain extent, all power plant components possess the undesirable property of introducing distortion into the AC power circuit.
24 3.4 Programming tool
This study utilizes MATLAB’s interactive tools and command-line functions to develop various approximation tools to cater the research’s need. MATLAB is a program originally designed for solving linear algebra type problems using matrices. Today, it has become a useful tool for prototyping AI projects due to its large library functions, useful data visualization, focuses on high-level details and also allows quick prototype development of algorithms.
MATLAB offers a huge range of AI tools that also enables its users to integrate different techniques to achieve the simulation goal. It is a good tool for demonstration purposes, which is the main objective of this study. It is also a common tool used by researchers worldwide.
3.5 Approximation Tool
Based on literature review, as discussed in Chapter 2, intelligent system based models have proven to be more advantageous than any classical methods. The challenge in applying intelligent method in problem-solving is to determine the best possible method for the intended problem. Since demonstrating an organised monitoring system is the main objective of this thesis, analysis on the most suitable method with high dependability will be purely based on previous studies. Algorithm optimization will NOT be focused in this study. Hence, the literature review would underline the techniques that would be proposed for this research on various grounds, which would be discussed further.
To develop any approximation tool, a prior in-depth understanding on the tools is crucial. Hence, basic architectures of the proposed approximation tools will be further investigated to allow appropriate parameter adjustment to find the best fit. For model parameters selection, a systematic approach with regards to number of hidden layers,
25
number of nodes, epochs, network performance, desired activation functions, and training period has to be unambiguously formulated.
3.6 Research Design
Underlining a good research design is a primary need for successful research work.
This study concentrates in proposing a solution for the UTP’s distribution network, which is currently troubled with harmonics issues. Hence, an intelligent and reliable system needs to be implemented in UTP distribution system to reduce on the maintenance cost.
The main cause of increasing maintenance cost with the electrical system maintenance in UTP is due to lack of proper surveillance on the harmonics at the distribution line.
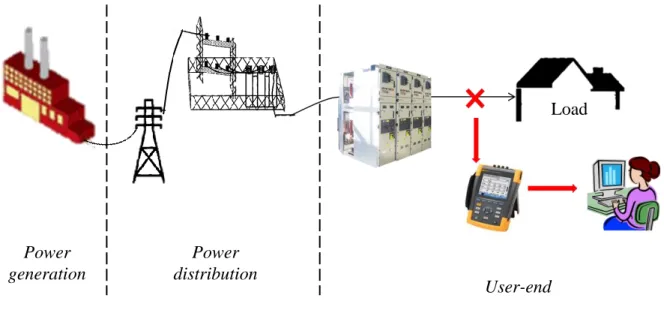
Maintaining a good power quality would eliminate unwanted costs due to damages caused by poor surveillance. This also reduces probability of damages of private and laboratory equipment due to poor power quality. Figure 3.2 suggests the overlook on the proposed monitoring system.
Figure 3.3 Complete overlook on the proposed intelligent system for UTP distribution network
Power generation
Power distribution
Load
User-end
26
This section brings into detail on the development of the proposed Virtual Harmonic Analyser and Forecaster (V-HAF) system. A dual-function system is expected to reduce instrument cost, which will be discussed further in Chapter 4’s comparative analyses. The research proposes an offline system that enables monitoring of fluctuations in recent and future harmonic readings using intelligent techniques.
3.6.1 Data Collection
This section provides a thorough insight on the data collection and interpretation, which is used to directly train and develop the approximation tools. To ensure data gathered for the research is valid, verifications were done prior to training algorithms.
3.6.1.1 Meter Placement
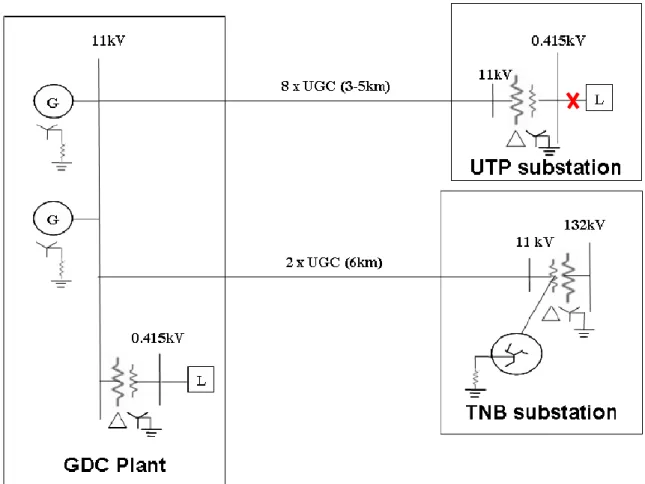
The study focuses on the user-end of the distribution line, in which several harmonic issues had been encountered. Figure 3.2 shows a simple illustration of the UTP distribution network. It consists of two gas turbine generators located at the GDC plant that generates 11 kV and distributes along the 3-5 km distribution line before stepped down to 415 V, which supplies the offices, academic buildings and residential villages.
The bold ‘X’ as marked in the Figure 3.2 and 3.3 shows the location targeted to gather necessary data for proposed system training and development. Figure 3.3 is a single-line diagram of UTP distribution network, which shows a more detailed diagram of data logging location for the targeted distribution network. The primary location identified through student survey and repeated harmonics issue were recorded at student residential village 3, located in the centre of the students’ accommodation area. It accommodates approximately 1200 students. Hence, the data logger was fitted at SSB V31 switchboard to record voltage, current, and harmonics behaviour in this particular student residential village. The sub-station distributes 240 V, 800/5A current at load-end.
27 3.6.1.2 Data Logger Tool
Raw data are gathered using Fluke 1750 Power Analyzer, which allows data logging for an intended period. The equipment measures voltages at each phase, and 5-Amp
current clamps used to gather phase currents from current transformer (CT).
Figure 3.4 GDC-UTP embedded distribution network
The algorithm is trained and tested using data from phase A (red); phase B, phase C and neutral line estimation can be done using a similar algorithm with sufficient training.
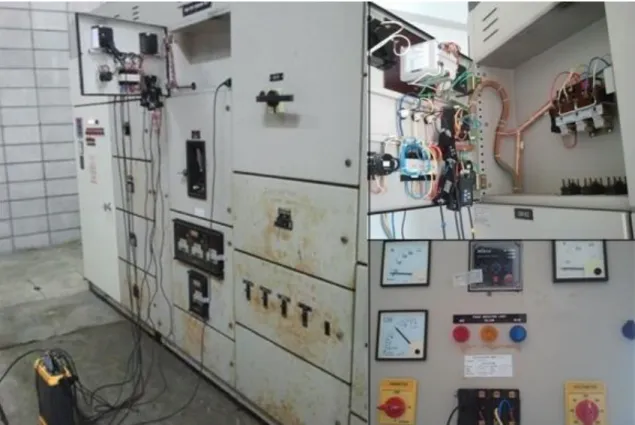
Figure 3.4 show the instrument on-site, while logging data. The instrument was attached at each location’s switchboard for 10-days.
28
The clarity of data recorded is assured by a hand-held digital clamp meter that enables instantaneous voltage and current readings. A comparison is made between measures shown on both meters before data logging are initiated.
Figure 3.5 Fluke 1750 power analyser logging data at SSB V31
3.6.1.3 Analysis of Data / Data Interpretation
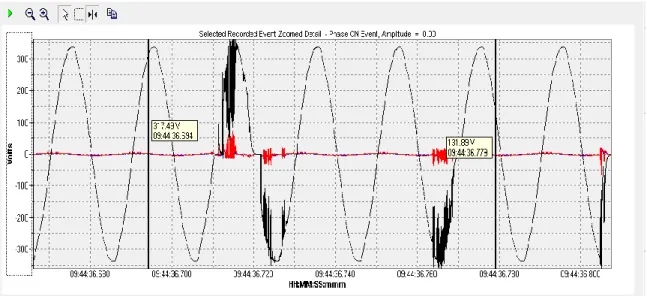
Based on logged data at student residential village in UTP, the existence on harmonics can be seen from the event on the logged voltage plot. The surges on various random locations on the voltage waveform plot at Figure 3.5 prove the presence of disturbance in the line and calls for immediate attention to overcome the issue.
29
Let; fundamental frequency is 50Hz, harmonics data (multiples of the fundamental frequency) are recorded from the first-order, which is the fundamental order, up to 50th harmonics order. For instance, the third order harmonics is measured as;
3rd-order harmonics = Fundamental harmonics (50 Hz) x 3 = 150 Hz (3.1)
Figure 3.6 Voltage waveform recorded from Fluke Power Analyser at student residential village in UTP
The data shows significant decrease of harmonic voltages as the order increases.
Table 3.1 shows the maximum recorded harmonic voltages in percentage of fundamental harmonic voltage from data logging site. It only shows till the 15th-order of harmonics since the following orders does not show significant harmonic voltages recorded and, therefore, can be ignored for this case.
Table 3.1 tabulates maximum harmonics voltage (Vh(max)) in percentage of the fundamental harmonic voltages. The first order shows almost 100% measurement as first order of harmonics records voltages at 50 Hz, which is the fundamental measure. The following harmonic orders show percentage of harmonic distortions. Based on gathered data, seventh-order harmonic records the highest distortion. Therefore, the proposed system is tailored to estimate and predict the seventh-order harmonic voltages (Vh7). It is important to identify the distorted harmonic orders, since the system proposed could only
30
Table 3.1 Percentage of fundamental harmonics voltage in Phase A Harmonics order Vh(max) [%]
1 102.60
2 0.86
3 0.95
4 0.50
5 1.41
6 0.39
7 2.42
8 0.42
9 0.85
10 0.39
11 1.21
12 0.30
13 1.02
14 0.30
15 0.46
31
content a single order estimation and prediction. Similar systems need to be developed and trained in respective of different harmonic orders.
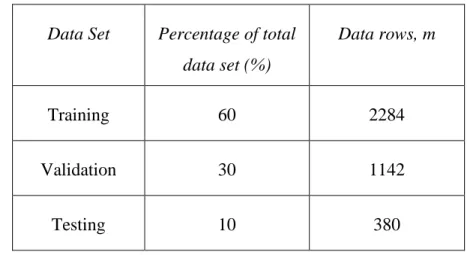
3.6.1.4 Data Segregation for Training, Validation, and Testing
Data were taken in percentage of fundamental harmonics. Sampling period of 3 seconds executes 3806 rows of data between 1.48 pm to 5.00 pm of the same day. This data is then divided into three sets; training data set, validation data set, and test data set.
A ratio of 60:30:10 was proposed or in another word, 60% of data set for training, 30%
for validation and 10% for test data set. Table 3.2 simplifies the mentioned data segregation according to logged data set;
Table 3.2 Data segregation for training, validation, and testing based on logged data Data Set Percentage of total
data set (%)
Data rows, m
Training 60 2284
Validation 30 1142
Testing 10 380
In terms of MATLAB coding, the above data segregation are done as per MATLAB coding below. For estimation network;
% TRAINING DATA
pC = data(1:2283,1:2);
t = data(1:2283,4);
% VALIDATION DATA
pCV = data(2284:3425,1:2);
32 tV = data(2284:3425,4);
% TEST DATA
pCT = data(3426:3806,1:2);
tT = data(3426:3806,4);
where ‘pC’, ‘pCV’, and ‘pCT’ indicates input data for training, validation and testing respectively, whereas ‘t’, ‘tV’, and ‘tT’ refers to the targeted measures. For time-series prediction models, data segregation were done to fit accordingly;
% TRAINING DATA p = data(1:1141,4);
t = data(1142:2282,4);
% VALIDATION DATA
pV = data(2283:2854,4);
tV = data(2855:3426,4);
% TEST DATA
pT = data(3427:3616,4);
tT = data(3617:3806,4);
where ‘p’, ‘pV’, and ‘pT’ indicates input data for training, validation and testing respectively, whereas ‘t’, ‘tV’, and ‘tT’ refers to the targeted measures. The ‘data’
referred in both set of MATLAB codes calls the collected measures from instrument logging, which is then saved in MATLAB work folder as ‘data.xls’.
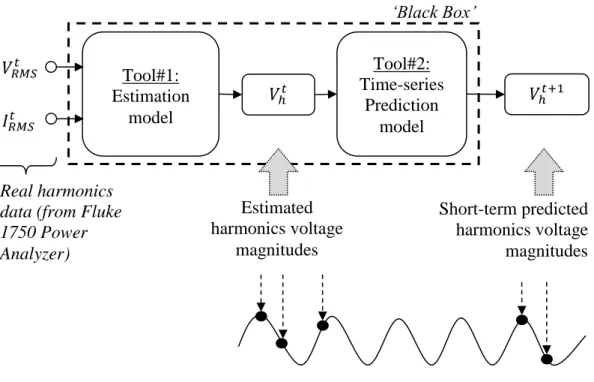
3.6.2 Proposed System: Virtual Harmonic Analyser and Forecaster (V-HAF)
The main objective of this thesis is to demonstrate harmonics estimation based on RMS voltage and RMS current of the measurement point, and forecasting harmonics data for the next 24-hours. Therefore, two separate networks are proposed to execute the tasks individually. These networks form a system or ‘black box’.
33
While conventional techniques generally suggests data logging of preceding data, prior to forecasting, the proposed V-HAF system enables forecast of harmonics voltages using preceding fundamental measures. The main advantage of the proposed system is that it does not require the usage of a more expensive tool such as harmonic power analyser, but allows fundamental data logger to provide sufficient inputs. This indirectly reduces cost of instrument. This is further justified at the end of Chapter 4. The fundamental data gathered from instrument are then processed as in Figure 3.6.
Figure 3.7 The overall proposed system which compromises estimation and time- series prediction models in a ‘black box’
‘Black Box’
Real harmonics data (from Fluke 1750 Power Analyzer)
𝑉ℎ𝑡+1 𝑉ℎ𝑡
Tool#2:
Time-series Prediction
model Tool#1:
Estimation model
Estimated harmonics voltage
magnitudes
Short-term predicted harmonics voltage magnitudes 𝑉𝑅𝑀𝑆𝑡
𝐼𝑅𝑀𝑆𝑡
34
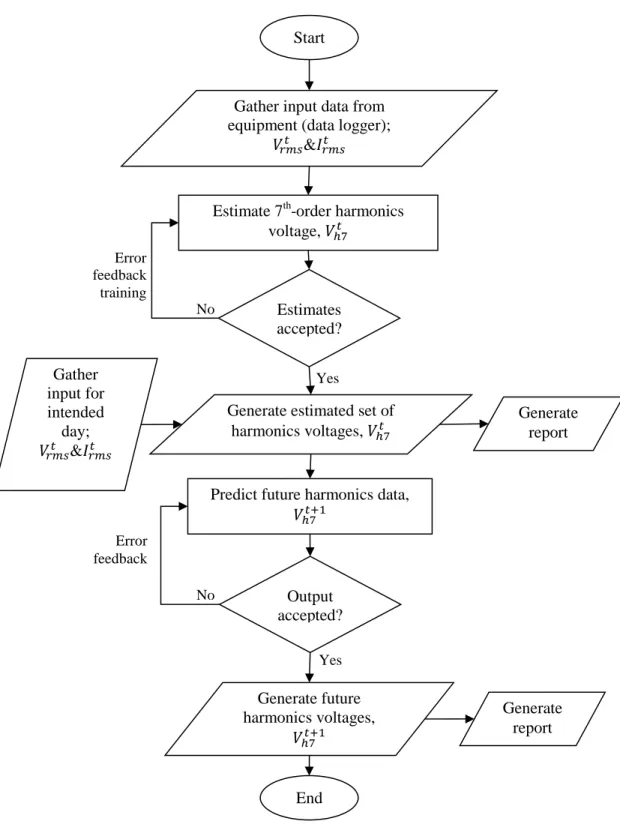
Figure 3.8 Proposed ‘Black Box’ systems operating flow-chart
Yes No
Yes No
Predict future harmonics data, 𝑉ℎ7𝑡+1
Estimate 7th-order harmonics voltage, 𝑉ℎ7𝑡
Estimates accepted?
Start
Gather input data from equipment (data logger);
𝑉𝑟𝑚𝑠𝑡 &𝐼𝑟𝑚𝑠𝑡
Error feedback training
Output accepted?
Error feedback
Generate estimated set of
harmonics voltages, 𝑉ℎ7𝑡 Generate report Gather
input for intended
day;
𝑉𝑟𝑚𝑠𝑡 &𝐼𝑟𝑚𝑠𝑡
Generate future harmonics voltages,
𝑉ℎ7𝑡+1
Generate report
End
35
Figure 3.6 shows the overall proposed system that feeds RMS voltage and RMS current from location and able to produce harmonics estimation for the same time period and predicts harmonics voltages for the next 24-hours. The ‘Black Box’ takes V-rms and I-rms recorded at targeted location and provides current and future harmonic voltages to cater the need of UTP’s distribution network for a reliable harmonic monitoring system.
The first tool serves as an estimation model and second tool as short-term time series prediction model. The flow chart in Figure 3.7 below provides a better understanding on the system flow.
Both networks are neatly written in MATLAB M-file using build-in functions from MATLAB library and will be further discussed along with basic knowledge acquisition on the techniques proposed.
3.6.3 Feed-forward Neural Network for Harmonics Estimation
In harmonics studies, NN is one of the earliest tested AI techniques [78], and is still used in recent researches due to its adaptive nature and high approximation accuracy. Its recursive nature makes it possible to be used in real-time measurements. Figure 3.8 provides an insight on the network architecture for harmonics pseudo-measurement estimation at UTP distribution network using feed-forward neural network.
To begin with, parameter selection is done by multiple simulations using different sets of inputs to identify the best performing network. Once the appropriate inputs are identified, they would be fed into the harmonic pseudo-measurement estimation tool, in this case, neural networks. The network developed for this estimation purpose is a feed- forward neural network with back-propagation learning algorithm. Real harmonics data logged using the power analyser instrument will be utilized as the benchmark for the network training and error calculation. In general, network development of the estimation model will strictly abide to the following process flow-chart.
36
Figure 3.9 Overall process of harmonic pseudo-measurement estimation.
As illustrated in the flow chart in Figure 3.9, network inputs and targets are set; m-by- n matrix, where m is number of data rows and n is number of inputs/target. Once inputs determined, neural network parameters are set and designed to suit the problem and weights are trained to optimize the estimation using back-propagation training method.
3.6.3.1 Fundamentals of Feed-forward Neural Network
ANN is a concept adapted from the human brain system. In a human body, signals or
‘tasks’ are being carried by neurons. A typical neuron collects these signals through a host called dendrites, which then travels (spikes of electrical activity) along axon. Once the signal reaches its desired destiny, synapse converts it into electrical effect and induces reactions. Learning occurs when a neuron receives larger excitatory input than its inhibitory input and forces the neuron to change its effectiveness of the synapses [21].
Based on this knowledge acquisition from simple logical operations, ANN-based models in different fields were discovered.
ANN is a part and parcel of intelligent based system to distinctively improve the conventional computing techniques. The evolution of harmonics analysis techniques from conventional methods to ANN-based solutions clearly proves the statement above.
Selected Inputs
Estimated Output
-
e 𝑉7ℎ𝑡 Input
parameter selection V
I P Q
Real harmonics data (from Fluke 1750)
𝑉7ℎ𝑡
Data collected from Fluke 1750 logger
Inputs
Tool#1:
Estimation model
37
Figure 3.10 Proposed system flow-chart for estimation model
Yes
No Adjust network parameters
Train network
Yes
No Stopping
criteria met?
Get final weights
Validate network
Error acceptable?
Determine inputs (p) & targets (t)
Develop stand- alone pseudo-
measurement estimation network
Start
End Feed inputs
from ‘Testing data set’
Generate harmonics
voltage estimates
38
Similar to the neuron behaviour in a human body, ANN consists of neurons, while signals are passed through weighted links [52]. Figure 3.10 shows a graphical illustration of a typical architecture of a feed-forward ANN, which is proposed in this study.
Figure 3.11 A typical architecture of a feed-forward neural network.
Three layers are seen in the ANN architecture as shown above; input layer (i), hidden layer (j), and output layer (h). Multilayer neural network is selected in this study due to the non-linearity behaviour of the observed system.
INPUT LAYER: Input layers neurons represent the data fed into the network, inputs of hidden layer neurons defined by the sum of weighted inputs, while weighted sum of outputs of the hidden layer neurons decides on the network output. This type of network is more often referred to as feed-forward network. An important application of the feed- forward neural network is pattern recognition; extracting and detecting trends that are too complex for classical computation or even for human observation. As discussed, the training data set contains 2,284 data samples or data rows, m.
Network inputs are determined by trial-and-error method where several combinations of input parameters were fed and tested for minimum error at simulation (estimation as close as possible to real data). Input set tested were;
a) Set A: RMS voltages ONLY
Hidden layer, j
Xn X2 X1
Σ Σ Wij
Wjk
Input layer, i Output layer, h
Σ
Σ
Y
39 b) Set B: RMS currents ONLY
c) Set C: RMS voltages and RMS currents (TWO parallel inputs)
The most advantageous set of inputs are determined by calculating the lowest mean square error with cross-validation technique. Cross-validation technique will be discussed further as this thesis writing progresses.
HIDDEN LAYER: The most important criteria to be determined in this layer is the number of neurons. For this, trial-and-error based technique is proposed. Another important parameter in a neural network structure is determining the activation functions.
For the hidden layer, activation function chosen should introduce nonlinearity into the network. Considering the neural network is trained by back-propagation, the most advantageous activation function is a sigmoid function. Sigmoid function is easy to differentiate, which reduces computation burden [88].
Activation functions are employed to decide if the neuron either fires or does not fire.
B. Karlik [89], in his paper, performed analysis of various activation functions in generalized multilayer perceptron (MLP) architectures of ANN. In an experimental comparison made between Bi-polar sigmoid, Uni-polar sigmoid, Tanh, Conic Section, and RBF; Tanh (hyperbolic tangent) function performs better recognition accuracy with an error of 0.002 that is 99% accuracy with 40 neurons at hidden layer. Therefore, this study suggests a combination of “Tanh-Tanh” activation functions for both neurons of hidden layer and output layer for good results. However, the real accuracy of these activation functions can differ with different applications and conditions in which the ANN is composed to cater. The following MATLAB plot in Figure 3.11 is a graphic of the hyperbolic tangent function for real values of its argument x over the domain -5 ≤ x
≤ 5.
For this purpose, the network is tested with two different sigmoid functions;
hyperbolic tangent sigmoid transfer function (‘tansig’) and logarithmic sigmoid transfer function (‘logsig’). Hyperbolic tangent sigmoid transfer function returns squashed elements between -1 and 1, while the latter transfer function returns squashed elements between 0 and 1. For output layer, where targets (harmonics voltage
40
magnitudes) are positive values and have no known upper bound, a pure linear function is sufficient.
In this study, network weights initialization is made random, while activation functions are pre-determined, as mentioned above.
Figure 3.12 Hyperbolic Tangent Function
OUTPUTLAYER: The outputs solely depend on the firing ability of the network;
firing rule determines how one calculates whether a neuron should fire for any input pattern. On the other hand, to provide a good firing ability, the hidden layers are equipped with computational neurons which detect the neuron weights and adjust it at each iteration to find the best fit at output.
Mathematically, general ANN output can be simply written as;
∑ 1 (3.1)
where isn number of inputs, W is weight matrix, b is the bias value, often 1, and is the activation function [21]. The desired output is harmonic voltage measures that are as close as possible to the actual data gathered from the power analyser equipment; with m- by-1 matrix.
41
The evolved models need to be trained to accomplish realistic targets. Thus, the selection of training algorithm and parameters needs to be explicitly understood.
Generally, ANN can be categorized to supervised and unsupervised learning network.
Supervised training uses external teacher, while paradigms of unsupervised learning are Hebbian learning and competitive learning; in which learning is based on only local information [87]. The following network development issues or points need to be clearly understood to enable good training command: learning rate, momentum factor, local and global minima of the network.
Hence, in forward pass, the outputs and the errors at the outputs are calculated.
Whereas in backward pass, the output and hidden unit errors are used to alter the weights on the output and hidden units respectively. In short, the estimation accuracy is based on the efficiency of training; error feedback and weight adjustments.
3.6.3.2 Back-propagation Training and Control Parameters
Back-propagation technique, or also called as error feedback training technique, can be simply described as illustrated in Figure 3.12. The block diagram in Figure 3.10 shows approximation outputs obtained from a feed forward network are compared to the set of targeted values. The difference or error obtained would be feed back to the training algorithm and this process is repeated till training goal reached. The goal of back- propagation algorithm is to find a new set of weights and biases that generate outputs closer to the actual target values. The process of finding the best weights are often referred to as ‘training’. As long as training goal has not been reached, back-propagation training continues.
![Figure 3.2 A typical Gas District Cooling System Schematic for the Kuala Lumpur International Airport Plant [84]](https://thumb-ap.123doks.com/thumbv2/azpdforg/11102231.0/23.918.173.801.453.849/figure-typical-district-cooling-schematic-lumpur-international-airport.webp)