CHAPTER 4 FINDINGS
4.1 Introduction
This chapter reports the findings and results obtained from the research conducted. They are presented based on the six research questions developed for this study to examine how students' academic motivation is influenced by tobacco use by peers in Pasir Mas, Kelantan. This chapter is divided into three main parts.
In the first part, the researcher presents information on the respondents' demographic backgrounds in this research. The second part deals with reports of the descriptive analysis of the two main variables: the influences of peers on tobacco use and academic motivation among students. The third part reports on the inferential analysis that will answer the research objective and hypothesis.
Lastly, this chapter describes the summary of the study.
4.2 Reliability Test
Reliability concerns the extent to which a measurement of a phenomenon provides stability and consist of result (Carmines et al., 1979). Reliability is also concerned with repeatability. Testing for reliability is essential as it refers to the consistency across the parts of a measuring instrument (Huck, 2007). A scale is said to have high internal consistency reliability if the scale's items "hang together" and measure the same construct (Huck, 2007, Robinson, 2009).
A reliability test is done to ensure that each survey question used can be trusted and understood by the respondents to answer it. The most used internal consistency measure is the Cronbach Alpha coefficient. It is viewed as the most appropriate measure of reliability when using Likert scales (Whitley, 2002, Robinson, 2009). The results of the reliability test are as in Table 4.1.
Table 4.1: Reliability Test for All Variables
Variable Construct Cronbach’s
Alpha
N of Items
Influences of Peers on Tobacco
Communication Trust Isolation
0.718 23
Academic Motivation
Intrinsic motivation
Extrinsic motivation
0.916 59
Based on Table 4.1 above, the reliability test results show that all the variables of influences of peers on tobacco consist of communication, trust, and isolation (0.718). Meanwhile, academic motivation consists of intrinsic and extrinsic motivation (0.916), all having the highest value of Cronbach's Alpha which is above the value of 0.7 that is acceptable. No absolute rules exist for internal consistencies. However, most agree on a minimum internal consistency coefficient of .70 (Whitley, 2002, Robinson, 2009). To assess the instrument's
reliability, Table 4.2 serves as a guide (Carmines et al., 1979). Thus, all the variables in this research were reliable to be used for further analysis.
Table 4.2: Cronbach’s Alpha Level of Reliability
Cronbach’s Alpha Internal Consistency
α ≥ 0.9 Excellent
0.9 > α ≥ 0.8 Good
0.8 > α ≥ 0.7 Acceptable
0.7 > α ≥ 0.6 Questionable
0.6 > α ≥ 0.5 Poor
0.5 > α Unacceptable
4.3 Demographics of Respondents
This study focuses on lower secondary school students in Pasir Mas, Kelantan, and 392 respondents have been involved. Demographic data such as gender and an estimate of the parent's monthly income are presented in Table 4.3 form using descriptive statistics.
Table 4.3: Profile of the Respondents
Profile N %
Gender
Male 188 48
Female 204 52
Estimate of the parent’s monthly income
Below RM1, 000 220 56.1
RM1,001 – RM3, 000 133 33.9
RM3, 001-RM5, 000 26 6.6
RM5, 001-RM7,000 7 1.8
RM7,001 and above 6 1.5
N= 392
The respondents' profile-based gender shows 188 respondents, or 48%
were male, while 204 or 52%, were female. Therefore, the difference in percentage-based gender is 4%. This shows that this study has more female respondents than male respondents.
The information in the profile of estimate of the parents' monthly income shows that a total of 392 respondents were involved in this study, 220 respondents or 56.1% coming from parents' monthly income of less than RM1 000, 133 respondents or 33.9 % have monthly income RM1, 000-RM3, 000 and 26 respondents or 6.6% have monthly income RM3, 001-RM5, 000. Meanwhile, 7 respondents or 1.8% have a monthly income of about RM5, 001-RM7, 000 and 6 respondents or 1.5 % come from parents' income of RM7 000 and above.
4.4 Normality Analysis
The data distribution was examined earlier to verify the applicability of correlation tests. It seeks to guarantee that data is distributed normally. The researcher used the SPSS procedure to determine the relative frequency distribution of instructions based on the Kolmogorov-Smirnov test statistic. The following tests for normality have been performed.
Table 4.4: The result of Kolmogorov-Smirnov
Variables N Mean Standard Deviation Sig.
Influences of Peers on Tobacco Use
392 4.3138 0.47231 0.079
Academic Motivation
392 4.5700 0.68675 0.058
Table 4.4 shows the normality test using the One-Sample Kolmogorov- Smirnov method with a significant exact value (2-tailed) of 0.079 for Influence of Peers on Tobacco Use and 0.058 for Academic Motivation. The total sample for this study was 392 respondents. The method used to test for normality is the Kolmogorov-Smirnov test for samples > 50. The test criteria are if the (sig.
Value> 0.05) data is usually distributed and if the (sig. Value <0.05) data is not normally distributed. The test results are shown above that the data of this study are typically distributed.
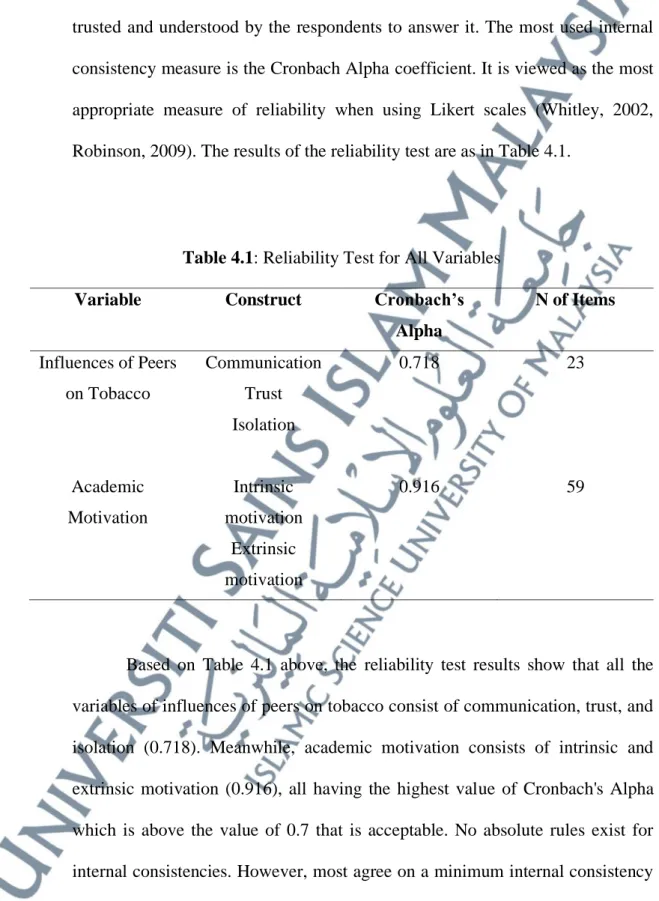
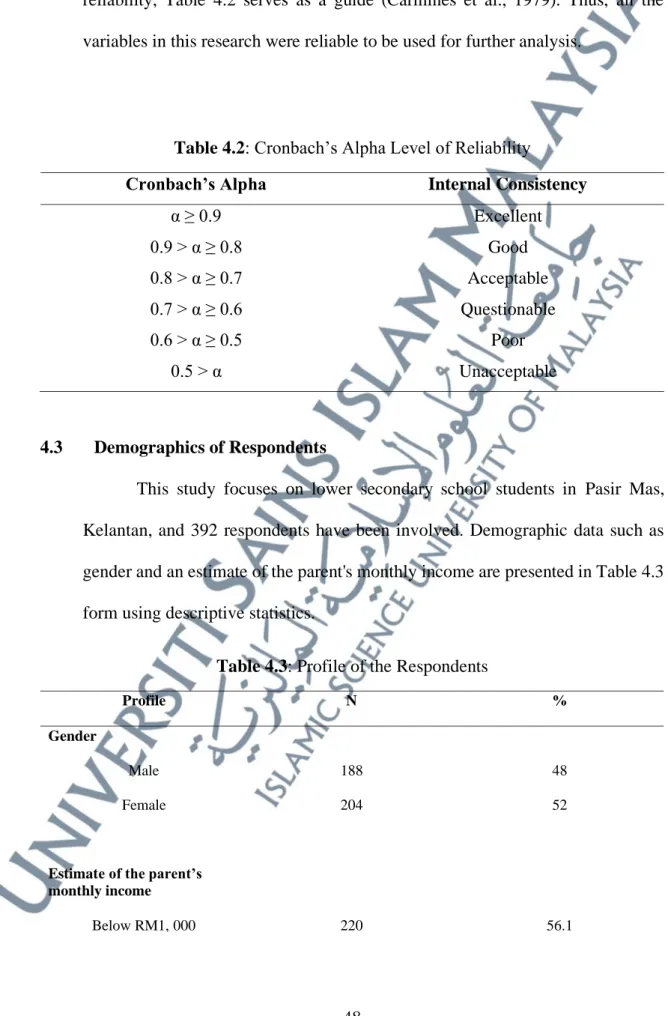
In statistics, a Q–Q plot is a scatterplot created by plotting two sets of quantiles (observed and expected) against one another. For normally distributed data, observed data are approximate to the expected data; that is, they are statistically equal.
Figure 4.1: Normal Q-Q Plot of Influence of Peers on Tobacco Use
Figure 4.2: Normal Q-Q Plot of Academic Motivation
The Q-Q Plot of Influence of Peers on Tobacco Use and Academic Motivation is shown in Figures 4.1 and 4.2 above. Data collection is said to have a normal distribution when dispersed around a line. The result shows that the data for both scales are scattered over the lines. However, just one data point for the Influence of Peers on Tobacco Use is out of line. The data distribution is most likely normal. Because of the normality test findings, the data distribution for both instruments in this research is expected. It has approved the use of coefficient correlation and regression techniques to examine the relationship and significance of these two variables. For continuous data, testing of normality is critical because based on the normality status, measures of central tendency, dispersion, and selection of parametric/ nonparametric tests are decided. According to the normality test findings, the data distribution for both instruments in this research is regular and parametric testing can proceed.
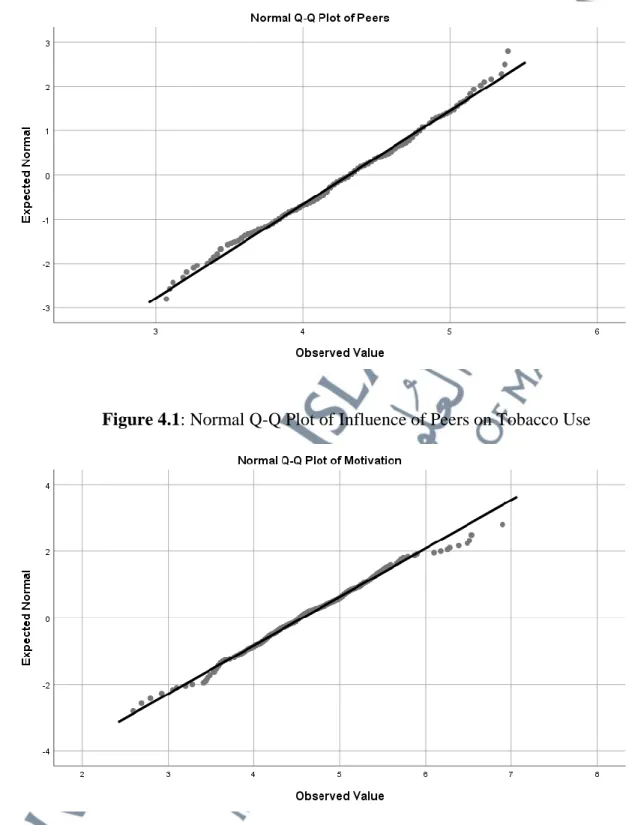
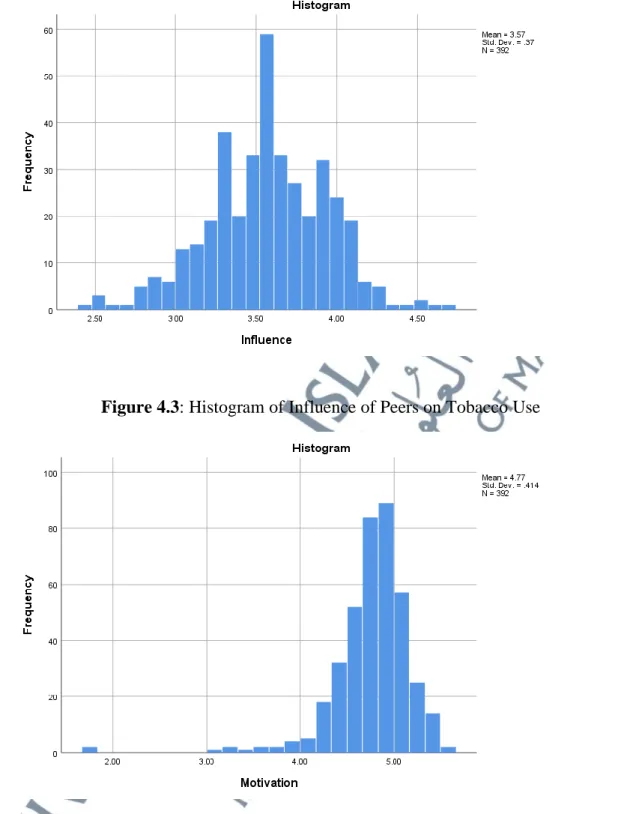
For sample size >300, the data's normality depends on the histograms and the absolute values of skewness and kurtosis. A histogram is an estimate of the probability distribution of a continuous variable. If the graph is approximately bell-shaped and symmetric about the mean refer to Figures 4.3 and 4.4, we can assume normally distributed data (Armitage et al., 2008; Barton et al., 2014)
Figure 4.3: Histogram of Influence of Peers on Tobacco Use
Figure 4.4: Histogram of Academic Motivation
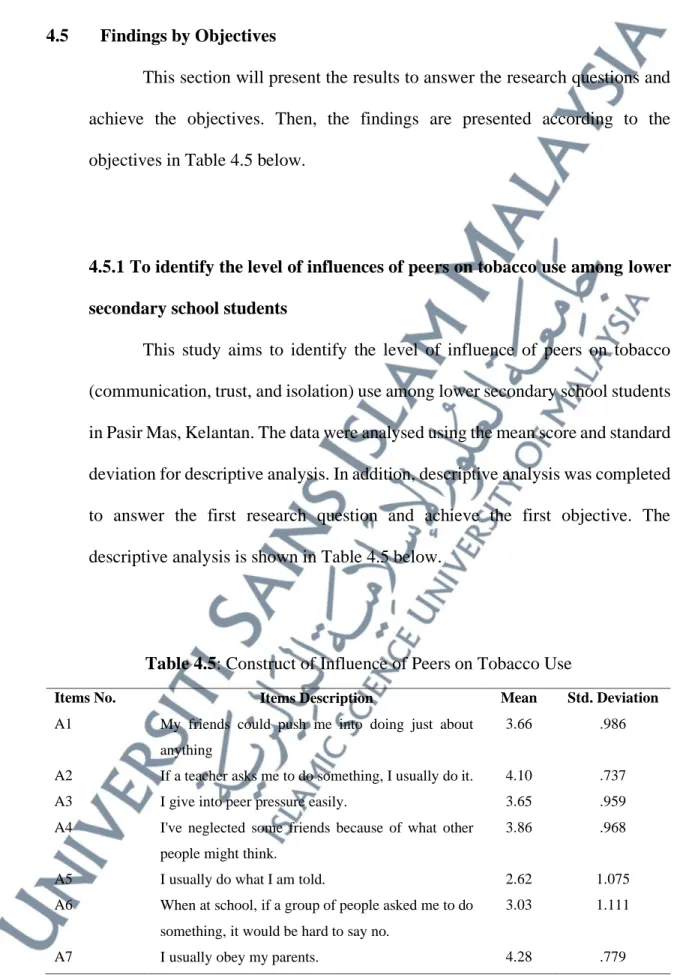
4.5 Findings by Objectives
This section will present the results to answer the research questions and achieve the objectives. Then, the findings are presented according to the objectives in Table 4.5 below.
4.5.1 To identify the level of influences of peers on tobacco use among lower secondary school students
This study aims to identify the level of influence of peers on tobacco (communication, trust, and isolation) use among lower secondary school students in Pasir Mas, Kelantan. The data were analysed using the mean score and standard deviation for descriptive analysis. In addition, descriptive analysis was completed to answer the first research question and achieve the first objective. The descriptive analysis is shown in Table 4.5 below.
Table 4.5: Construct of Influence of Peers on Tobacco Use
Items No. Items Description Mean Std. Deviation
A1 My friends could push me into doing just about anything
3.66 .986
A2 If a teacher asks me to do something, I usually do it. 4.10 .737
A3 I give into peer pressure easily. 3.65 .959
A4 I've neglected some friends because of what other people might think.
3.86 .968
A5 I usually do what I am told. 2.62 1.075
A6 When at school, if a group of people asked me to do something, it would be hard to say no.
3.03 1.111
A7 I usually obey my parents. 4.28 .779
A8 At times, I’ve broken rules because others have urged me to.
3.81 .992
A9 I’d do almost anything to avoid being seen as a
‘loser’.
3.24 1.065
A10 I follow my parents’ wishes even when it means not doing something I want to do.
2.48 1.036
A11 At times, I’ve done dangerous or foolish things because others dared me to.
3.81 1.092
A12 Even when I disagree with my parents’ wishes, I usually do what I am told.
2.17 .945
A133 I often feel pressured to do things I wouldn’t normally do.
3.00 1.130
A14 I break rules frequently. 3.86 .968
A15 If my friends are smoking, it would be hard for me to resist having a cigarette.
4.13 1.170
A16 I’ve bought things because they were the “in” things to have.
3.67 1.029
A17 I rarely follow the rules. 3.72 1.013
A18 I’ve skipped classes when others have urged me to. 4.24 .862 A19 I’ve felt pressured to smoking because a lot of people
my own age has already smoke.
4.30 .988
A20 I’ve been friends with some people, just because others liked them.
3.74 1.025
A21 I’ve felt pressured to get smoking when hanging out with friends.
4.38 .870
A22 I’ve gone to hang out with friends, just to be part of the crowd.
3.45 1.098
A23 At times I’ve felt pressured to do smoking, because others have urged me too.
4.30 .938
Overall 3.6304 .38386
(Level: Low = 1.00 – 2.33, Moderate = 2.34 – 3.66, High = 3.67 – 5.00)
In this study, the level of influence of peers on tobacco use among lower secondary school students (communication, trust, and isolation) in Pasir Mas, Kelantan, was measured by 23 items. The overall findings show that the level is
moderate (mean = 3.6304, SD = 0.38386). Table 4.5 shows that 15 items have a high score, while eight have an average score. Items that have a high score are My friends could push me into doing just about anything (M=3.66, SD=0.986), If a teacher asks me to do something, I usually do it (M=4.10, SD=0.737), I've neglected some friends because of what other people might think (M=3.86, SD=0.968), I usually obey my parents (M=4.28, SD=0.779), At times, I've broken rules because others have urged me to (M=3.81, SD=0.992), At times, I've done dangerous or foolish things because others dared me to (M=3.81, SD=1.092), I break rules frequently (M=3.86, SD=0.968), If my friends are smoking, it would be hard for me to resist having a cigarette (M=4.13, SD=1.170), I've bought things because they were the "in" things to have (M=3.67, SD=1.029), I rarely follow the rules (M=3.72, SD=1.013), I've skipped classes when others have urged me to (M=4.24, SD=0.862), I've felt pressured to smoking because a lot of people my own age has already smoke (M=4.30, SD=.988), I've been friends with some people, just because others liked them (M=3.74, SD=1.025), I've felt pressured to get smoking when hanging out with friends (M=4.38, SD=0.870), and last item is at times I've felt pressured to do smoking because others have urged me too (M=4.30, SD=.938).
Whereas the moderate items found that I give into peer pressure quickly (M=3.65, SD=.959), I usually do what I am told (M=2.62, SD=1.075); when at school, if a group of people asked me to do something, it would be hard to say no (M=3.03, SD=1.111), I would do almost anything to avoid being seen as a 'loser' (M=3.24, SD=1.065), I follow my parents' wishes even when it means not doing
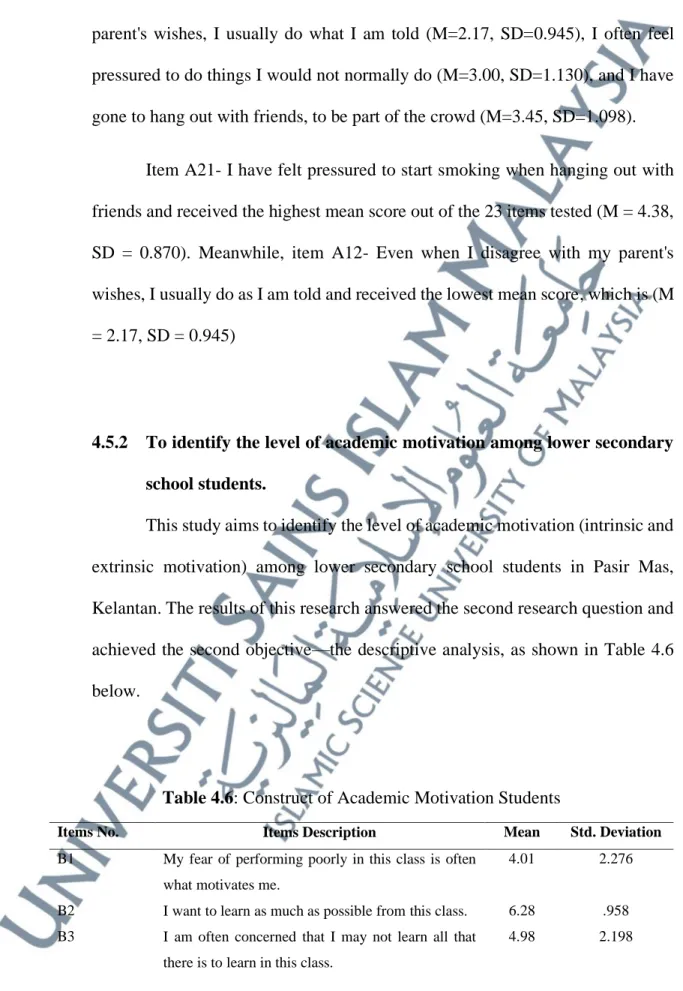
parent's wishes, I usually do what I am told (M=2.17, SD=0.945), I often feel pressured to do things I would not normally do (M=3.00, SD=1.130), and I have gone to hang out with friends, to be part of the crowd (M=3.45, SD=1.098).
Item A21- I have felt pressured to start smoking when hanging out with friends and received the highest mean score out of the 23 items tested (M = 4.38, SD = 0.870). Meanwhile, item A12- Even when I disagree with my parent's wishes, I usually do as I am told and received the lowest mean score, which is (M
= 2.17, SD = 0.945)
4.5.2 To identify the level of academic motivation among lower secondary school students.
This study aims to identify the level of academic motivation (intrinsic and extrinsic motivation) among lower secondary school students in Pasir Mas, Kelantan. The results of this research answered the second research question and achieved the second objective—the descriptive analysis, as shown in Table 4.6 below.
Table 4.6: Construct of Academic Motivation Students
Items No. Items Description Mean Std. Deviation
B1 My fear of performing poorly in this class is often what motivates me.
4.01 2.276
B2 I want to learn as much as possible from this class. 6.28 .958 B3 I am often concerned that I may not learn all that
there is to learn in this class.
4.98 2.198
B4 I would feel good if I were the only one who could answer the teacher’s question in class.
4.12 2.128
B5 It’s very important for me that I don’t look stupid in this class.
4.84 2.260
B6 I work hard to learn new things in this class. 5.84 1.211 B7 One of my main goals is to avoid looking like I can’t
do my work.
3.79 2.095
B8 I want to do better than the other students in this class.
4.59 2.309
B9 It is important for me to understand the content of each subject as thoroughly as possible.
5.78 1.316
B10 Sometimes I’m afraid that I may not understand the lesson content of this class as thoroughly as I’d like.
5.57 1.353
B11 My goal in this class is to avoid performing poorly. 4.56 2.281
B12 I do my school work to get better at it. 5.31 1.357
B13 I am anxious that I may not master all that is supposed to learn in this class.
5.41 1.437
B14 It is important for me to do better than other students. 5.72 1.346 B15 I worry that I may not learn all that I possibly could
in this class.
5.42 1.414
B16 It is important for me to do well compared to others in this class.
4.18 2.367
B17 I feel uneasy that I may not understand what is to learn in this class.
5.39 1.380
B18 I desire to completely master the material presented in this class.
5.74 1.240
B19 I just want to avoid doing poorly in this class. 5.26 1.497 B20 My goal in this class is to get a better grade than most
of the other students.
5.20 2.193
C1 I find that I must do enough work on a topic so that I can form my own conclusions before I am satisfied.
5.60 1.370
C2 I find that at times studying gives me a feeling of deep personal satisfaction.
5.00 1.399
C3 I generally restrict my study to what is specifically set as I think it is unnecessary to do anything extra.
3.41 1.856
C4 I do not find my learning process very interesting, so my motivation become to the minimum.
3.36 1.751
C5 I find most new topics interesting and often spend extra time trying to obtain more information about them.
4.84 1.322
C6 I find that studying academic topics in school can at times be as exciting as a good novel or movie.
5.12 1.295
C7 I only study seriously what’s given out in class or in the course outlines.
3.68 2.318
C8 I test myself on important topics until I understand them completely.
5.27 1.212
C9 I find I can get by in most examination by memorizing key sections rather than trying to understand them.
3.76 2.323
C10 I work hard at my studies because I find most subject is interesting.
5.42 1.205
C11 I believe that teachers shouldn’t expect students to spend significant amounts of time studying topic knows won’t be examined.
3.57 1.932
C12 I see no point in learning material which is not likely to be in the examination.
3.14 1.626
C13 I spend a lot of my free time finding out more about interesting topics which have been discussed in different classes.
3.41 2.170
C14 I feel that virtually any topic in subject can be highly interesting once I get into it.
5.27 1.180
C15 I find it is not helpful to study topics in depth. It confuses and wastes time when all I need is a passing acquaintance with topics.
3.42 1.621
C16 I find the best way to pass examinations is to try to remember answers to likely questions.
3.66 2.278
C17 I make a point of looking at most of the suggested readings that go with the learning process.
5.39 1.282
C18 I come to school with questions in mind that I want answering.
4.80 1.365
C19 I learn some things by rote, going over and over them until I remember them by heart even if I do not understand them.
3.85 2.266
C20 My aim is to pass all the subject while doing as little study as possible.
3.86 2.042
D1 I often feel bored in school. 3.53 1.542
D2 I’m certain I can master the skills taught in school this year.
5.03 1.308
D3 I like being in school. 5.43 1.366
D4 I read briefly to see the content of a subject before I read it thoroughly.
5.02 1.329
D5 I can do even the hardest schoolwork if I try. 4.89 1.357 D6 I am happier when I am at school than when I am not
at school.
4.84 1.527
D7 If I become confused about something I read, I go back to my previous notes and sort it out.
5.35 1.379
D8 I am often angry when I’m at school. 3.74 1.486
D9 If I have enough time, I can do a good job on all my schoolwork.
5.46 1.242
D10 I try to determine which concepts I don’t understand well.
5.04 1.297
D11 I often feel frustrated when I am doing schoolwork. 3.63 1.680 D12 I can do almost all the work in school if I don’t give
up.
5.37 1.349
D13 I try to determine the way I study according to the subject requirements and the teacher’s teaching style.
5.14 1.241
D14 Most of the time, being in school puts me in a good mood.
5.18 1.341
D15 Even if the learning process in school is hard, I can learn it.
5.36 1.223
D16 I set goals for myself to direct my study activities. 5.38 1.169 D17 I’m certain I can figure out how to do the most
difficult schoolwork.
4.97 1.410
D18 School often makes me feel sad. 3.86 1.287
D19 I ask myself questions to make sure I understand the material.
5.20 1.409
Overall 4.7495 .70067
In this part, the academic motivation among lower secondary school students (intrinsic and extrinsic motivation) in Pasir Mas, Kelantan, was measured by 59 items. The overall findings show that the level is high (mean = 4.7495, SD
= .70067). Table 4.6 shows that 51 items have a high score, while eight have an average score. Items that have a high score are My fear of performing poorly in this class is often what motivates me (M=4.01, SD=2.276), I am often concerned that I may not learn all that there is to learn in this class (M=4.98, SD=2.198), I would feel good if I were the only one who could answer the teacher’s question in class (M=4.12, SD=2.128), It’s very important for me that I don’t look stupid in this class (M=4.84, SD=2.260), I work hard to learn new things in this class (M=5.84, SD=1.211), One of my main goals is to avoid looking like I can’t do my work (M=3.79, SD=2.095), I want to do better than the other students in this class (M=4.59, SD=2.309), It is important for me to understand the content of
afraid that I may not understand the lesson content of this class as thoroughly as I’d like (M=5.57, SD=1.353), My goal in this class is to avoid performing poorly (M=4.56, SD=2.281), I do my school work to get better at it (M=5.31, SD=1.357), I am anxious that I may not master all that is supposed to learn in this class (M=5.41, SD=1.437), It is important for me to do better than other students (M=5.72, SD=1.346), I worry that I may not learn all that I possibly could in this class (M=5.42, SD=1.414), It is important for me to do well compared to others in this class (M=4.18, SD=2.367), I feel uneasy that I may not understand what is to learn in this class (M=5.39, SD=1.380), I desire to completely master the material presented in this class (M=5.74, SD=1.240), I just want to avoid doing poorly in this class (M=5.26, SD=1.497), My goal in this class is to get a better grade than most of the other students (M=5.20, SD=2.193), I find that I must do enough work on a topic so that I can form my own conclusions before I am satisfied (M=5.60, SD=1.370), I find that at times studying gives me a feeling of deep personal satisfaction (M=5.00, SD=1.399), I find most new topics interesting and often spend extra time trying to obtain more information about them (M=4.84, SD=1.322), I find that studying academic topics in school can at times be as exciting as a good novel or movie (M=5.12, SD=1.295), I only study seriously what’s given out in class or in the course outlines (M=3.68, SD=2.318), I test myself on important topics until I understand them completely (M=5.27, SD=1.212), I find I can get by in most examination by memorizing key sections rather than trying to understand them (M=3.76, SD=2.323), I work hard at my studies because I find most subject is interesting (M=5.42, SD=1.205), I feel that virtually any topic in subject can be highly interesting once I get into it (M=5.27,
SD=1.180), I find the best way to pass examinations is to try to remember answers to likely questions (M=3.66, SD=2.278), I make a point of looking at most of the suggested readings that go with the learning process (M=5.39, SD=1.282), I come to school with questions in mind that I want answering (M=4.80, SD=1.365), I learn some things by rote, going over and over them until I remember them by heart even if I do not understand them (M=3.86, SD=2.042), My aim is to pass all the subject while doing as little study as possible (M=5.03, SD=1.308), I’m certain I can master the skills taught in school this year (M=5.03, SD=1.308), I like being in school (M=5.43, SD=1.366), I read briefly to see the content of a subject before I read it thoroughly (M=5.02, SD=1.329),CI can do even the hardest schoolwork if I try (M=4.89, SD=1.357), I am happier when I am at school than when I am not at school (M=4.84, SD=1.527), If I become confused about something I read, I go back to my previous notes and sort it out (M=5.35, SD=1.379), I am often angry when I’m at school (M=3.74, SD=1.486), If I have enough time, I can do a good job on all my schoolwork (M=5.46, SD=1.242), I try to determine which concepts I don’t understand well (M=5.04, SD=1.297), I can do almost all the work in school if I don’t give up (M=5.37, SD=1.349), I try to determine the way I study according to the subject requirements and the teacher’s teaching style (M=5.14, SD=1.241), Most of the time, being in school puts me in a good mood (M=5.18, SD=1.341), Even if the learning process in school is hard, I can learn it (M=5.36, SD=1.223), I set goals for myself to direct my study activities (M=5.38, SD=1.169), I’m certain I can figure out how to do the most difficult schoolwork (M=4.97, SD=1.410), School often makes me feel
sad (M=3.86, SD=1.287) and the last is I ask myself questions to make sure I understand the material (M=5.20, SD=1.409).
Whereas the moderate items found, I generally restrict my study to what is expressly set as I think it is unnecessary to do anything extra (M=3.41, SD=1.856); I do not find my learning process very interesting, so my motivation becomes to the minimum (M=3.36, SD=1.751), I believe that teachers should not expect students to spend significant amounts of time studying topic knows will not be examined (M=3.57, SD=1.932), I see no point in learning material which is not likely to be in the examination (M=3.14, SD=1.626), I spend a lot of my free time finding out more about exciting topics which have been discussed in different classes (M=3.41, SD=2.170), I find it is not helpful to study topics in depth. It confuses and wastes time when all I need is a passing acquaintance with topics (M=3.42, SD=1.621), I often feel bored in school (M=3.53, SD=1.542), and I often feel frustrated when I am doing schoolwork (M=3.63, SD=1.680).
Item B2 - I want to learn as much as possible from this class, which had the highest mean score out of the 59 items (M=6.28, SD=.958). Apart from that, item C12- I see no point in learning material which is not likely to be in the examination received the lowest mean score (M = 3.57, SD = 1.932)
4.6 Inferential Analysis
This section tests the hypotheses to answer the research questions that have been posted at an early stage. Accordingly, the analysis in hypothesis testing is done one by one based on the need to meet the purpose of the study. The
methods used were including t-test, one-way ANOVA, and Pearson Correlation Coefficient.
4.6.1 The mean differences in the influences of peers on tobacco use based on socioeconomic status among lower secondary students in Pasir Mas, Kelantan.
This section will present the results to answer the first hypotheses below.
H01 There is no significant difference in the influences of peers on tobacco use based on socioeconomic status among lower secondary school students in Pasir Mas, Kelantan.
Table 4.7: Mean Differences in The Influences of Peers on Tobacco Use Based on Socioeconomic Status Among Lower Secondary Students in Pasir Mas, Kelantan
Social Economic Status N Mean Standard Deviation
Below RM1, 000 220 3.6271 0.40386
RM1, 001-RM3, 000 133 3.6483 0.36244
RM3, 001-RM5, 000 26 3.6271 0.37767
RM5, 001-RM7, 000 7 3.5466 0.27823
RM7, 000 and above 6 3.4710 0.23561
Social and economic status in the range of RM1, 001-RM3, 000 (M=3.6483) has a greater influence of peers on tobacco use than other social and economic statuses such as those below RM1,000 (M=3.6271), RM3, 001-RM5, 000 (M=3.6271), RM5, 001-RM7, 000 (M=3.5466) including RM7, 000 and
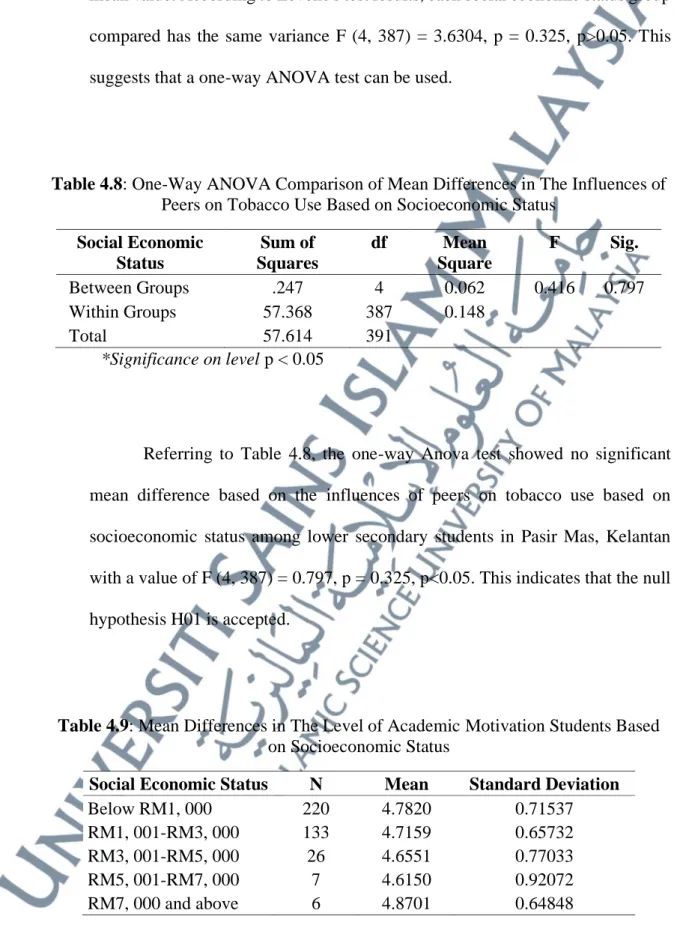
mean value. According to Levene's test results, each social economic status group compared has the same variance F (4, 387) = 3.6304, p = 0.325, p>0.05. This suggests that a one-way ANOVA test can be used.
Table 4.8: One-Way ANOVA Comparison of Mean Differences in The Influences of Peers on Tobacco Use Based on Socioeconomic Status
Social Economic Status
Sum of Squares
df Mean
Square
F Sig.
Between Groups .247 4 0.062 0.416 0.797
Within Groups 57.368 387 0.148
Total 57.614 391
*Significance on level p < 0.05
Referring to Table 4.8, the one-way Anova test showed no significant mean difference based on the influences of peers on tobacco use based on socioeconomic status among lower secondary students in Pasir Mas, Kelantan with a value of F (4, 387) = 0.797, p = 0.325, p<0.05. This indicates that the null hypothesis H01 is accepted.
Table 4.9: Mean Differences in The Level of Academic Motivation Students Based on Socioeconomic Status
Social Economic Status N Mean Standard Deviation
Below RM1, 000 220 4.7820 0.71537
RM1, 001-RM3, 000 133 4.7159 0.65732
RM3, 001-RM5, 000 26 4.6551 0.77033
RM5, 001-RM7, 000 7 4.6150 0.92072
RM7, 000 and above 6 4.8701 0.64848
Social and economic status in the range of RM7, 000 and above (M=4.8701) has a greater level of academic motivation among students than other social and economic statuses such as those below RM1,000 (M=4.7820), RM1, 001-RM3, 000 (M=4.7159), RM3, 001-RM5, 000 (M=4.6551), and RM5, 001- RM7, 000 (M=4.6150). A one-way ANOVA test revealed a significant difference in mean value. According to Levene's test results, each social economic status group compared has the same variance F (4, 387) = 4.7495, p = 0.369, p>0.05.
This suggests that a one-way ANOVA test can be used.
Table 4.10: One-Way ANOVA Comparison of Mean Differences in in The Level of Academic Motivation Students Based on Socioeconomic Status Among Lower
Secondary School Students Social Economic
Status
Sum of Squares
df Mean
Square
F Sig.
Between Groups 0.827 4 0.207 0.419 0.795
Within Groups 191.132 387 0.494
Total 191.959 391
*Significance on level p < 0.05
Referring to Table 4.10, the one-way Anova test showed no significant mean difference based on the influences of peers on tobacco use based on socioeconomic status among lower secondary students in Pasir Mas, Kelantan with a value of F (4, 387) = 0.419, p = 0.795, p<0.05. This indicates that the null hypothesis H01 is accepted.
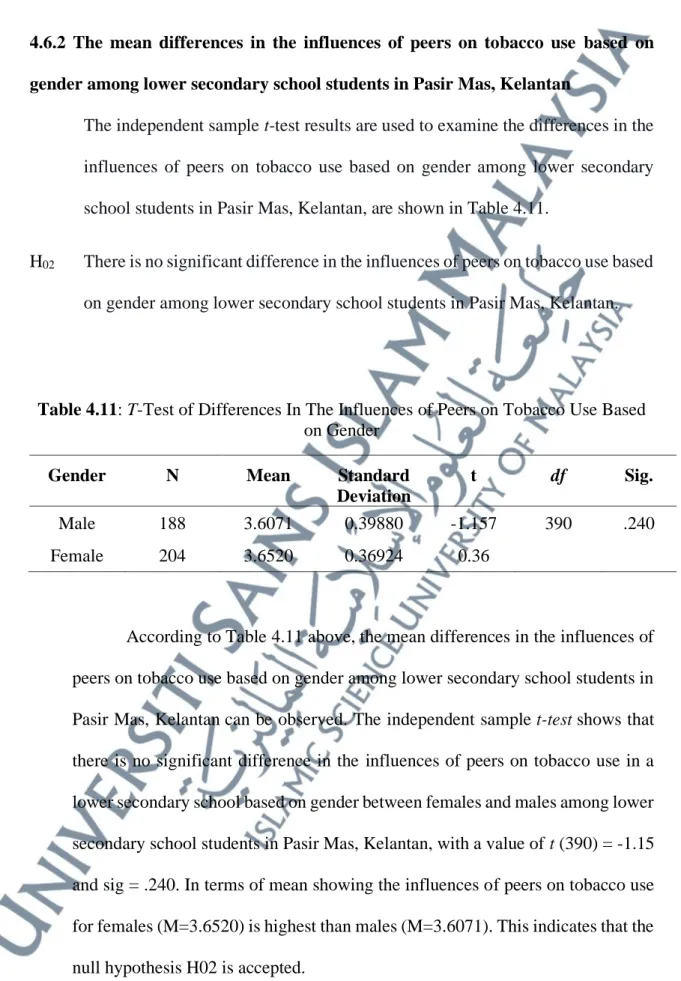
4.6.2 The mean differences in the influences of peers on tobacco use based on gender among lower secondary school students in Pasir Mas, Kelantan
The independent sample t-test results are used to examine the differences in the influences of peers on tobacco use based on gender among lower secondary school students in Pasir Mas, Kelantan, are shown in Table 4.11.
H02 There is no significant difference in the influences of peers on tobacco use based on gender among lower secondary school students in Pasir Mas, Kelantan.
Table 4.11: T-Test of Differences In The Influences of Peers on Tobacco Use Based on Gender
Gender N Mean Standard
Deviation
t df Sig.
Male 188 3.6071 0.39880 -1.157 390 .240
Female 204 3.6520 0.36924 0.36
According to Table 4.11 above, the mean differences in the influences of peers on tobacco use based on gender among lower secondary school students in Pasir Mas, Kelantan can be observed. The independent sample t-test shows that there is no significant difference in the influences of peers on tobacco use in a lower secondary school based on gender between females and males among lower secondary school students in Pasir Mas, Kelantan, with a value of t (390) = -1.15 and sig = .240. In terms of mean showing the influences of peers on tobacco use for females (M=3.6520) is highest than males (M=3.6071). This indicates that the null hypothesis H02 is accepted.
4.6.3 The mean differences in the level of academic motivation students based on gender among lower secondary school students in Pasir Mas, Kelantan.
The independent sample t-test results are used to examine the differences in the level of academic motivation students based on gender among lower secondary school students in Pasir Mas, Kelantan, are shown in Table 4.12.
H03 There is no significant difference in the level of academic motivation of students in a lower secondary school based on gender among lower secondary school students in Pasir Mas, Kelantan.
Table 4.12: T-Test of Differences In The Level of Academic Motivation Students Based On Gender
Gender N Mean Standard
Deviation
t df Sig.
Male 188 4.5696 0.72889 -5.030 390 0.000
Female 204 4.9153 0.63134
According to Table 4.12 above, the mean differences in students' academic motivation levels based on gender among lower secondary schools in Pasir Mas, Kelantan can be observed. The independent sample t-test shows a significant difference in students' academic motivation level based on gender between males and females in lower secondary school in Pasir Mas, Kelantan, with a value of t (390) = -5.030 and sig = 0.000. In terms of mean showing, the level of academic for female respondents (M=4.9153) is highest than for male
respondents (M=4.5696). Hence, this indicates that the null hypothesis H04 is rejected.
4.6.4 To determine the relationship between influences of peers on tobacco use and academic motivation among lower secondary school students in Pasir Mas, Kelantan.
H05 There is no significant relationship between the influences of peers on tobacco use and academic motivation among lower secondary school students in Pasir Mas, Kelantan.
Table 4.13: Correlations Coefficient Between Influences of Peers on Tobacco Use and Academic Motivation
Variables Influences of Peers on Tobacco Use
Interpretation
R Sig.
Academic Motivation 0.057 0.259 Very weak
A Pearson's r correlation coefficient was computed to assess the relationship between influences of peers on tobacco use and academic motivation among lower secondary school students in Pasir Mas, Kelantan. Table 4.13 shows no significant relationship between peer influences on tobacco use and academic motivation among lower secondary school students in Pasir Mas, Kelantan, with r=0.057 and sig. 0.259 (p>0.05). The positive relationship is fragile, implying that
the greater the influence of peers on tobacco, the greater the academic motivation among lower secondary school students. H05 is now acceptable.
4.7 Summary
Chapter four presented the results of the descriptive analyses, including independent sample t-test, one-way ANOVA, and Pearson Correlation Coefficient. A total of five hypotheses were tested in this study. In conclusion, four hypotheses have been accepted, while a hypothesis has been rejected in this study. Further discussion of the results of this research, the data analysis and the implications of the findings will be discussed in chapter five. The study's significance, implications, and recommendations for future research are addressed in the next chapter.