The use of any material in or derived from this report will always be duly acknowledged. Comparison between performance in various aspects such as decomposed signals, index of orthogonality (IO), Hilbert spectrum and so on was performed by both signal processing techniques to determine the accuracy and reliability of the results.
Background
Figure 1.2 shows the signals captured during each of the sleep stages using EEG [4]. These methods can be used to extract characteristics and features for each segment of the signals.
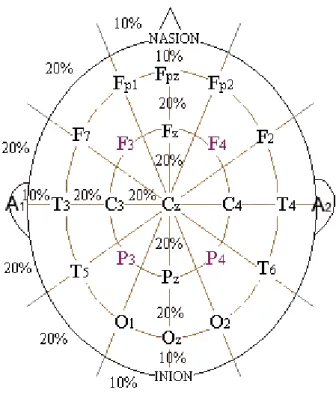
![Figure 1.1 shows that at least 10-20 electrodes are place for EEG measurement [4].](https://thumb-ap.123doks.com/thumbv2/azpdforg/10240426.0/18.893.173.788.573.796/figure-shows-electrodes-place-eeg-measurement.webp)
Aims and Objectives
Experiment Study on Microsleep Event (MSE) to Detect the Sleep Disorder
Feature Fusion for the Detection of Microsleep Event (MSE)
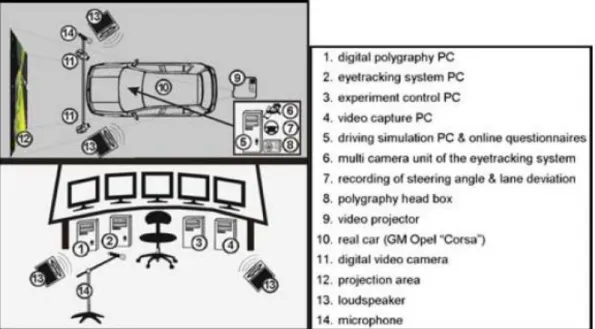
Three signals for each eye, pupil size and two eye gaze coordinates in the projection plane were recorded. LVQ is a useful method for relatively fast optimization of free parameters in the preprocessing and feature extraction stages.
Blind Source Extraction of Microsleep Event
Then these new "emptied" mixtures contain a linear combination of the remaining sources, and the next extraction process will recover the other source. With this approach, the cascaded nonlinear estimator had successfully removed artifacts, nonlinearities, and noise.
Experimental Study on Depression Prevention by Employing Music Therapy
The threshold for each decomposition level was selected to obtain noise-free EEG signals by Inverse Stationary Wavelet Transform (ISWT). For the evaluation based on user identification, k Nearest-Neighbour classifier (kNN) has been selected to be applied in this system.
Decomposition and Classification Methods .1 Fundamental of Wavelets Transform
Fundamental of Support Vector Machine (SVM)
One of the famous methods used to perform the analysis is Support Vector Machine (SVM). There are two parallel hyperplanes that will be constructed on either side of the hyperplanes to maximize the distance between them with the aim of achieving better generalization errors of the classifier.
Fundamental of Empirical Mode Decomposition (EMD)
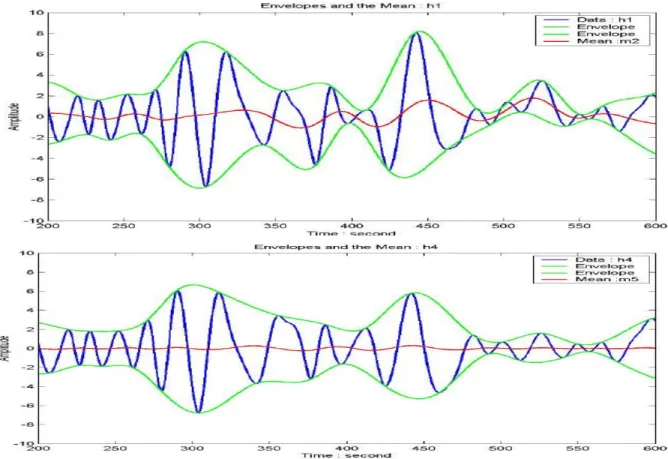
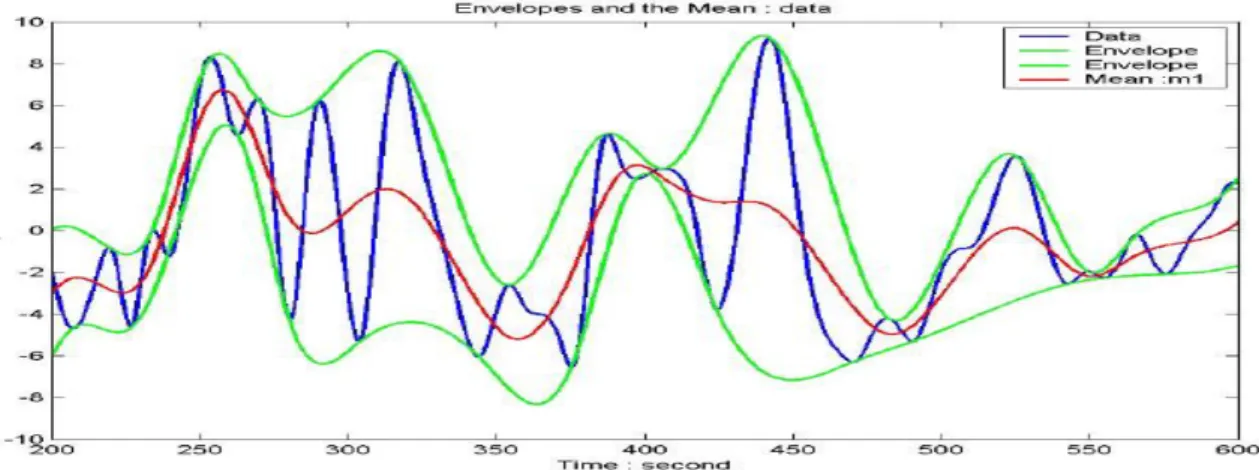
All the local maxima will connect together to obtain the upper envelope, while the local minima will also connect through each other to produce the lower envelope as shown in Figure 2.6 [15]. The Figure 2.7 shows the repeated iterative (screening) step is continued showing that the amplitude of the signal decreases [15].
Comparison between Fourier Transform (FT), Wavelets Transform (WT) and Hilbert-Huang Transform (HHT)
Ensemble Empirical Mode Decomposition (EEMD)
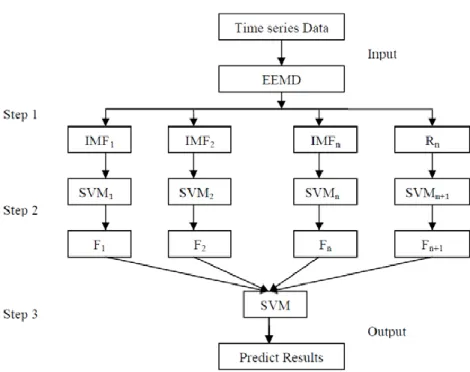
According to [27], the authors proposed that EEMD-based SVMs enable a learning approach, as shown in Figure 2.9. After applying the EEMD method, SVM is used to predict each IMF component and the residual component. The SVM also combines the forecast result of each IMF and the remaining components and produces a summary result as the final forecast of the original time series.
Experimental Study on Sleep Disorder Detection
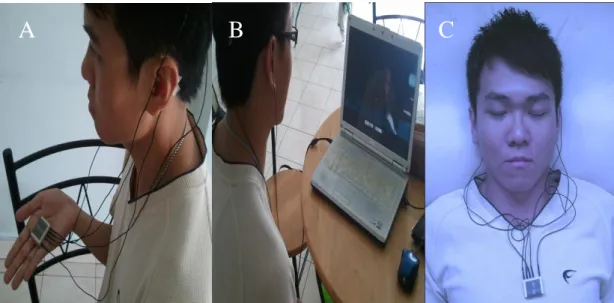
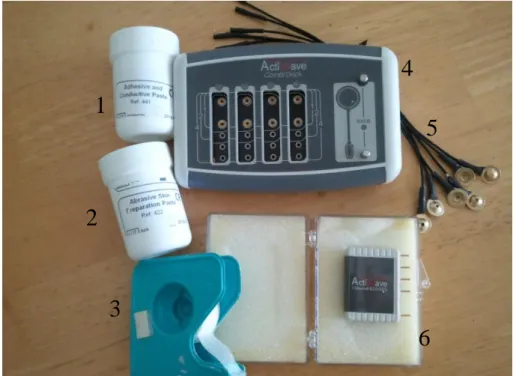
Electrodes that detect the signal should be placed according to the 10-20 electrode placement system as shown in Figure 1.1. There are five signals of EEG which are C3, C4, O1, O2 and A1 were recorded by the CamNtech Actiwave EEG system which was used to perform the task of data collection. Before music is applied to the subject, he/she must also follow several steps which are shown in Figure 3.2. From Figure 3.2, the procedures of experiment can be divided into three steps. From Figure 3.5, it shows the flow diagram of the process to perform the recognition of sleep disorder.
From [28] onwards, there are several stages that can be reached on the basis of EMD, as shown in Figure 3.6, either by inspection or by post-processing in the form of a machine learning algorithm. Using the flowchart shown in Figure 3.7, the signals obtained from the electrode can be decomposed into the data we are interested in.
Fundamental of Signal Processing
Denoising Signal
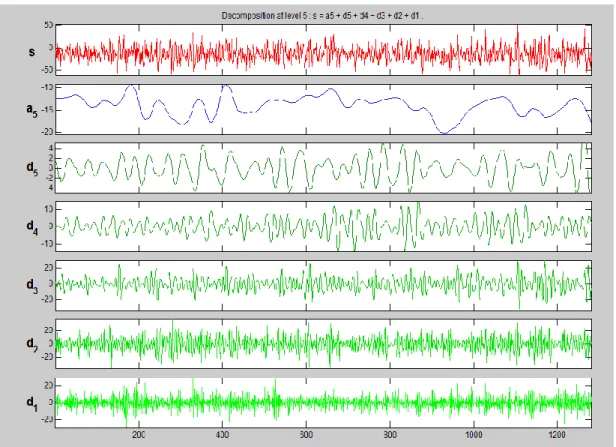
In Figure 3.8, the decomposing of the noisy signal is approximately at a5 and these signals are decompressed at level 5 Daubechies wavelet transform (dB) using 5 dB. From Figure 3.9, s represents the original signals, a takes a low-pass version of the curve for the scaling function, and d takes a high-pass version of the curve for the wavelet function. The general wavelet procedure which is performed as shown in figure 3.10 is to decompress the noisy signal with wavelet transform, remove the noise by choosing the appropriate threshold limit and inverse wavelet transform of the threshold wavelet coefficient to obtain a signal denoise.
During the processing of the signal, we can also present the result in different aspects as shown in Figure 3.11. From Figure 3.11, since the signal has high randomness, it has only one autocorrelation peak when the shift is equal to the signal length.
Compress Signal
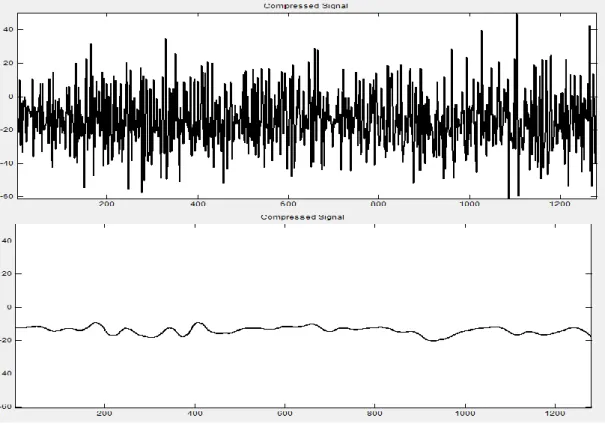
For Figure 3.14 the signal shows it has been compressed and compared to the original signal. For Figure 3.15, the results are displayed in different aspects and the interpretation of autocorrelation and FFT is very similar to that of the denoising signal.
Signal Processing Technique
- Empirical Mode Decomposition (EMD) Method
- Ensemble Empirical Mode Decomposition (EEMD)
- Index of Orthogonality
- Hilbert Spectral Analysis
The “stop criterion” is the determination of the number of screening steps to produce IMF [23]. EEMD defines the true IMF components as the average of an ensemble of trials, each consisting of the signal plus white noise of finite amplitude. Consequently, the performance of index of orthogonality is strongly dependent on the leakage of the decomposed signal during the reconstruction of original data.
The value of the orthogonality index should be as low as possible (close to zero) to ensure the accuracy and efficiency of the analyzed result. In this report, the performance of IMF components generated by EMD and EEMD methods, respectively, will be compared later to determine the reliability of the result.
Comparison between Performance of EMD Method and EEMD and EEMD Method
Details in the IMF Components
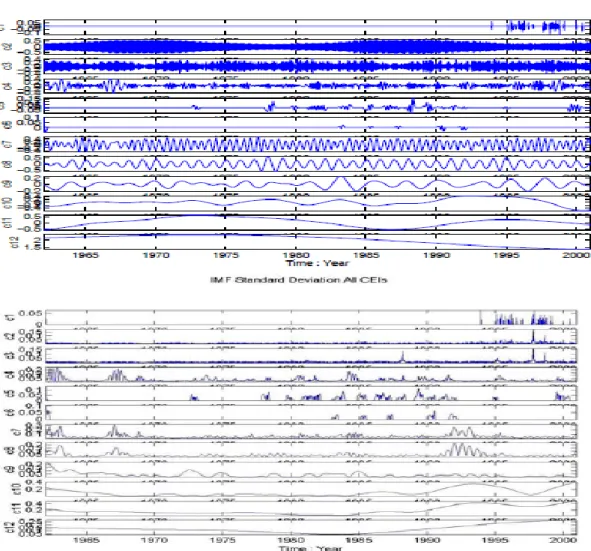
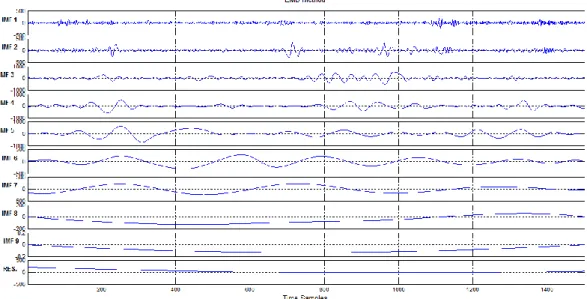
The original EEG data of channel C3, shown in Figure 4.1, were analyzed using the EMD and EEMD methods, respectively. These IMF components based on the EMD method shown in Figure 4.2 and the EEMD method in Figure 4.3 were ranked from low order to higher order. IMF components based on the EEMD method also retain a greater physical meaning of the signal compared to those based on the EMD method.
This occurs significantly by comparing the third IMF methods of EMD and EEMD which are presented in Figure 4.2 and Figure 4.3. Now, we are examining more details of IMF components based on EMD and EEMD methods.
Index of Orthogonality (IO)
One of the simplest ways, which we have already mentioned, is to calculate the value of the index of orthogonality (IO) and evaluate the interpolation techniques in terms of the orthogonality of the components based on the EEG data to ensure the completeness of the EEG data. These IO values were used to show the level of leakage during the degradation process that occurs with both methods. Although the IO values listed are "less square", the displayed result can still be part of the reference values for determining which signal processing technique is the best method to use on EEG data.
Theoretically, the value of IO should be zero to prove data completeness after applying decomposition. With the IO values of EMD and EEMD methods from the result, it can be concluded that the EEMD method can retain more physical meaning and that there will be less information about leakage losses in the IMF components.

Hilbert Spectrum
According to the [38], the instantaneous frequency is used to understand the details mechanisms of non-linear and non-stationary signal. Through the Hilbert transform, the instantaneous frequency can also be derived to compare the accuracy of the result based on these two methods. The instantaneous frequency of EEG signals based on EMD and EEMD methods were shown in Figure 4.10 and Figure 4.11, respectively.
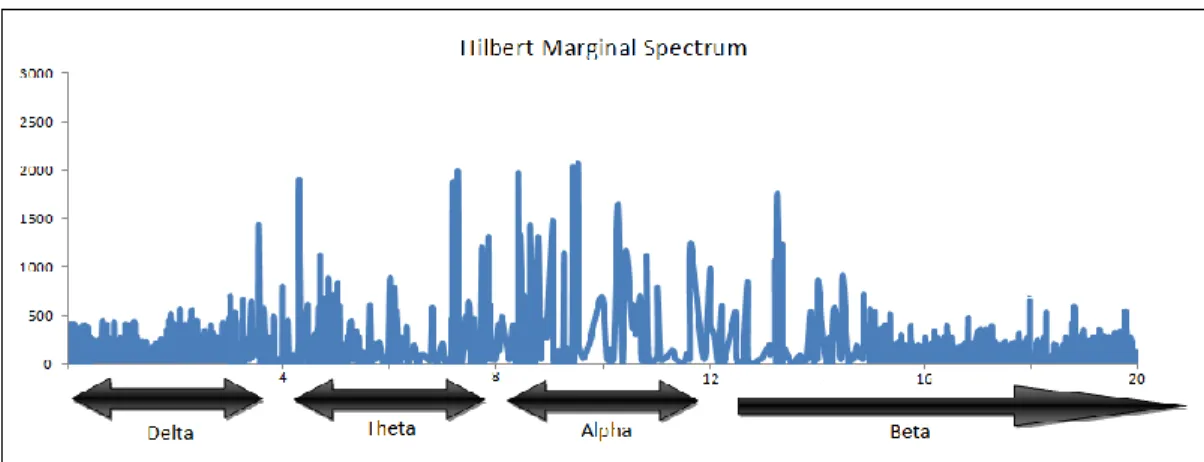
Finally, the last method to compare the performance of these two methods is marginal Hilbert Spectrum. Marginal Hilbert spectrum will be presented to describe the total amplitude (or energy) contribution of EEG signal from each frequency value.
Experimental Study on the Relationship between Effect of Music Therapy and Human Sleep Quality
- Under Conditions after Watching Movie
- Conditions of Sleep without Music and within Music
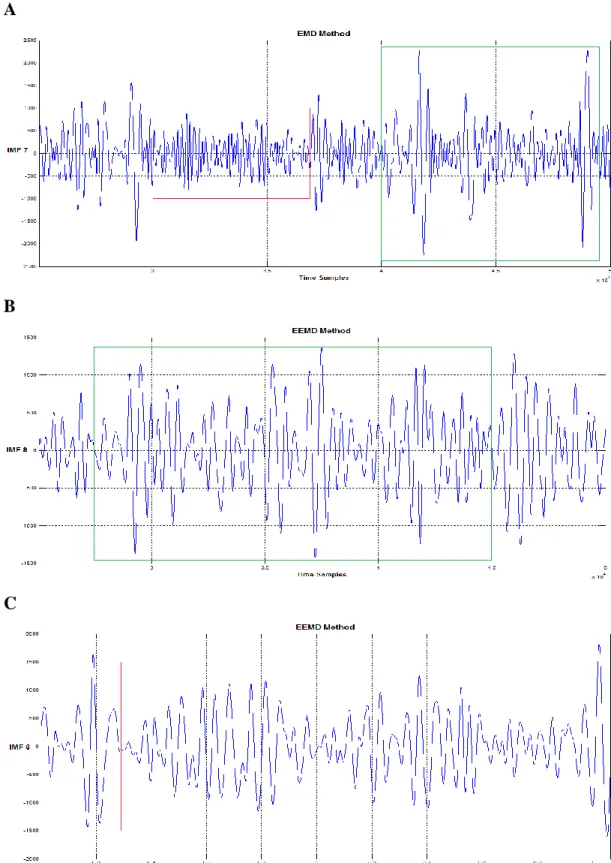
Comparing Figures 4.15A and 4.15B, the decomposed signal of the EEMD method showed an irregular waveform and a slow wave compared to the EMD method. For the O1 channel, the red frames in Figures 4.17 and 4.18 showed a fast alpha version around 15 Hz in the posterior regions of the head, but elsewhere a fast beta rhythm occurs. Both EMD and EEMD methods can show the appearance of light sleep and sleep spindle in Figure 4.18C and 4.18D, respectively.
For channel C3, both the EMD and EEMD are able to detect the features of K-complex displayed in red frames of Figure 4.20A and 4.20B, while the features of sleep spindle in green frames of 4.20C and 4.20D. But the EMD method (Figure 4.21A) lacks the features of K complex compared to the EEMD method (Figure 4.21B).
Determination of Human Sleep Quality based on Amplitude-Frequency Distribution (Marginal Hilbert Spectrum)
Therefore, in this section, the marginal Hilbert spectrum based on EEMD method shown in Figure 4.22 and Figure 4.23 will be performed to compare the effect of music on human sleep quality with that sleep quality without the help of music. From Figure 4.22, the main contribution of amplitudes in the subject's EEG signals was within the frequency ranges of approximately 7-12Hz. This means that, under condition of sleep without music, the alpha rhythms and theta rhythms were mostly detected in EEG signals.
For Figure 4.23, the contributions of amplitudes are mainly distributed within the frequency ranges around 3-10Hz. The results proved that the help of music can actually improve the sleep quality of the person.
Challenges and Future Work
But when both alternative modes were used in the multimodal distribution, the problem still cannot be solved, which leads to a decrease in the accuracy of the analyzed results. For bivariate data analysis, rotation-invariant EMD (RIEMD) proposed by [41] to obtain the local average of the bivariate signal using component-wise spline interpolation and then averaging the local extrema. Recently, multivariate EMD was proposed by [42] to alleviate the problem that occurs in the original EMD algorithm, which is the calculation of the local mean of the original signal.
The standard EMD method in the original EMD algorithm and the EEMD algorithm may lack the ability to process the complex signal, especially by using the EMD algorithm. The multivariate EMD algorithm exploited the concept of bivariate and trivariate as it took signal projections along different directions in n-dimensional spaces to produce multiple n-dimensional envelopes and further averaged them to derive the local mean.
Conclusion
34;The effects of music on the sleep quality of adults with chronic insomnia using evidence from polysomnographic and self-reported analysis: a randomized control trial." Elsevier International Journal of Nursing Studies (accepted 24 February 2012. In Press). 34 Epidemiology of insomnia: prevalence, self-help treatments, consultations and determinants of help-seeking behaviour." Elsevier Journal of Sleep Medicine, 2006, vol.7, pp. 34;User-Centered Depression Prevention: An EEG Approach to Pervasive Healthcare. .
34;A Confid Limit for the Empirical Mode Decomposition and Hilbert Spectra Analysis," i Proceeding Royal Society London, 2003, s.2317-2344. 34;Fingerprint Image Compression using Retain Energy (RE) and Number of Zeros (NZ) through Wavelet Pakke (WP)." International Journal of Computer Science and Security, bind 1, s. 35-42.