ARE ISLAMIC EQUITY MARKETS “SAFE HAVENS”?
EXPLORING THE CONTAGION EFFECTS BETWEEN METAL FUTURE MARKETS AND MALAYSIAN ISLAMIC BONDS USING DCC-FIGARCH DURING THE RECENT GLOBAL FINANCIAL CRISIS OF 2008
Konstantinos Tsiaras
University of Ioannina, University Campus, 54110, Ioannina, Greece (E-mail: [email protected])
ABSTRACT
This paper examines the time-varying conditional correlations between seventeen metal future markets and Malaysian Islāmic bonds. We apply twelve sixvariate dynamic conditional correlation (DCC) FIGARCH models in order to capture potential contagion effects between the markets for the period 2007-2011. Empirical results reveal contagion during the under investigation period regarding the twelve sixvariate models, showing potential volatility transmission channels among the markets and implying that the sukūk bonds are not a safe haven during bearish times without portfolio diversification strategies. Findings have crucial implications for policymakers who provide regulations for the above derivative markets and for investors who invest long-term in Islāmicbonds.
JEL Classification: C58, C61, E44, G10, G20
Key words: DCC-FIGARCH, Metal futures, Ṣukūk, Financial contagion, Islāmicfinance
Submitted: 11/11/2020; Accepted: 18/05/2021; Published 28/12/2021 1. INTRODUCTION
Volatility transmission channels in Islāmic equity markets have motivated empirical researchers to study the contagion in Islāmic bond markets on derivative markets such as future markets during major global crises. The Global Financial Crisis of 2008 has led researchers to explore and discover potential spillovers among various financial and derivative markets, previously unexplored. This paper investigates the volatility spillover effects and the contagion
544 International Journal of Economics, Management and Accounting 29, no. 2 (2021)
effects (positive dynamic condition correlations) among major metal future markets and Malaysian Islāmic bonds (Narayan and Phan, 2019; Ahmed and Elsayed, 2019; Trabelsi, 2019; Gupta and Marfatia, 2019; Umar, 2017; Aloui, Hammoudeh, and Hamida, 2015; Mosaid and Boutti, 2014; Saiti, Bacha, and Masih, 2014;
Rusgianto and Ahmad, 2013; Andersson et al., 2008) for the period 2007-2011. We answer whether Islāmic bond markets are safe havens during major crises by taking into consideration the contagion with the under investigation metal future markets. The recent global financial crisis has made assets with low correlations attractive for investors regarding the systematic risk protection. We extend the correlation analysis of Forbes and Rigobon (2002) by considering the Dynamic Conditional Correlation Fractionally Integrated GARCH (DCC-FIGARCH) of Engle (2002).
The main objectives of this paper are to address the following questions which are under-researched in the literature. Do Dynamic Conditional Correlations (DCCs) among those seemingly unrelated metal futures markets and Islāmic bonds (Zin et al., 2011;
Karim, Kassim, and Arip, 2010) exist? Are those DCCs volatile?
How do those DCCs evolve over time? Are there contagion effects in important periods of major crisis? Based on DCCs, do we observe interdependence? Are the under investigation sukūk bond markets save havens during the recent global financial crisis?
The paper is organized as follows: Section two presents the literature review. Section three describes the model and the data.
Section four considers the empirical results, while Section five concludes.
2. LITERATURE REVIEW
The current literature explores the potential spillover effects among Islāmic financial assets and conventional equities (Metadjer, Benbakhti, and Boulila, 2020; Hassan, Hoque, and Gasbarro, 2019;
Erdogan, Gedikli, and Cevik, 2018; Shahzad et al., 2018a; Abdullah, Saiti, and Masih, 2016; Nagayev et al., 2016; Mensi, Hammoudeh, and Kang, 2015a; Mensi et al., 2015b). Metadjer et al. (2020) analyse the volatility transmission among Islāmic and conventional financial markets. They use daily prices. By applying a bivariate BEKK- GARCH(1,1) model, they show the existence of volatility transmission among the markets. Hassan et al. (2019) explore the volatility linkage between Islāmic indexes and oil for BRIC countries. They find evidence that the volatility error forecast
variance of all five indexes comes from spillover but is much lower compared to volatility spillover between conventional indexes and oil. Shahzad et al. (2018a) use ARMA-FIGARCH models for the period 2005-2015, to show existence of volatility spillover effects between the Islāmic stock markets of the world, Canada, Japan, USA, UK and Islāmic financial stocks (daily data). Erdogan et al.
(2018) use the causality-in-variance test to reveal evidence of volatility spillovers from the Islāmic stock market to the foreign exchange market only in Turkey for the period 2013-2019. By using an MGARCH-DCC model, Nagayev et al. (2016) show correlations between commodity markets and the Dow Jones Islāmic market world index throughout the January 1999–April 2015 period.
Abdullah et al. (2016) find that the Philippine Islāmic stock index is less correlated with crude oil during the period from 2007-2014.
Mensi et al. (2015a) show time-varying linkages of the Saudi stock market with major commodity futures markets including WTI oil, gold, silver, wheat, corn and rice. They use a bivariate DCC–
FIAPARCH model for the period 2005-2014. Mensi et al. (2015b) find linkages between the Sharia-compliant stocks and gold, by using a vine copula approach for the period 2005 to 2014.
Studies have investigated the relationship between Islāmic equities and Islāmic commodity markets (Shahzad et al., 2018b;
Nagayev et al., 2016).
Shahzad et al. (2018) found time-varying dynamic correlation between the Islāmic Market World index, the Islāmic indices of the US, the UK, and Japan and the Islāmic Financials sector index and crude oil prices for the period 1996 to 2015.
Nagayev et al. (2016) found time-varying correlations between commodity markets and the Islāmic Equity Index for the period January 1999 to April 2015.
To the best of our knowledge, this is the first paper considering potential spillover effects between metal future markets and Islāmic bonds.
3. MODEL AND DATA DESCRIPTION 3.1 THE SIXVARIATE DCC-FIGARCH MODEL
To study the time varying conditional correlations between the markets, we describe the dynamics of market logarithmic returns by their first lagged returns, as follows:
546 International Journal of Economics, Management and Accounting 29, no. 2 (2021)
(1) 𝑦𝑡 = 𝜇 + 𝜀𝑡, with t = 1,…,Τ. 𝜀𝑡 is the standardized residual such that:
(2) 𝜀𝑡 = √ℎ𝑡𝑢𝑡, where 𝜀𝑡~𝑁(0, 𝐻𝑡) and 𝑢𝑡~𝑁(0,1) where
ℎ𝑡 = the univariate conditional variance matrix 𝑢𝑡 = the standardized error
𝐻𝑡 = the multivariate conditional variance matrix
The FIGARCH(p,d,q) model (Baillie, Bollerslev and Mikkelsen, 1996) is expressed as follows:
(3) ℎ𝑡= 𝜔[1 − 𝑏(𝐿)]−1+ {1 − [1 − 𝑏(𝐿)]−1𝛷(𝐿)(1 − 𝐿)𝑑}𝜀𝑡2
where ω is mean of the logarithmic conditional variance, Φ(L) = [1 − 𝑎(𝐿) − 𝑏(𝐿)](1 − 𝐿)−1 is lag polynomial of order p and (1 − 𝐿)𝑑 is fractional difference operator. Additionally, b(L) and a(L) are autoregressive polynomials of order p and q so that: 𝑏(𝐿) = 1 −
∑𝑃𝑘=1𝑏𝑘𝐿𝑘 and 𝑎(𝐿) = 1 + ∑𝑞𝑙=1𝑎𝑙𝐿𝑙.
The variance-covariance matrix of the residuals (Engle 2002) is defined as follows:
(4) 𝛨𝑡 = 𝐷𝑡𝑅𝑡𝐷𝑡
𝐷𝑡 is the conditional variance matrix given by:
(5) 𝐷𝑡 = 𝑑𝑖𝑎𝑔 (ℎ11𝑡
1
2 … ℎ𝑁𝑁𝑡
1
2 )
𝑅𝑡 is the condition correlation matrix of N x N dimension, and is defined as follows:
(6) 𝑅𝑡 = (𝜌𝑖𝑖𝑡) = 𝑑𝑖𝑎𝑔(𝑞11,𝑡−
1
2 … 𝑞𝑁𝑁,𝑡−
1
2 )𝑄𝑡𝑑𝑖𝑎𝑔(𝑞11,𝑡−
1
2 … 𝑞𝑁𝑁,𝑡−
1
2 ) where the N x N symmetric positive definite matrix 𝑄𝑡 = (𝑞𝑖𝑖,𝑡) is given by:
(7) 𝑄𝑡 = (1 − 𝛼 − 𝛽)𝑄̅ + 𝛼𝑢𝑡−1𝑢𝑡−1′ + 𝛽𝑄𝑡−1,
𝑄̅ is the N x N unconditional variance matrix of 𝑢𝑡, and α and β are nonnegative scalar parameters, satisfying α + β < 1.
The parameters of the DCC-FIGARCH model are estimated by using the Full Information Maximum Likelihood (FIML) method with student’s t-distributed errors as follows:
(9)
∑ [𝑙𝑜𝑔 𝛤 (𝜈 + 𝑘 2 ) [𝜈𝜋]𝑘2𝛤 (𝜈
2) 𝜈 − 2
𝑘 2 𝛵
𝑡=1
−1
2log (|𝛨𝑡|) − (𝑘 + 𝜈
2 ) 𝑙𝑜𝑔 [1 +𝜀𝑡′𝛨𝑡−1𝜀𝑡 𝜈 − 2 ]]
where Γ(.) is the Gamma function, k is the number of equations, and ν is the degrees of freedom.
3.2 DATA DESCRIPTION
In this paper, we use daily data for 17 metal future and Malaysian Ṣukūk markets: NYM-PLATINUM CONTINUOUS - SETT. PRICE, CMX-HIGH GRADE COPPER CONT. - SETT. PRICE, CMX- SILVER 5000 OZ CONTINUOUS - SETT. PRICE, LME-LEAD CONTINUOUS - SETT. PRICE, DGCX-GOLD CONTINUOUS - SETT. PRICE, RF BPAM SUKUK 1-3Y IDX - TOT RETURN IND, RF BPAM SUKUK 3-7Y IDX - TOT RETURN IND, RF BPAM BNM SUKUK 3M-1Y IDX - TOT RETURN IND, RF BPAM CORP SUKUK IDX - TOT RETURN IND, RF BPAM GVT SUKUK 1-3Y IDX - TOT RETURN IND, RF BPAM GVT SUKUK 3-7Y IDX - TOT RETURN IND, RF BPAM GVT SUKUK 3M-1Y IDX - TOT RETURN IND, RF BPAM GVT SUKUK 7+Y IDX - TOT RETURN IND, RF BPAM GVT SUKUK IDX - TOT RETURN IND, RF BPAM LIQUID SUKUK 5 IDX - TOT RETURN IND, RF BPAM QUASI GVT SUKUK 3-7Y IDX - TOT RETURN IND and RF BPAM QUASI GVT SUKUK 7+Y IDX - TOT RETURN IND. The period of observation starts on 16th February 2007, and ends on 5th October 2011, one month after Standard & Poor's downgraded America's credit rating from AAA to AA+ (6 August 2011) for the first time since 1941 and one day after the S&P 500 faced a decline of 21.58% for last time after GFC. All prices have been extracted from Datastream® Database. For each market we use 1209 observations. Market logarithmic returns
548 International Journal of Economics, Management and Accounting 29, no. 2 (2021)
generated by 𝑟𝑡 = 𝑙𝑜𝑔 (𝑝𝑡) −𝑙𝑜𝑔(𝑝𝑡−1), where 𝑝𝑡 is the price of CDS spread on day t.
In Tables 1, 2, 3, 4, 5 and 6 we see the summary statistics for the market logarithmic returns. DGCX-GOLD_CONTINUOUS_- _SETT._PRICE exhibits the highest mean value (0,00031489).
Based on the highest std. deviation (0.012487) values, LME- LEAD_CONTINUOUS_-_SETT._PRICE presents the largest fluctuations among all the markets. Additionally, all market returns are negatively skewed, except the cases of RF_BPAM_BNM_SUKUK_3M-1Y_IDX_-
_TOT_RETURN_IND,RF_BPAM_GVT_SUKUK_7+Y _IDX_- _TOT_RETURN_IND and RF_BPAM_QUASI_GVT_SUKUK_3- 7Y_IDX_-_TOT_RETURN_IND. Furthermore, we observe that all market returns show excess kurtosis. In addition, Jarque-Bera statistic results indicate the rejection of the null hypothesis of normality for all market returns. ADF (Dickey and Fuller 1979) test results reject the null hypotheses of unit root at 1% level, showing that the daily market logarithmic returns are appropriate for further testing.
TABLE 1
Summary Statistics of the Daily Market Logarithmic Returns NYM-
PLATINUM_C ONTINUOUS_- _SETT._PRICE
CMX- HIGH_GRADE _COPPER_CON T._- _SETT._PRICE
CMX- SILVER_5000_
OZ_CONTINU OUS_- _SETT._PRICE
Mean 6.842e-005 5.7065e-005 0.00027232
Minimum -0.041707 -0.050245 -0.084768
Maximum 0.069579 0.050996 0.053672
Std. Deviation 0.0077048 0.0099042 0.01083
Skewness -0.090561 -0.17655 -0.88420
t-Statistic 1.2860 2.5071 12.557
p-Value 0.19843 0.012172 3.6615e-036
Excess Kurtosis 8.8699*** 2.4009*** 6.1481***
t-Statistic 63.032 17.062 43.690
p-Value 0.00000 2.8696e-065 0.00000
Jarque-Bera 3958.4*** 296.17*** 2058.2***
p-Value 0.00000 4.8775e-065 0.00000
ADF Test -19.57*** -20.9202*** -19.7957***
Note: downloaded from Datastream Database
TABLE 2
Summary Statistics of the Daily Market Logarithmic Returns LME-
LEAD_CONTIN UOUS_- _SETT._PRICE
DGCX- GOLD_CONTIN UOUS_- _SETT._PRICE
RF_BPAM_SUK UK_1-3Y_IDX_- _TOT_RETURN _IND Mean 1,5761e-005 0.00031489 7.3158e-005
Minimum -0.057093 -0.027838 -0.003733
Maximum 0.055881 0.04234 0.0037019
Std. Deviation 0.012487 0.0058269 0.00060851
Skewness -0.18431 -0.17346 -0.50362
t-Statistic 2.6174 2.4633 7.1519
p-Value 0.0088592 0.013766 8.5610e-013
Excess Kurtosis 1.5328*** 4.5917*** 8.8061***
t-Statistic 10.893 32.630 62.579
p-Value 1.2471e-027 1.5485e-233 0.00000 Jarque-Bera 125.00*** 1066.4*** 3951.0***
p-Value 7.1913e-028 2.7530e-232 0.00000 ADF Test -20.0239*** -20.3989*** -18.0612***
Note: downloaded from Datastream Database
TABLE 3
Summary Statistics of the Daily Market Logarithmic Returns RF_BPAM_
SUKUK_3- 7Y_IDX_- _TOT_RET URN_IND
RF_BPAM_BNM _SUKUK_3M- 1Y_IDX_- _TOT_RETURN_
IND
RF_BPAM_CO RP_SUKUK_ID X_- _TOT_RETUR N_IND Mean 7.066e-005 4.4911e-005 8.8942e-005 Minimum -0.0045339 -0.0010516 -0.0041346
Maximum 0.0037467 0.0020192 0.0040344
Std. Deviation 0.00064881 0.00012668 0.00044708
Skewness -0.68673 2.8329 -1.1453
t-Statistic 9.7522 40.230 16.264
p-Value 1.8058e-022 0.00000 1.7756e-059 Excess Kyrtosis 10.371*** 59.668*** 24.914***
t-Statistic 73.696 424.02 177.05
p-Value 0.00000 0.00000 0.00000
Jarque-Bera 5503.6*** 1.8067e+005*** 31480.0***
p-Value 0.00000 0.00000 0.00000
ADF Test -17.6917*** -14.7669*** -15.0659***
Note: downloaded from Datastream Database
550 International Journal of Economics, Management and Accounting 29, no. 2 (2021)
TABLE 4
Summary Statistics of the Daily Market Logarithmic Returns RF_BPAM_G
VT_SUKUK_
1-3Y_IDX_- _TOT_RETU RN_IND
RF_BPAM_GV T_SUKUK_3- 7Y_IDX_- _TOT_RETUR N_IND
RF_BPAM_GV T_SUKUK_3M -1Y_IDX_- _TOT_RETUR N_IND Mean 6.3848e-005 9.9665e-005 6.8422e-005 Minimum -0.0065031 -0.0034828 -0.0045182 Maximum 0.0055586 0.0031393 0.0037317 Std. Deviation 0.00067193 0.00043971 0.00064444
Skewness -0.73531 -0.12946 -0.72526
t-Statistic 10.442 1.8385 10.299
p-Value 1.5938e-025 0.065986 7.0913e-025 Excess Kurtosis 21.137*** 14.910*** 10.533***
t-Statistic 150.20 105.95 74.850
p-Value 0.00000 0.00000 0.00000
Jarque-Bera 22577.0*** 11183.0*** 5685.2***
p-Value 0.00000 0.00000 0.00000
ADF Test -17.8444*** -16.5772*** -17.7203***
Note: downloaded from Datastream Database
TABLE 5
Summary Statistics of the Daily Market Logarithmic Returns RF_BPAM_G
VT_SUKUK_
7+Y_IDX_- _TOT_RETU RN_IND
RF_BPAM_GVT_
SUKUK_IDX_- _TOT_RETURN_I ND
RF_BPAM_LIQ UID_GVT_SUK UK_5_IDX_- _TOT_RETURN _IND Mean 9.0721e-005 7.2874e-005 7.1308e-005 Minimum -0.0036794 -0.004182 -0.0042998
Maximum 0.0036746 0.0037118 0.0050544
Std. Deviation 0.00044991 0.00062147 0.00061634
Skewness 0.17199 -0.62187 -0.012304
t-Statistic 2.4425 8.8312 0.17473
p-Value 0.014587 1.0359e-018 0.86129
Excess Kurtosis 20.698*** 9.6413*** 15.683***
t-Statistic 147.09 68.514 111.44
p-Value 0.00000 0.00000 0.00000
Jarque-Bera 21552.0*** 4752.6*** 12369.0***
p-Value 0.00000 0.00000 0.00000
ADF Test -15.1005*** -17.8395*** -17.5464***
Note: downloaded from Datastream Database
TABLE 6
Summary Statistics of the Daily Market Logarithmic Returns RF_BPAM_QUASI_
GVT_SUKUK_3- 7Y_IDX_- _TOT_RETURN_IN D
RF_BPAM_QUASI_
GVT_SUKUK_7+Y_
IDX_- _TOT_RETURN_IN D
Mean 7.6052e-005 9.5025e-005
Minimum -0.0051022 -0.010678
Maximum 0.0065467 0.0095786
Std. Deviation 0.00055232 0.0010464
Skewness 0.90058 -0.41773
t-Statistic 12.789 5.9322
p-Value 1.8883e-037 2.9896e-009
Excess Kurtosis 36.771*** 26.597***
t-Statistic 261.31 189.01
p-Value 0.00000 0.00000
Jarque-Bera 68163.0*** 35611.0***
p-Value 0.00000 0.00000
ADF Test -17.1442*** -16.5838***
Note: downloaded from Datastream Database
Ιn Figure 1, we plot the actual series of all market logarithmic returns. The visual inspection of logarithmic returns provides a clear view of the trend for all markets. The graphs indicate the presence of heteroskedasticity rationalizing the use of the dynamic conditional correlations in the multivariate FIGARCH(1,d,1) framework.
FIGURE 1
Actual Series of the Logarithmic Returns of the Markets
552 International Journal of Economics, Management and Accounting29, no.2 (2021)
4. EMPIRICAL RESULTS
This section is divided into four subsections. First, in section 4.1, the results from the DCC-FIGARCH(1,d,1) model are described.
Second, section 4.2 presents the estimates of average correlations.
Third, section 4.3 provides an explicit economic analysis based on dynamic conditional correlations (DCCs), while in section 4.4, we present the diagnostic tests.
4.1 RESULTS OF THE DCC-FIGARCH(1,d,1) MODEL TABLE 7
Estimates of Univariate FIGARCH (1,d,1) Model NYM-
PLATINUM_C ONTINUOUS_- _SETT._PRICE
CMX- HIGH_GRADE _COPPER_CO NT._- _SETT._PRICE
CMX- SILVER_5000_
OZ_CONTINU OUS_- _SETT._PRICE constant (μ) 0.000245* 0.000407* 0.000723**
t-Statistic 1.380 1.734 2.588
p-Value 0.1680 0.0832 0.0098
constant (ω) 0.687211** 3.213905* 0.036844*
t-Statistic 2.153 1.462 1.484
p-Value 0.0315 0.1441 0.1381
d-Figarch 0.853906*** 0.430093** 0.458978**
t-Statistic 10.98 2.914 2.313
p-Value 0.0000 0.0036 0.0209
ARCH (a) 0.133657* 0.215736** 0.444432***
t-Statistic 1.798 2.417 3.082
p-Value 0.0724 0.0158 0.0021
GARCH (b) 0.899229*** 0.57559*** 0.713147***
t-Statistic 103.5 3.640 4.993
p-Value 0.0000 0.0003 0.0000
Note: downloaded from Datastream Database
554 International Journal of Economics, Management and Accounting 29, no. 2 (2021)
TABLE 8
Estimates of Univariate FIGARCH (1,d,1) Model LME-LEAD_
CONTINUOUS _- _SETT._PRICE
DGCX-GOLD_
CONTINUOUS _- _SETT._PRICE
RF_BPAM_SUK UK_1-3Y_IDX_- _TOT_RETURN_
IND constant (μ) 0.000284 0.000352** 0.0000891***
t-Statistic 0.8579 2.384 7.128
p-Value 0.3911 0.0173 0.0000
constant (ω) 0.042232* 0.643278* 0.003660*
t-Statistic 1.579 1.647 1.538
p-Value 0.1147 0.0998 0.1244
d-Figarch 0.429396*** 0.670316*** 0.582602***
t-Statistic 3.548 4.296 6.050
p-Value 0.0004 0.0000 0.0000
ARCH (a) 0.382870*** 0.115474* 0.791247***
t-Statistic 4.389 1.284 6.801
p-Value 0.0000 0.1995 0.0000
GARCH (b) 0.726910*** 0.769180*** 0.858902***
t-Statistic 9.597 7.727 11.58
p-Value 0.0000 0.0000 0.0000
Note: downloaded from Datastream Database
TABLE 9
Estimates of univariate FIGARCH (1,d,1) model RF_BPAM_SU
KUK_3- 7Y_IDX_- _TOT_RETURN _IND
RF_BPAM_BNM_
SUKUK_3M- 1Y_IDX_- _TOT_RETURN_I ND
RF_BPAM_CO RP_SUKUK_I DX_- _TOT_RETUR N_IND constant (μ) 0.0000831*** 0.0000281** 0.0000961***
t-Statistic 6.393 2.125 7.532
p-Value 0.0000 0.0338 0.0000
constant (ω) 0.035095** 0.0001687** 0.022481*
t-Statistic 2.113 2.398 1.057
p-Value 0.0348 0.0166 0.2906
d-Figarch 0.493628*** 0.917064*** 0.159071*
t-Statistic 7.058 9.461 1.818
p-Value 0.0000 0.0000 0.0693
ARCH (a) -0.579136*** 0.026092 0.627434**
t-Statistic -3.669 0.2376 2.227
TABLE 9 (continued) RF_BPAM_SU
KUK_3- 7Y_IDX_- _TOT_RETURN _IND
RF_BPAM_BNM_
SUKUK_3M- 1Y_IDX_- _TOT_RETURN_I ND
RF_BPAM_CO RP_SUKUK_I DX_- _TOT_RETUR N_IND
p-Value 0.0003 0.8122 0.0261
GARCH (b) -0.499465** 0.883307*** 0.525054*
t-Statistic -2.867 26.12 1.832
p-Value 0.0042 0.0000 0.0672
Note: downloaded from Datastream Database
TABLE 10
Estimates of Univariate FIGARCH (1,d,1) Model RF_BPAM_GVT
_SUKUK_1- 3Y_IDX_- _TOT_RETURN _IND
RF_BPAM_GVT _SUKUK_3- 7Y_IDX_- _TOT_RETURN _IND
RF_BPAM_GVT _SUKUK_3M- 1Y_IDX_- _TOT_RETURN _IND constant (μ) 0.0000821*** 0.0001011*** 0.0000841***
t-Statistic 6.676 7.674 6.734
p-Value 0.0000 0.0000 0.0000
constant (ω) 0.001618*** 0.0004029*** 0.030760**
t-Statistic 3.126 4.184 2.047
p-Value 0.0018 0.0000 0.0409
d-Figarch 1.352398*** 1.183265*** 0.493893***
t-Statistic 9.288 15.59 7.399
p-Value 0.0000 0.0000 0.0000
ARCH (a) -0.049630 -0.128517* -0.556928***
t-Statistic -0.3254 -1.512 -3.773
p-Value 0.7449 0.1308 0.0002
GARCH (b) 0.964206*** 0.968885*** -0.465627**
t-Statistic 68.29 151.4 -2.900
p-Value 0.0000 0.0000 0.0038
Note: downloaded from Datastream Database
556 International Journal of Economics, Management and Accounting 29, no. 2 (2021)
TABLE 11
Estimates of Univariate FIGARCH (1,d,1) Model RF_BPAM_GV
T_SUKUK_7+
Y_IDX_- _TOT_RETUR N_IND
RF_BPAM_GV T_SUKUK_ID X_- _TOT_RETUR N_IND
RF_BPAM_LIQ UID_GVT_SU KUK_5_IDX_- _TOT_RETUR N_IND constant (μ) 0.0001111*** 0.0000841*** 0.0000821***
t-Statistic 7.413 6.704 6.676
p-Value 0.0000 0.0000 0.0000
constant (ω) 0.014120* 0.041658** 0.0016618***
t-Statistic 1.643 2.495 3.126
p-Value 0.1006 0.0127 0.0018
d-Figarch 0.377846*** 0.502477*** 1.352398***
t-Statistic 4.885 6.699 9.288
p-Value 0.0000 0.0000 0.0000
ARCH (a) -0.577149*** -0.559626** -0.049630
t-Statistic -3.977 -2.888 -0.3254
p-Value 0.0001 0.0039 0.7449
GARCH (b) -0.405165** -0.495464** 0.964206***
t-Statistic -2.400 -2.261 68.29
p-Value 0.0166 0.0239 0.0000
Note: downloaded from Datastream Database
TABLE 12
Estimates of Univariate FIGARCH (1,d,1) Model RF_BPAM_QUASI_
GVT_SUKUK_3- 7Y_IDX_- _TOT_RETURN_IN D
RF_BPAM_QUASI_G VT_SUKUK_7+Y_ID X_- _TOT_RETURN_IND constant (μ) 0.0000871*** 0.0001101***
t-Statistic 6.195 5.623
p-Value 0.0000 0.0000
constant (ω) 0.002971* 0.004895**
t-Statistic 1.660 2.496
p-Value 0.0972 0.0127
d-Figarch 0.809664** 1.225779***
t-Statistic 2.213 8.037
p-Value 0.0271 0.0000
ARCH (a) 0.373508* 0.122938
TABLE 12 (continued) RF_BPAM_QUASI_
GVT_SUKUK_3- 7Y_IDX_- _TOT_RETURN_IND
RF_BPAM_QUASI_G VT_SUKUK_7+Y_ID X_- _TOT_RETURN_IND
t-Statistic 1.066 0.5527
p-Value 0.2865 0.5805
GARCH (b) 0.855576*** 0.967492***
t-Statistic 6.297 101.6
p-Value 0.0000 0.0000
Note: downloaded from Datastream Database
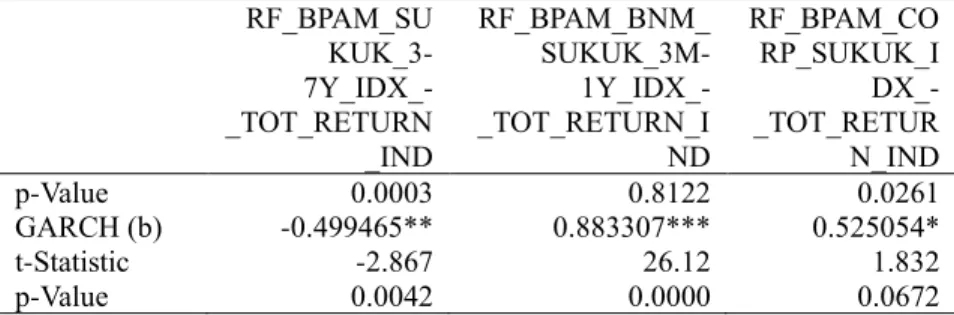
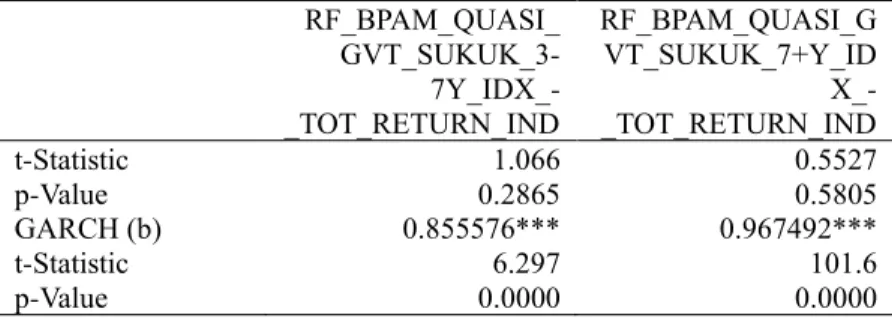
Table 7 to 12 report estimated values for mean equation and univariate FIGARCH(1,d,1) model. Mean equation exhibits significant μ value for all markets except the case of LME- LEAD_CONTINUOUS_-_SETT._PRICE. Based on FIGARCH, our findings show the existence of long memory for most markets (0<d<1) and that RF BPAM GVT SUKUK 1-3Y IDX - TOT RETURN IND, RF BPAM GVT SUKUK 3-7Y IDX - TOT RETURN IND, RF BPAM LIQUID SUKUK 5 IDX - TOT RETURN IND and RF BPAM QUASI GVT SUKUK 7+Y IDX - TOT RETURN IND have no long memory (d>1). In addition, all the ARCH (a) and GARCH (b) terms are highly significant except for the ARCH (a) term of RF BPAM BNM SUKUK 3M-1Y IDX - TOT RETURN IND, RF BPAM GVT SUKUK 1-3Y IDX - TOT RETURN IND, RF BPAM LIQUID SUKUK 5 IDX - TOT RETURN IND and RF BPAM QUASI GVT SUKUK 7+Y IDX - TOT RETURN IND.
Figure 2 plots the behavior of conditional variances for all markets. By conducting a visual exploration, we observe that all markets exhibit strong ups and downs over time. Additionally, we observe large spikes in September 2008 revealing the effects of global economic crises.
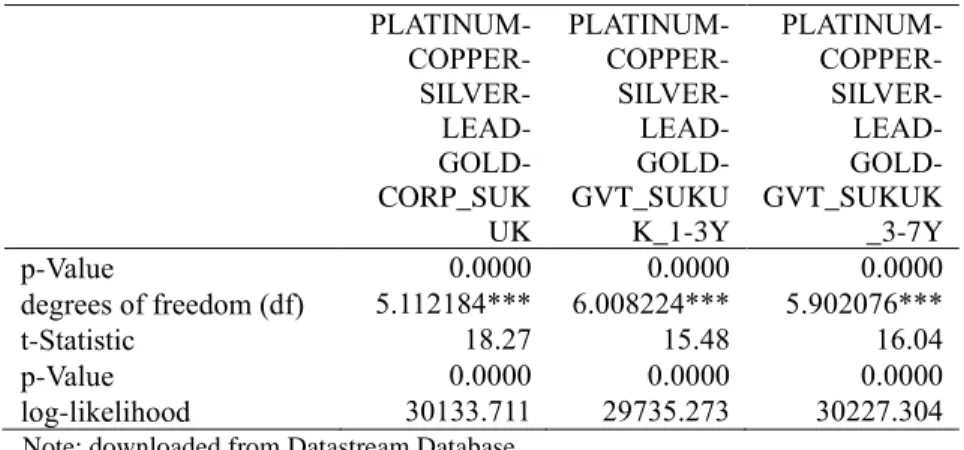
Tables 13 to 16 report the results of the twelve sixvariate DCC model estimations. The DCC model results show significant α and β parameters, indicating strong ARCH and GARCH effects, suggesting empirical evidence that the markets are integrated. In addition, we provide the estimates of the degrees of freedom (v) and of the log-likelihood.
FIGURE 2
Conditional Variances of the Univariate GARCH (1,1) Model
558 International Journal of Economics, Management and Accounting29, no.2 (2021)
FIGURE 3
Conditional Covariances of the Bivariate DCC-GARCH (1,1) Model
Are Islamic Equity Markets “Safe Havens”? Exploring the Contagion Effects…. 559
560 International Journal of Economics, Management and Accounting 29, no. 2 (2021)
In Figure 3 we graph the conditional covariances. Results suggest positive values for the most conditional covariances, while for some market pairs, conditional covariances present negative prices.
TABLE 13
Estimates of he Sixvariate DCC-FIGARCH (1,d,1) Model, Degrees of Freedom, Log-Likelihood
PLATINUM- COPPER- SILVER- LEAD- GOLD- SUKUK_1-
3Y
PLATINUM -COPPER- SILVER- LEAD- GOLD- SUKUK_3-
7Y
PLATINUM- COPPER- SILVER- LEAD- GOLD- BNM_SUKU
K_3M-1Y alpha (α) 0.027900*** 0.027411*** 0.026686***
t-Statistic 5.829 5.749 5.891
p-Value 0.0000 0.0000 0.0000
beta (β) 0.894857*** 0.896451*** 0.911243***
t-Statistic 45.83 46.35 51.18
p-Value 0.0000 0.0000 0.0000
degrees of freedom (df) 6.743013*** 6.664999*** 5.579965***
t-Statistic 14.26 14.58 17.52
p-Value 0.0000 0.0000 0.0000
log-likelihood 29685.535 29671.343 31649.446 Note: downloaded from Datastream Database
TABLE 14
Estimates of the Sixvariate DCC-FIGARCH (1,d,1) Model, Degrees of Freedom, Log-likelihood
PLATINUM- COPPER- SILVER- LEAD- GOLD- CORP_SUK
UK
PLATINUM- COPPER- SILVER- LEAD- GOLD- GVT_SUKU
K_1-3Y
PLATINUM- COPPER- SILVER- LEAD- GOLD- GVT_SUKUK
_3-7Y alpha (α) 0.028822*** 0.027218*** 0.024999***
t-Statistic 6.030 5.479 5.145
p-Value 0.0000 0.0000 0.0000
beta (β) 0.900485*** 0.901666*** 0.911781***
t-Statistic 48.51 44.40 44.40
TABLE 14 (continued) PLATINUM-
COPPER- SILVER- LEAD- GOLD- CORP_SUK
UK
PLATINUM- COPPER- SILVER- LEAD- GOLD- GVT_SUKU
K_1-3Y
PLATINUM- COPPER- SILVER- LEAD- GOLD- GVT_SUKUK
_3-7Y
p-Value 0.0000 0.0000 0.0000
degrees of freedom (df) 5.112184*** 6.008224*** 5.902076***
t-Statistic 18.27 15.48 16.04
p-Value 0.0000 0.0000 0.0000
log-likelihood 30133.711 29735.273 30227.304 Note: downloaded from Datastream Database
TABLE 15
Estimates of the Sixvariate DCC-FIGARCH (1,d,1) Model, Degrees of Freedom, Log-Likelihood
PLATINUM -COPPER- SILVER- LEAD- GOLD- GVT_SUKU
K_3M-1Y
PLATINUM -COPPER- SILVER- LEAD- GOLD- GVT_SUK
UK_7+Y
PLATINUM -COPPER- SILVER- LEAD- GOLD- GVT_SUKU
K alpha (α) 0.027153*** 0.026288*** 0.027516***
t-Statistic 5.760 5.515 5.896
p-Value 0.0000 0.0000 0.0000
beta (β) 0.897064*** 0.904885*** 0.896806***
t-Statistic 46.68 46.84 47.44
p-Value 0.0000 0.0000 0.0000
degrees of freedom (df) 6.759783*** 5.685455*** 6.684407***
t-Statistic 14.36 17.21 14.48
p-Value 0.0000 0.0000 0.0000
log-likelihood 29679.650 30182.048 29669.039 Note: downloaded from Datastream Database
562 International Journal of Economics, Management and Accounting 29, no. 2 (2021)
TABLE 16
Estimates of the Sixvariate DCC-FIGARCH (1, d, 1) Model, Degrees of Freedom, Log-Likelihood
PLATINUM -COPPER- SILVER- LEAD- GOLD- LIQUID_G VT_SUKUK _5
PLATINUM -COPPER- SILVER- LEAD- GOLD- QUASI_GV T_SUKUK_
3-7Y
PLATINUM- COPPER- SILVER- LEAD- GOLD- QUASI_GV T_SUKUK_
7+Y alpha (α) 0.027218*** 0.024804*** 0.027878***
t-Statistic 5.479 5.169 5.364
p-Value 0.0000 0.0000 0.0000
beta (β) 0.901666*** 0.908472*** 0.898987***
t-Statistic 44.40 44.45 41.73
p-Value 0.0000 0.0000 0.0000
degrees of freedom (df) 6.008224*** 5.198483*** 5.284416***
t-Statistic 15.48 18.47 17.71
p-Value 0.0000 0.0000 0.0000
log-likelihood 29735.273 30049.448 29210.908 Note: downloaded from Datastream Database
TABLE 17
Estimates for the Average Correlations of the Sixvariate DCC- FIGARCH (1,d,1) Model
Coefficient t-Statistic p-Value
PLATINUM-COPPER 0.483722*** 16.25 0.0000
PLATINUM-SILVER 0.700087*** 38.73 0.0000
PLATINUM-LEAD 0.368109*** 11.17 0.0000
PLATINUM-GOLD 0.609988*** 26.92 0.0000
PLATINUM-SUKUK_1-3Y 0.023563 0.6245 0.5324
COPPER-SILVER 0.506797*** 18.52 0.0000
COPPER-LEAD 0.609039*** 27.18 0.0000
COPPER-GOLD 0.387408*** 12.27 0.0000
COPPER-SUKUK_1-3Y 0.017078 0.4906 0.6238
SILVER-LEAD 0.362812*** 11.41 0.0000
SILVER-GOLD 0.767261*** 48.36 0.0000
SILVER-SUKUK_1-3Y 0.054737* 1.483 0.1383
TABLE 17 (continued)
Coefficient t-Statistic p-Value
LEAD-GOLD 0.272763*** 8.163 0.0000
LEAD-SUKUK_1-3Y -0.021623 -0.6667 0.5051
SUKUK_1-3Y-GOLD 0.078951** 2.070 0.0387
SUKUK_3-7Y-PLATINUM 0.020599 0.5500 0.5825
SUKUK_3-7Y-COPPER 0.023083 0.6580 0.5107
SUKUK_3-7Y-SILVER 0.054085* 1.483 0.1382
SUKUK_3-7Y-LEAD -0.025934 -0.7925 0.4282
SUKUK_3-7Y-GOLD 0.080818** 2.141 0.0325
BNM_SUKUK_3M-1Y-PLATINUM -0.001874 -0.05051 0.9597 BNM_SUKUK_3M-1Y-COPPER 0.037690* 1.045 0.2961 BNM_SUKUK_3M-1Y-SILVER 0.018551 0.5189 0.6039 BNM_SUKUK_3M-1Y-LEAD 0.017507 0.4839 0.6286 BNM_SUKUK_3M-1Y-GOLD 0.052675* 1.438 0.1507 CORP_SUKUK-PLATINUM -0.039119 -0.8823 0.3778 CORP_SUKUK-COPPER -0.025773 -0.6407 0.5219 CORP_SUKUK-SILVER -0.010618 -0.2592 0.7956 CORP_SUKUK-LEAD -0.001450 -0.03598 0.9713
CORP_SUKUK-GOLD 0.023871 0.6062 0.5445
GVT_SUKUK_1-3Y-PLATINUM 0.018432 0.4450 0.6564 GVT_SUKUK_1-3Y-COPPER 0.013261 0.3573 0.7209 GVT_SUKUK_1-3Y- SILVER 0.012743 0.3240 0.7460 GVT_SUKUK_1-3Y-LEAD 0.004133 0.1223 0.9027 GVT_SUKUK_1-3Y-GOLD 0.035982 0.9216 0.3569 Note: downloaded from Datastream Database
TABLE 18
Estimates for the Average Correlations of the Sixvariate DCC- FIGARCH (1,d,1) Model
Coefficient t-
Statistic
p- Value GVT_SUKUK_3-7Y-PLATINUM 0.000667 0.01716 0.9863 GVT_SUKUK_3-7Y-PLATINUM -0.010252 -0.2643 0.7916 GVT_SUKUK_3-7Y-SILVER 0.000613 0.01683 0.9866 GVT_SUKUK_3-7Y-LEAD -0.007121 -0.1947 0.8457 GVT_SUKUK_3-7Y-GOLD 0.018818 0.5075 0.6119
564 International Journal of Economics, Management and Accounting 29, no. 2 (2021)
TABLE 18 (continued)
Coefficient t-
Statistic
p- Value GVT_SUKUK_3M-1Y-PLATINUM 0.018107 0.4847 0.6280 GVT_SUKUK_3M-1Y-COPPER 0.021017 0.6028 0.5468 GVT_SUKUK_3M-1Y-SILVER 0.053827* 1.479 0.1394 GVT_SUKUK_3M-1Y-LEAD -0.025589 -0.7870 0.4314 GVT_SUKUK_3M-1Y-GOLD 0.077693** 2.060 0.0397 GVT_SUKUK_7+Y-PLATINUM 0.009614 0.2502 0.8025 GVT_SUKUK_7+Y-COPPER 0.006457 0.1867 0.8519 GVT_SUKUK_7+Y-SILVER 0.013616 0.3820 0.7025 GVT_SUKUK_7+Y-LEAD 0.010917 0.3169 0.7513 GVT_SUKUK_7+Y-GOLD 0.020101 0.5637 0.5731 GVT_SUKUK-PLATINUM 0.020984 0.5598 0.5757 GVT_SUKUK-COPPER 0.016659 0.4825 0.6295 GVT_SUKUK-COPPER 0.051406* 1.394 0.1634 GVT_SUKUK-LEAD -0.025561 -0.7923 0.4283 GVT_SUKUK-GOLD 0.079539** 2.107 0.0353 LIQUID_GVT_SUKUK_5-
PLATINUM
0.018432 0.4450 0.6564 LIQUID_GVT_SUKUK_5-COPPER 0.013261 0.3573 0.7209 LIQUID_GVT_SUKUK_5-SILVER 0.012743 0.3240 0.7460 LIQUID_GVT_SUKUK_5-LEAD 0.004133 0.1223 0.9027 LIQUID_GVT_SUKUK_5-GOLD 0.035982 0.9216 0.3569 QUASI_GVT_SUKUK_3-7Y-
PLATINUM
-0.027038 -0.6765 0.4988 QUASI_GVT_SUKUK_3-7Y-
COPPER
0.017163 0.4425 0.6582 QUASI_GVT_SUKUK_3-7Y-
SILVER
0.017469 0.4602 0.6454 QUASI_GVT_SUKUK_3-7Y-LEAD 0.007425 0.2138 0.8307 QUASI_GVT_SUKUK_3-7Y-GOLD 0.021598 0.5745 0.5658 QUASI_GVT_SUKUK_7+Y-
PLATINUM
-0.068744* -1.725 0.0847 QUASI_GVT_SUKUK_7+Y-
COPPER
-0.039227* -1.120 0.2632 QUASI_GVT_SUKUK_7+Y-
SILVER
-0.056689* -1.547 0.1222 QUASI_GVT_SUKUK_7+Y-LEAD -0.019109 -0.5667 0.5710 QUASI_GVT_SUKUK_7+Y-GOLD -0.045430* -1.322 0.1865 Note: downloaded from Datastream Database
FIGURE 4
Dynamic Conditional Correlations of the Bivariate DCC-GARCH (1,1) Model
Islamic Equity Markets “Safe Havens”? Exploring the Contagion Effects…. 565
566 International Journal of Economics, Management and Accounting 29, no. 2 (2021)
4.2 ESTIMATES OF AVERAGE CORRELATIONS
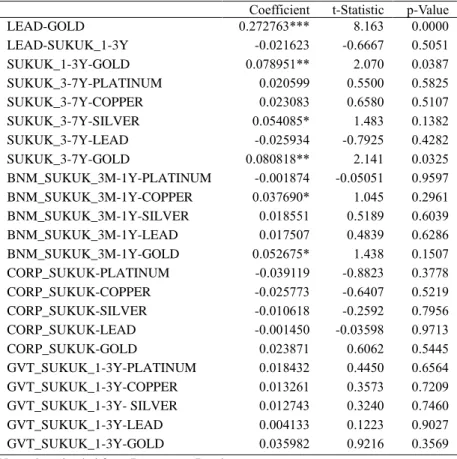
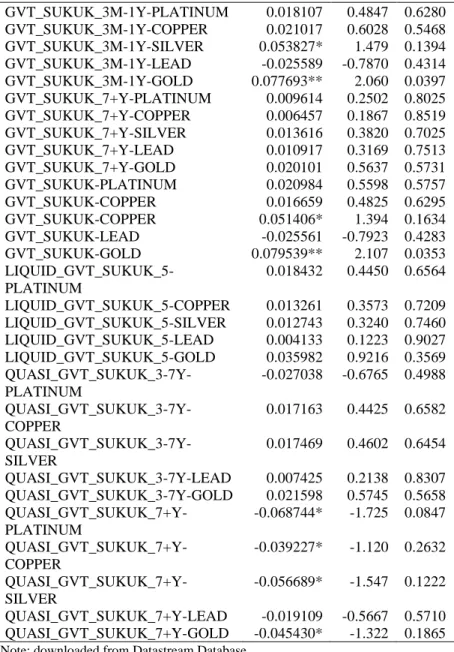
Tables 17 and 18 present the estimated average correlations of the sixvariate FIGARCH(1, d, 1)-DCC model. We observe that the most average correlations among metal futures markets are statistically significant and positive. In addition, results show that most average correlations among Islāmic bonds are not statistically significant.
4.3 ECONOMIC ANALYSIS OF DYNAMIC CONDITIONAL CORRELATION COEFFICIENTS
We proceed with the sixvariate FIGARCH(1, d, 1)-DCC estimation, using market logarithmic returns, illustrated graphically in Figure 4.
The dynamic conditional correlation coefficient (DCC coefficient) estimates aim to give us a much clearer view of contagion effects.
As depicted in Figure 4, all the DCC coefficients are positive in sub-periods and extreme volatile, implying contagion effects and a less reliable correlation in guiding portfolio decision. Additionally, some pairs of markets present positive and persistently high DCCs during the most period, foreshadowing interdependence phenomenon; see for instance, Forbes and Rigobon (2002), and specifically the pairs of metal futures markets: silver-gold, platinum- gold, platinum-silver, platinum-copper, copper-silver, copper-lead, platinum-lead, copper-gold and silver-gold. Furthermore, we can clearly see the effects of major economic events considering the picks and troughs in the figure, i.e. (1) the Lehman Brothers bankruptcy (15/9/2008), (2) the USA presidential election (4/11/2008), and (3) when Standard & Poor's credit rating agency downgraded the credit rating of the USA from AAA to AA+
(5/8/2011).
TABLE 19
Diagnostic Tests and Information Criteria PLATINUM-
COPPER- SILVER- LEAD- GOLD- SUKUK_1-
3Y
PLATINUM- COPPER- SILVER- LEAD- GOLD- SUKUK_3-
7Y
PLATINUM- COPPER- SILVER- LEAD-GOLD- BNM_SUKUK
_3M-1Y
x2(12) 3066,3** 3120,1** 5294,2**
p-Value 0,0000 0,0000 0,0000
TABLE 19 (continued) PLATINUM-
COPPER- SILVER- LEAD- GOLD- SUKUK_1-
3Y
PLATINUM- COPPER- SILVER- LEAD- GOLD- SUKUK_3-
7Y
PLATINUM- COPPER- SILVER- LEAD-GOLD- BNM_SUKUK
_3M-1Y Hosking2 (50) 1702.04 1686.18 1592.79 p-Value 0.9472115 0.9708656 0.9998077 Li-McLeod2 (50) 1707.87 1692.35 1599.96 p-Value 0.9354658 0.9629831 0.9996880 Akaike -49.106766 -49.085904 -52.363622 Schwarz -48.906766 -48.883250 -52.160968 Note: downloaded from Datastream Database
TABLE 20
Diagnostic Tests and Information Criteria PLATINUM
-COPPER- SILVER- LEAD- GOLD- CORP_SUK
UK
PLATINUM- COPPER- SILVER- LEAD-GOLD- GVT_SUKUK
_1-3Y
PLATINUM- COPPER- SILVER- LEAD- GOLD- GVT_SUKU
K_3-7Y x2(12) 4694.8** 3424.2** 3922.2**
p-Value 0.0000 0.0000 0.0000
Hosking2 (50) 1567.25 1690.46 1659.32 p-Value 0.9999703 0.9655565 0.9909520 Li-McLeod2 (50) 1576.29 1695.80 1666.48 p-Value 0.9999409 0.9578762 0.9873879 Akaike -49.852048 -49.191836 -50.007132 Schwarz -49.649394 -48.989182 -49.804478 Note: downloaded from Datastream Database
568 International Journal of Economics, Management and Accounting 29, no. 2 (2021)
TABLE 21
Diagnostic Tests and Information Criteria PLATINUM-
COPPER- SILVER- LEAD- GOLD- GVT_SUKU
K_3M-1Y
PLATINUM- COPPER- SILVER- LEAD- GOLD- GVT_SUKU
K_7+Y
PLATINUM- COPPER- SILVER- LEAD- GOLD- GVT_SUKU
K
x2(12) 3066.9** 3541.5** 3105.1**
p-Value 0.0000 0.0000 0.0000
Hosking2 (50) 1721.32 1696.05 1704.46 p-Value 0.9008017 0.9571641 0.9425610 Li-McLeod2 (50) 1726.72 1701.58 1710.23 p-Value 0.8836851 0.9480751 0.9301688 Akaike -49.099668 -49.932142 -49.082086 Schwarz -48.897014 -49.729488 -48.879432 Note: downloaded from Datastream Database
TABLE 22
Diagnostic Tests and Information Criteria PLATINUM-
COPPER- SILVER- LEAD- GOLD- LIQUID_GV T_SUKUK_5
PLATINUM- COPPER- SILVER- LEAD- GOLD- QUASI_GVT
_SUKUK_3- 7Y
PLATINUM- COPPER- SILVER- LEAD- GOLD- QUASI_GVT
_SUKUK_7+
Y
x2(12) 3424.2** 5957.0** 4688.5**
p-Value 0.0000 0.0000 0.0000
Hosking2 (50) 1690.46 1640.71 1771.38 p-Value 0.9655565 0.9964536 0.6681947 Li-McLeod2 (50) 1695.80 1647.39 1775.12 p-Value 0.9578762 0.9949764 0.6450560 Akaike -49.191836 -49.712425 -48.322963 Schwarz -48.989182 -49.509771 -48.120310 Note: downloaded from Datastream Database
4.4 DIAGNOSTIC TESTS, HYPOTHESIS TESTING AND INFORMATION CRITERIA
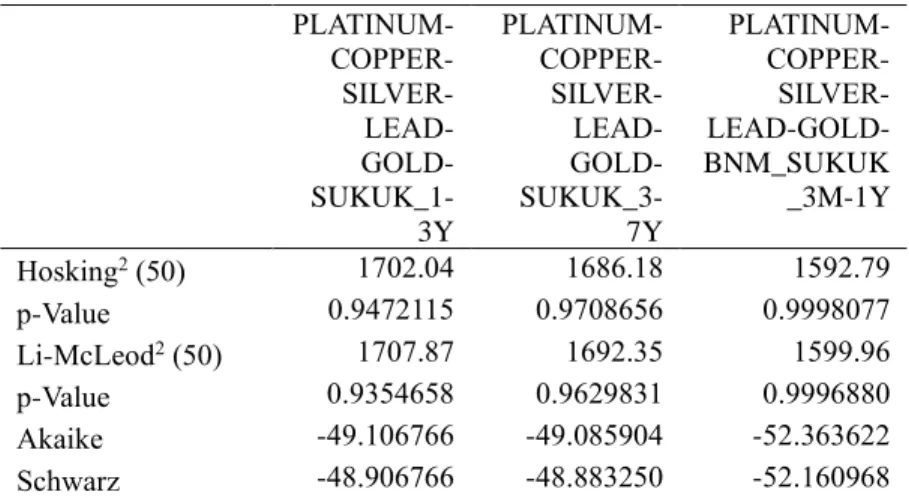
Ηypothesis testing results and information criteria are exhibited in Tables 19 to 22, 𝑥2(12) statistic results suggest that the null hypothesis of no spillovers is rejected at the 1% significance level. In addition, Ljuing-Box test results (Hosking 1980; McLeod and Li 1983) provide evidence of no serial autocorrelation, suggesting the absence of misspecification errors of the estimated MGARCH model. Furthermore, AIC and SIC information criteria are provided for our model.
5. CONCLUSIONS
In this article, we study the volatility transmission among metal futures markets and Malaysian Islāmic bonds using daily data for the period 2007 – 2011. We apply twelve sixvariate DCC-FIGARCH(1, d, 1) framework. To the best of our knowledge no empirical study has attempted to analyze the volatility effects among the under investigation metal futures markets and sukūk bonds in order to quantify and measure potential contagion effects. The empirical results answer the major research questions.
Using the FIGARCH-DCC model, we find evidence of significant and extremely volatile dynamic conditional correlations for all the pairs of markets. More importantly, we find positive and negative correlation in sub-periods, supporting that the investors (Pension funds, hedge funds and insurance companies) dealing can get diversification benefits and face non-important losses during bearish times. Contagion during bearish time-periods of the recent global financial crisis of 2008 shows that sukūk markets are not a safe haven without diversification strategies from the futures metal markets.
Policy makers, who provide regulations for the metal futures markets, should examine possible strategies that take into account the spillovers of the above markets during future crises. By examining the evolution of dynamic conditional correlations, we conclude that it is safe to hold portfolio in Malaysian Islāmic bonds and metal futures markets, showing that the Islāmic bond markets are safe havens during a major global crisis.
570 International Journal of Economics, Management and Accounting 29, no. 2 (2021)
REFERENCES
Abdullah, A.M., B. Saiti, and M. Masih. “The impact of Crude Oil Price on Islamic Stock Indices of South East Asian countries:
Evidence from MGARCH-DCC and Wavelet Approaches.”
Borsa Istanbul Review 16 (2016): 219-32.
Ahmed, M. Z., and A.H. Elsayed. “Are Islamic and Conventional Capital Markets Decoupled? Evidence from Stock and Bonds/Sukuk Markets in Malaysia.” The Quarterly Review of Economics and Finance 74 (2019): 56-66.
Aloui, C., S. Hammoudeh, and H.B. Hamida. “Co-movement between Sharia Stocks and Sukuk in the GCC markets: A Time-frequency Analysis. “Journal of International Financial Markets, Institutions & Money 34 (2015): 69-79.
Andersson, M., E. Krylova, and S. Vähämaa. “Why Does the Correlation between Stock and Bond Returns Vary Over Time?” Applied Financial Economics 18 (2008): 139-51.
Baillie, R.T., T. Bollerslev, and H.O. Mikkelsen. “Fractionally Integrated Generalized Autoregressive Conditional Heteroskedasticity.” Journal of Econometrics 74, no. 1 (1996): 3-30.
Dickey, D.A., and W.A. Fuller. “Distribution of the Estimators for Autoregressive Time Series with a Unit Root.” Journal of the American Statistical Association 74 (1979): 427-31.
Engle, R.F. “Dynamic Conditional Correlation: A Simple Cl