The other parameters were compared with the water quality index and it showed that UTAR Kampar lake was classified as class III (moderate). NAHRIM National Hydraulic Research Institute of Malaysia NLWQCS National Lake Water Quality Criteria and Standards NRE Ministry of Natural Resource and Environment NWQI National Water Quality Index.
General Introduction
Problem Statement
Aim and Objective
Scope of Study
The parameters used to indicate and compare the trophic state and water quality of UTAR Kampar Lake using Carlson's Trophic State Index (CTSI) and Water Quality Index for Malaysia (WQI).
Introduction of Eutrophication
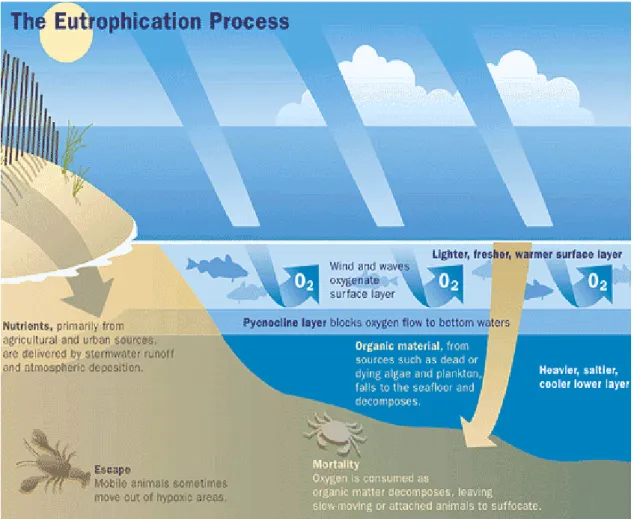
Eutrophication Cycle
Algae and cyanobacteria share a common similarity, the process of oxygenic photosynthesis used by plants and both can be found in fresh and salt water (Saad and Atia, 2014). Since algae and cyanobacteria float on the surface of the water, sunlight reaches them before aquatic plants result.
Freshwater and Coastal Marine Ecosystems
Main Cause of Eutrophication
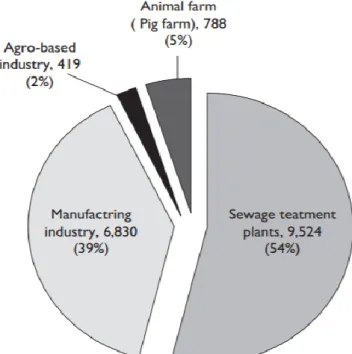
In Malaysia, the three main sources of water pollution were sewage, agriculture and industrial waste (Afroz et al., 2014). The sources of water pollution can be classified into non-point source and point source.
Effect of Eutrophication
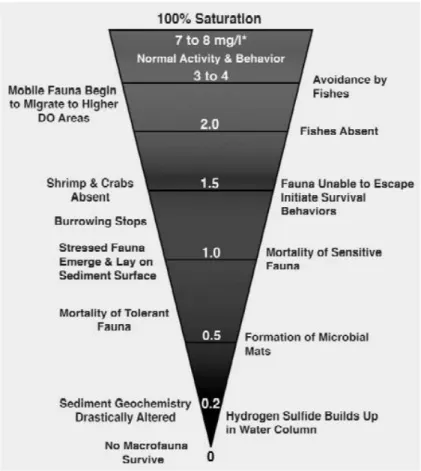
Ecology and Environment Impact
Hypoxia becomes detrimental to aquatic animals when physiological and behavioral responses change behavior such as reduced reproductive rate, stress and loss of biodiversity as shown in Figure 2.3 (Diaz, 2010). At the lowest level of DO at 0.2 mg/L, hydrogen sulfide (H2S) will be produced by sulfate reduction bacteria – Smell of rotten eggs, harmful to the sea and could activate phosphorus release from sediment (Henny and Nomosatryo, 2016) .
Human Impact
Socio-economic Impact
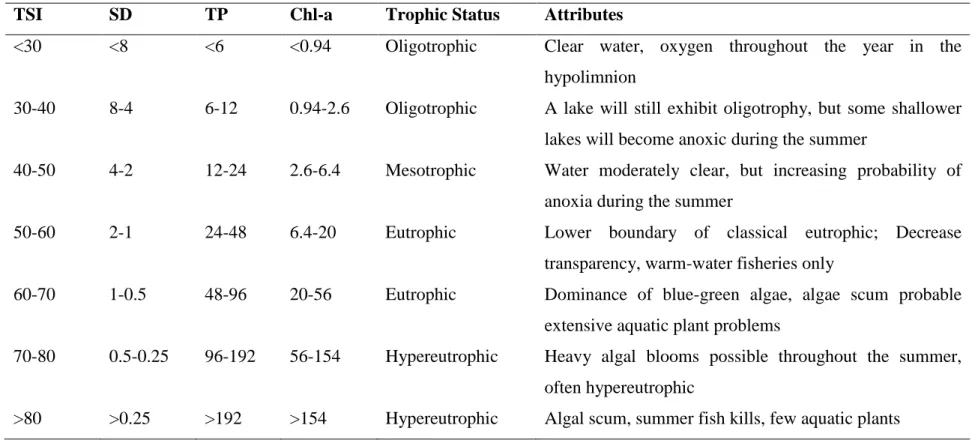
Tropic State Index
Carlson’s Trophic State Index
Algal biomass and nutrient load can be the basic and simple measurements of any trophic category to determine trophic status. New trophic index (TRIX) developed by Vollenweider (1998) to characterize the trophic status of a water body, based on chlorophyll-a, oxygen saturation, nutrients such as total phosphorus (TP) and total nitrogen (TN). TRIX included a turbidity index (TRBIX), both TRIX and TRBIX served as a complementary water quality index (Vollenweider et al showed that the TRIX equation.
The new trophic index (TRIX) has trophic levels where less than 4 is considered low trophic level, ranges from 4 to 5 moderate trophic level, 5 to 6 high trophic level, and more than 6 very high trophic level (high nutrient content, low transparency, and hypoxia bottom of the water). In addition, the turbidity index calculated as the log to the base two of TRBR shown in Eq.
Eutrophication Index
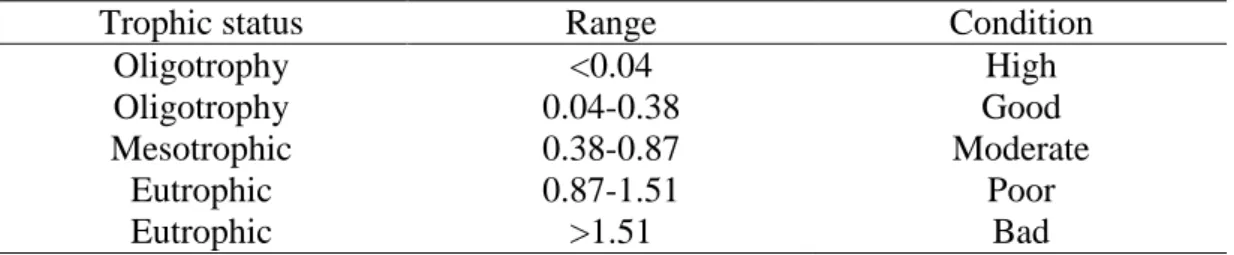
Turbidity/chlorophyll-a ratio can be defined as the ratio between the potential (p) and actual (a) transparency as shown in Eq. 𝐶𝑃𝑂4 = concentration of phosphate (mg/m3) 𝐶𝑁𝑂3 = concentration of nitrate (mg/m3) 𝐶𝑁𝑂2 = concentration of nitrite (mg/m3) 𝐶𝑁𝐶um3 (concentration of 𝐶m3) 𝑙−𝑎 = concentration of phytoplankton (mg/m3). Regarding chlorophyll, a with the average value of and 1.43 mg/L can be characterized as Good, Moderate and Poor water quality respectively.
Study of Eutrophication
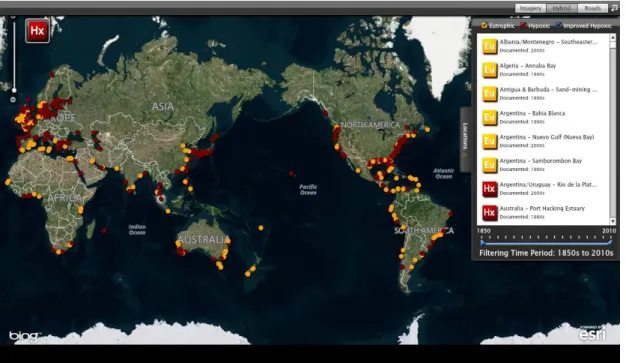
Global Studies
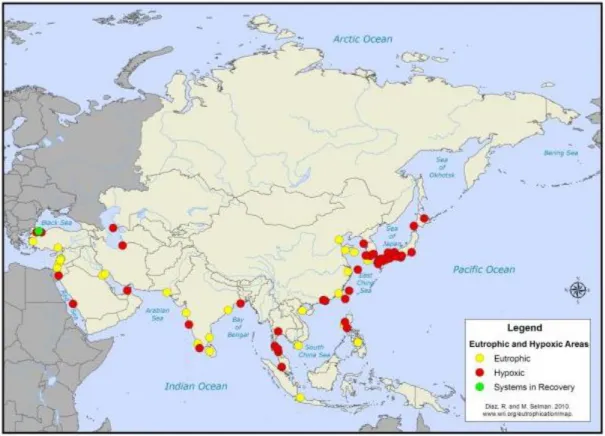
The Figure 2.6 showed that the red dots indicate hypoxia - less or no DO in the water body while yellow dots represent eutrophication, symptom of hypoxia. During the 1850s to 1950s, about 20 cases of hypoxia and eutrophication were reported, mostly in America, Europe and Australia. Tracadie and Winter Bays, Canada were located on Prince Edward Island, extensive fish farming takes place in the areas and has caused hypoxia in the bays.
The lake received a large amount of nutrients from agriculture, which caused algal blooms in the summer. This lake has reported eutrophication and oxygen depletion, which is responsible for the death of fisheries.
Asia
In this case, BOD correlated negatively with ammonia and water temperature, and the condition of this lake was reported as hypoxia. About 240 square kilometers were affected by seasonal hypoxia due to construction to the agricultural land prevents flooding. Dike – a kind of dam causes the weakening of the current in the Ariake Sea, which leads to nutrient loading and increase in toxic algal blooms and hypoxia conditions.
It reported that it was hypoxia due to agricultural industry and population growth at upstream Pearl River Estuary contained a high concentration of nitrate to phosphate ratio of 200:1 in the surface layer, with a rapid increase in harmful algal blooms (Dong et al. , 2006). The river basin is affected by the increase in population and agricultural crop production which has caused a nutrient runoff for the last few decades.
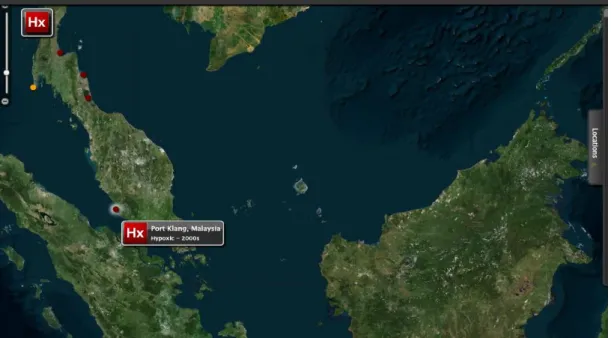
Malaysia
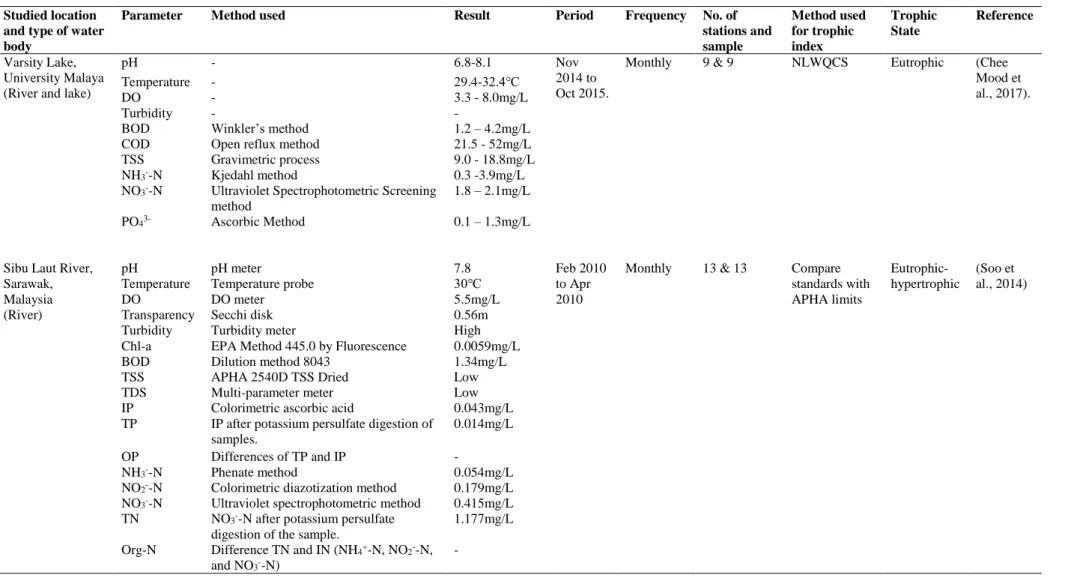
Table 2.4 showed that all the cases were related to the water body in the river or lake with the exception of the Port Klang case. The sampling method focused on eutrophication survey with 13 stations and water sampling (monthly) in the middle of the river with approx. 1 m below the water surface. Among the 13 stations, only one of the station readings has taken as the following content because the specific station suffered from eutrophication.
In the laboratory, the TSS method was the difference between the initial and final weight of the filter paper (0.7 μm Whatman GF/F), after filtering the sample volume and drying in an oven at 105. The oldest man-made Bukit Merah Reservoir (BMR) The lake in Malaysia, located in Perak, the main purpose of the reservoir was to provide water supply and agriculture, such as the palm oil industry and the breeding agriculture industry.
Summary
NO2--N Colorimetric diazotization method 0.179mg/L NO3--N Ultraviolet spectrophotometric method 0.415mg/L TN NO3--N after potassium persulfate. In Section 3.1, the background of sampling location, water sample collection procedure and in-situ test measurements will be discussed.
Study Area
Sampling Location
At site 4, Student Pavilion 1 (cafeteria) has a wastewater treatment plant, which discharges the treated water into lake 18. The main purpose is to select site 1 because of the good distribution of the site selection point and getting more data.
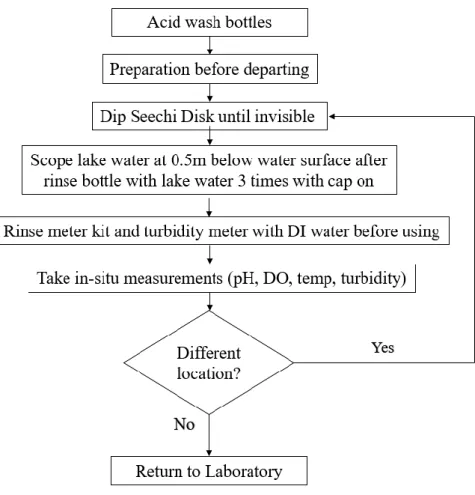
Sampling Method
Before the water was collected by an employee of the General Services Department, the polyethylene bottle was rinsed 3 times with the lake water with the cap on before the water sample was taken, then the lake water was scooped about 0.5 m below the water surface to the shoulder of the bottle. The water sample was run for parameter measurements using HI-98703 portable turbidity meter and PCD650 meter kit to obtain dissolved oxygen (DO), pH and water temperature. The water bottle was immediately labeled and the water sample was kept in the cooler box to slow down the chemical reaction, no need for preservation as long as it is kept in the cooler box or refrigerator at 4℃ until analysis for several weeks (Rice et al., 2017).
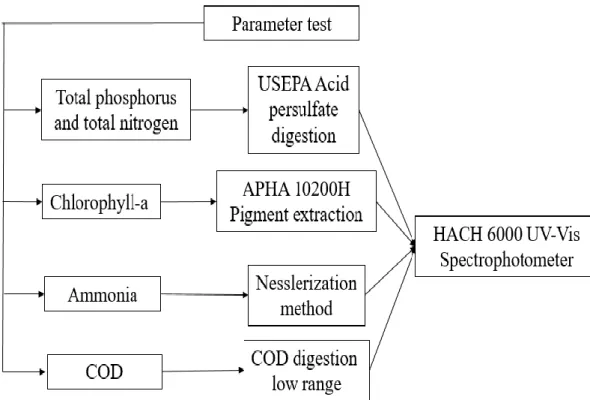
Parameters test
Chemicals and Reagents
Equipment and Apparatus
Analytical Procedure
- Digestion of Total Phosphorus and Total Nitrogen
- Total Phosphorus
- Chlorophyll-a
- Ammonia
- Total Nitrogen
- Chemical Oxygen Demand
- Quality Assurance and Quality Control
25 ml of sample was added to a conical flask and one packet of potassium persulfate powder cushion was added. Next, 2 ml of 5.25 N Sulfuric acid was added to the solution and the cell was rotated to mix. 10 ml digested solution and one PhosVer 3 Phosphate reagent powder pad were poured into a sample cell.
The concentrated algae were transferred to the mortar and ground manually by adding 2 to 3 ml of aqueous acetone solution. One NitraVer Nitrate 5 Reagent powder pad and 10 ml of the digested sample were poured into a sample cell.
Selection of Trophic State Index
Throughout the procedure, the glassware was acid washed with one drop of concentrated sulfuric acid with distilled water. The PCD650 meter kit sensor and turbidity meter were rinsed with distilled water after each use. Finally, the sample cells were washed well with distilled water because the residue from previous use remains on the soil surface, which may affect the results, especially TP and TN.
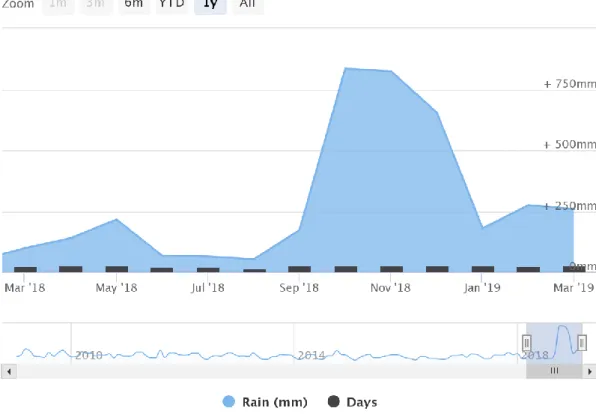
The overview results, general information such as water sampling period and monthly precipitation amount are discussed in section 4.1. The trophic state index will be discussed in section 4.2 to determine lake productivity with the parameters of Carlson's Trophic State Index (CTSI) and compared to National Lake Water Quality Criteria and Standards (NLWQCS).
Overview results
All the water samples were taken at the beginning of the month during sunny day after 10:00 am. except for February 2019 and March 2019 taken on a cloudy day. All the parameters were tested within a few days and the results were discussed in the following respective topics. The parameters involved in CTSI were compared with National Lake Water Quality Criteria and Standards (NLWQCS) by National Hydraulic Research Institute of Malaysia (NAHRIM) and re (NRE).
The main reason for using two different standards to compare is because the NLWQCS indicates lake productivity and condition with Carlson's parameters and total nitrogen. Meanwhile, the other water parameters were compared with the WQI to indicate the quality standard of the water supply.
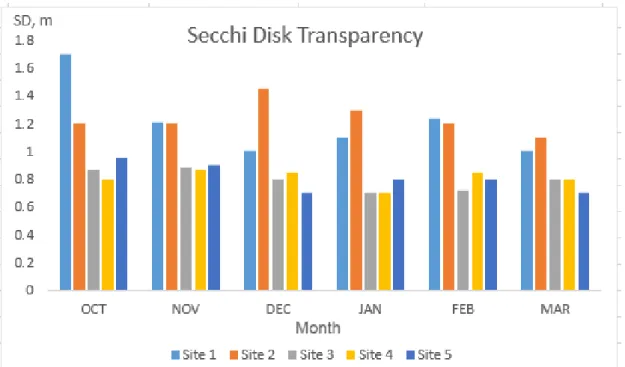
Trophic State Index
- Secchi Disk Transparency
- Total Phosphorus
- Total Nitrogen
- Chlorophyll-a
- Carlson’s Trophic State Index
- National Lake Water Quality Criteria and Standards
The lake has greater TP concentration due to accumulation of fine particles rich in organic matter and phosphorus (Clarke, 2002). Site 2 has the lowest concentration throughout the month because it is in the center of the lake. The average TSI value was justified using Table 2.1 to identify lake status.
This indicated that the discharge from the cafe at site 4 may have contributed the most to eutrophication of the lake. In summary, Lake UTAR Kampar suffered from nutrient pollution resulting in eutrophication and categories as Category D, which the lake managed to minimally maintain good aquatic life in the lake.
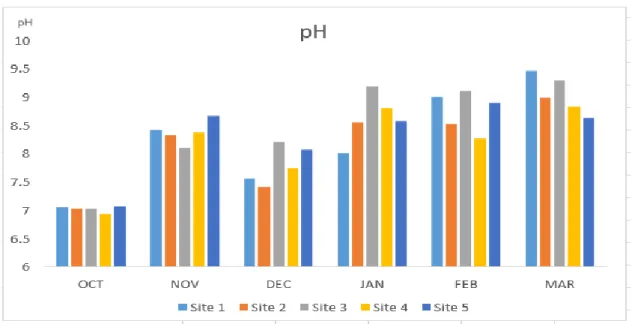
Other Water Quality Parameters
- Temperature and Dissolved Oxygen
- Turbidity
- Ammonia
- Chemical Oxygen Demand
- Water Quality Index
The NLWQCS chlorophyll-a limit for Category D was 25 µg/L as sites 3, 4, and 5 exceeded, while sites 1 and 2 were slightly below the limit. Those cases with pH 8 and slightly identical to the scenario of UTAR Kampar lake with high photosynthetic activity by algae. Low turbidity was predicted at sites 1 and 2 due to the lack of inlet and outlet discharge points.
All the months mentioned above were the lowest concentration for TN (Figure 4.4), the relationship between ammonia and TN was rapidly reduced nitrate in organic compounds within organisms and produced high concentration of ammonia (Quirós, 2003). The COD value was obtained to further understand and provide more information about the situation of UTAR Kampar Lake.
Chapter Conclusion
Lake UTAR Kampar was classified as Class III (Medium purity) where the necessary water supply passed through the advanced treatment system, fisheries with shared economic value and tolerant species and water suitable for livestock drinking.
Conclusions
Recommendations
Effectiveness of Lake Restoration for Water Quality: Application in Varsity Lake, University of Malaya, Kuala Lumpur. Available at:
Available at: