A Study on the Effect of Calcium Composition at Magnesium Alloy Degradation Rate
by
Nurhidayah Binti Jamalulail 13637
Dissertation submitted in partial fulfillment of the requirement for the Bachelor of Engineering (Hons)
(Chemical Engineering)
DISSERTATION FINAL YEAR PROJECT II
MAY 2014
Universiti Teknologi PETRONAS Bandar Sri Iskandar
31750 Tronoh Perak Darul Ridzuan
i
CERTIFICATION
CERTIFICATION OF APPROVAL
A Study on the Effect of Calcium Composition at Magnesium Alloy Degradation Rate by
Nurhidayah Binti Jamalulail 13637
A project dissertation submitted to the Chemical Engineering Programme Universiti Teknologi PETRONAS in partial fulfilment of the requirement for the
BACHELOR OF ENGINEERING (Hons) (CHEMICAL)
Approved by, _____________________
(Supervisor : Dr Anis Suhaila Binti Shuib) (Co-Supervisor : Dr. Bambang Ari-Wahjoedi)
UNIVERSITI TEKNOLOGI PETRONAS Bandar Sri Iskandar
31750 Tronoh Perak Darul Ridzuan
May 2014
ii
CERTIFICATION OF ORIGINALITY
This is to certify that I am responsible for the work submitted in this project, that the original work is my own except as specified in the references and acknowledgements,
and that the original work contained herein have not been undertaken or done by unspecified sources or persons.
_________________________________
NURHIDAYAH BINTI JAMALULAIL
iii
ABSTRACT
Recently, magnesium and its alloys have been recognized as a suitable degradable biomaterial. The degradability of magnesium alloy is one of the important contribution aspects in medical devices applications. It has natural ability to degrade due to corrosion when it is placed in aqueous solutions. Degradable magnesium alloy is one of the most practical medical devices that adopting this application concept. This report investigated the importance of magnesium alloy degradation in human body. Calcium composition was varied to change the degradation time for each sample. Longer degradation time is desirable for the application as stent method in stroke treatment. Several calcium compositions between 0 to 2 wt% are used to produce Mg-Zn-Ca alloy. Method of alloy fabrication, corrosion test technique and surface morphology analysis of magnesium alloy is presented in this report. The result obtained from this research is Mg-Zn- 1wt%Ca having the lowest corrosion rate of 1.87 mm/year as compared to Mg-Zn- 0wt%Ca and Mg-Zn-2wt%Ca which having corrosion rate of 2.12 mm/year and 3.56 mm/year respectively. Thus, Mg-Zn-1wt%Ca can be implemented as degradable implant as it has high corrosion resistance among other tested samples.
iv
ACKNOWLEDGEMENT
First and foremost, all praise to our Creator for giving me an opportunity to complete my Final Year Project I and II up till this stage. I take this opportunity to express my sincere gratitude to all those assisted and supported me throughout two semesters of FYP. I would like to extend a thousand thanks to Dr. Anis Suhaila Binti Shuib for her continuous support, guidance and mentorship as my supervisor. This project is a tribute to her priceless assistance and supervision. A special gratitude I give to Dr. Bambang Ariwahjoedi, co-supervisor, for investing his time and space in supervising me. Without their supervision and constant help this task would not have been possible. Furthermore, I would like to acknowledge my indebtedness to Mr. Kusniar Deny Permana, PhD student that helping me getting the information for this project. In addition, thank you to all staff for helping and providing me recommendations and suggestions project. Last but not least, I would like express the deepest appreciation to my parents for their support.
v
TABLE OF CONTENTS
CERTIFICATION ... i
ABSTRACT ... iii
ACKNOWLEDGEMENT ... iv
LIST OF FIGURES ... vii
LIST OF TABLES ... vii
ABBREVIATIONS AND NOMENCLATURES ... viii
CHAPTER 1 ...1
INTRODUCTION ...1
1.1 Background of study ...1
1.2 Objectives ...4
1.3 Scope of study ...4
1.4 Problem statement ...5
CHAPTER 2 ...6
LITERATURE REVIEW ...6
2.1 Rational and history ...6
2.2 Magnesium as biomaterial ...6
2.3 Mechanism of alloy corrosion ...8
2.4 Alloying element...9
2.5 Degradation of magnesium ... 10
2.6 Mg-Ca-Zn ternary system alloys ... 11
2.7 Mg-Ca binary system alloys ... 12
2.8 Microstructure of magnesium alloys ... 13
CHAPTER 3 ... 14
METHODOLOGY ... 14
3.1 Research methodology ... 14
3.2 Study plan (Gantt-Chart) ... 25
3.3 Key milestone ... 26
CHAPTER 4 ... 27
RESULTS AND DISCUSSION ... 27
4.1 Alloy fabrication ... 27
4.2 Corrosion rate ... 28
vi
4.3 Scanning Electron Microscopy (SEM) and Energy Dispersed X-Ray (EDX) analysis ... 30
CHAPTER 5 ... 36
CONCLUSION AND RECOMMENDATION ... 36
5.1 Conclusion ... 36
5.2 Recommendation ... 38
REFERENCE ... 39
APPENDICES ... 42
vii
LIST OF FIGURES
Figure 1: Stent placement procedure ...1
Figure 2: Stent structure ...2
Figure 3: Stent implant ...3
Figure 4: Gradual loss of mechanical property of biodegradable implant ...7
Figure 5: Mechanism of alloy corrosion ...8
Figure 6: Optical micrographs a) pure mg b) Mg-0.5Ca c) Mg-1.25Ca d) Mg-2.5Ca e) Mg-5Ca f) Mg-10Ca (He et al., 2011) ... 13
Figure 7: Research methodology ... 14
Figure 8 : Tube furnace ... 15
Figure 9 : Heating sequence ... 16
Figure 10 : Immersion test setup ... 17
Figure 11 : Hot Mounting Machine ... 22
Figure 12 : First trial Mg-Zn-1wt%Ca ... 27
Figure 13 : Second trial Mg-Zn-1wt%Ca ... 27
Figure 14 : Corrosion Rate Based on Difference in Calcium Composition ... 28
Figure 15 : Magnesium alloy samples ready for SEM and EDX analysis ... 30
Figure 16 : SEM and EDX ... 31
LIST OF TABLES
Table 1: Materials for degradable stent (Dharam & Anthony, 2012) ...3Table 2: Influence of alloying elements on the properties of magnesium alloys (Nowosielski et al., 2013) ... 11
Table 3 : Comparison of corrosion rate for Mg-Ca alloy (Reza et al., 2012) ... 12
Table 4: Composition of Alloys ... 15
Table 5 : Melting Point ... 17
Table 6: SBF Chemical Composition ... 18
Table 7 : Weight Loss Measurement ... 19
Table 8 : Chemical etchants ... 24
Table 9: Gantt Chart ... 25
Table 10 : Details on key milestone ... 26
Table 11: Corrosion Rate ... 28
Table 12: Summary of Pathophysiology and Toxicology of Magnesium and Some Alloying Elements (Xue & Yu, 2010) ... 42
Table 13: Electrode Potential ... 42
Table 14 : Corrosion rate of selected magnesium alloy ... 44
viii
ABBREVIATIONS AND NOMENCLATURES
EDX – Energy dispersed x-ray
EIS – Electron impedence spectroscopy LPR – Linear polarization resistance SBF – Simulated body fluid
SEM – Scanning electron microscopy SiC – Silicon carbide
1
CHAPTER 1
INTRODUCTION
1.1 Background of study
Stroke is one of the leading causes of death in the world. Each year, about 800,000 people in the United State have a stroke(Allan et al., 2013). Stroke is the disturbance in the blood supply to the brain that can cause brain malfunction. The blockage in the blood arteries will restrain the blood flow to the brain (Sims & Muyderman, 2009).This might result in inability to move, understand, see or speaking due to the affected area of the brain that cannot function (Donnan et al., 2008). Fatty material or plaque deposition might partly or totally block the blood flow in the blood arteries called carotid arteries.
One of the invasive methods to treat and open up the blocked or narrowed arteries is stent placement (Dugdale, 2012).
Stent placement involves balloon angioplasty procedure as a method to treat the arteries.
A balloon along with expandable metallic stent inside it is inserted into the narrowed arteries. First, the stent is in a compressed form in the balloon and placed at the tip of a catheter. This assembly is then guided to the target artery. The stent is expanded as the balloon inflates. Once in place, the balloon is the deflated and removed, the stent will remain in the artery which acts as a support (Healthwise, 2013).
Figure 1: Stent placement procedure
2
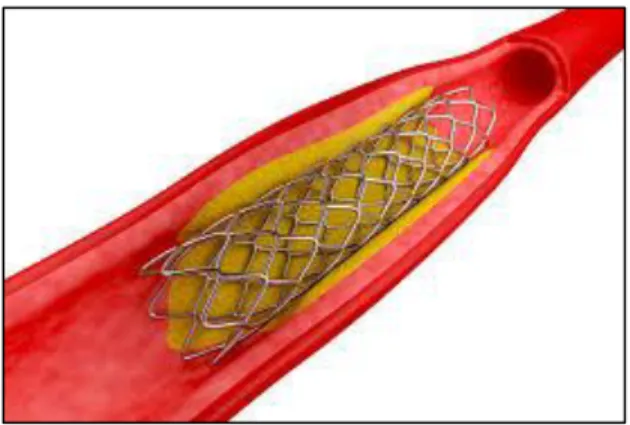
Stent is a tiny wire mesh tube supportive structure that is placed inside the arteries. It can treat narrow and weak arteries by keeping the lumen open, thus improve the blood flow.
A stent helps to support the inner wall of the arteries and expected to last for 6 to 12 months during arterial healing and remodeling. Placement of stent may help to decrease the chance of the arteries from narrowing again (Maryam & Diego, 2011). Stents are intended to perform clinically with appropriate host response. The properties required for degradable implants are high mechanical support, matching degradation rate, good biocompatibilities and biosafe (Rad et al., 2012). Biocompatibility is the acceptance by the surrounding tissues or host body of an artificial implant.
Figure 2: Stent structure
The idea of degradable stent provides most practical medical application. Degradable can be defined as a process of breaking-up the material by action of natural forces. The concept of degradable stent can be in two terms: a) no foreign products from degradation process remain in the host body; b) stent prevents the vessel from recoiling for at least 6 to 9 months(Shalaby et al., 2012).
Previously, stents is applied by using corrosion-resistant metals. Thus, that will result in additional risk and operation cost for patients (Guang-Ling, 2011). The application of temporary medical implants will prevent the need for further operation by the host to remove the stent as compared to corrosion resistant metal used for permanent stent application. Bioabsorption process of degradable metallic stent is taken place in the affected area until complete healing.
3
Figure 3: Stent implant
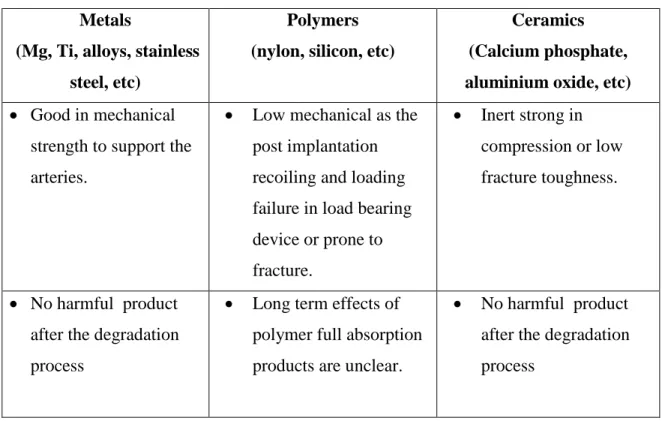
Metals, polymers and ceramics can be used as the material for stent. Stents which is made from metallic materials have the potential to be an ideal stent (Julie, 2014). The interventional cardiologists prefer to use metallic stent (Chris, 2013). The following table shows the pros and cons for each material.
Table 1: Materials for degradable stent (Dharam & Anthony, 2012) Metals
(Mg, Ti, alloys, stainless steel, etc)
Polymers (nylon, silicon, etc)
Ceramics (Calcium phosphate, aluminium oxide, etc)
Good in mechanical strength to support the arteries.
Low mechanical as the post implantation recoiling and loading failure in load bearing device or prone to fracture.
Inert strong in compression or low fracture toughness.
No harmful product after the degradation process
Long term effects of polymer full absorption products are unclear.
No harmful product after the degradation process
4
1.2 Objectives
The objectives of this study are:
1. To develop magnesium alloy (Mg-Zn-1wt%Ca , Mg-Zn-2wt%Ca , Mg-Zn- 0wt%Ca)
2. To investigate the effects of calcium composition variation in magnesium alloy on the degradation rate through corrosion resistance measured.
3. To analyze the surface morphologies of magnesium alloy
1.3 Scope of study
The overall scope of this study is to analyze the impact of variation of calcium composition in ternary magnesium based alloys which is Mg-Zn-Ca system. The degradability will be determined by the corrosion resistance of the alloys. This study will present alloys fabrication, corrosion test, elemental analysis and microstructure characterization of the magnesium alloys. The analysis will be conducted through experiments.
5
1.4 Problem statement
The vital performance for degradable materials is the degradation rate. The application of degradable stent from magnesium alloys is having a too rapid corrosion or degradation rate which is within 3 to 6 months in human body environment. The degradable magnesium alloy stent is recommended after modification to last for 6 to 12 months for complete healing process. Thus, the key issue of Mg-Zn-Ca alloy is the fast corrosion rate in human body environment.
Variations of calcium composition in magnesium alloy could affect the degradation rate.
Through the experiment conducted, the right composition of calcium could be determined for certain sample that having slower degradation rate or higher corrosion resistance. In addition, the effects on microstructure of the alloys also can be determined.
6
CHAPTER 2
LITERATURE REVIEW
2.1 Rational and history
Safer and better medical procedures and outcomes can be achieved after recent design improvements for artery stenting. Complication rates for patients were dropping during and after the treatment with stents and the results were consistent. This will provide the great outcomes for high-risk patient that suffering arterial related diseases (William et al., 2012).
Initially, stainless steel (bare metal) or cobalt chrome alloy has been used widely as the stent to open up and treat the narrowed arterial vessels. The stents are placed permanently in the host body even the patient has completed the healing process. This will cause some implications to occur towards host body (Joner et al., 2006). Besides, there are limited treatment options and have to wait for a quite some time for the outcomes (William et al., 2012).
2.2 Magnesium as biomaterial
Magnesium represents a promising candidate for degradable stents and attracted good attention as degradable materials. Magnesium alloys have good mechanical properties and biocompatibility.(Dharam & Anthony, 2012). Good mechanical properties of magnesium alloys can be characterized in terms of having an optimum tensile strength to withstand the maximum stress while being pulled or stretched before breaking. Good biocompatibility here means that the coexistence of magnesium alloy with living tissues provide no harm to the host body. Magnesium is one of the essential cation in the human body. It is about 25g of magnesium circulated in human body (Xue-Nan & Yu-Feng, 2010). Standard electrode potential for magnesium is -2.37. While, human body fluid is
7
mainly contain of chloride ion. Magnesium will act as an anode (more electronegative) while chloride ion as a cathode (more electropositive). Thus, magnesium will exhibit poor corrosion resistance in the presence of chloride ion (Tullmin, 2004). Their rapid corrosion rate is the advantage for developing a biodegradable metal (Xue-Nan & Yu- Feng, 2010). Therefore, magnesium alloy is the potential candidate for degradable material. Then, its mechanical properties will be loss throughout the healing period during degradation. The following profile illustrates the degradation of the magnesium alloy in body environment (Guang-Ling, 2011).
Figure 4: Gradual loss of mechanical property of biodegradable implant
The introduction of biodegradable stent can effectively provide short-term treatment for the arteries. Biodegradable stents should have the following properties:
a) Biodegradability-The stent working duration is expected to be for 6 to 12 months b) Biocompatibility and biosafety- No harmful yield materials, toxicity and inflammatory response to the host body should be considered since the entire element will enter the human body
c) Mechanical strength- It has to be greater than 300MPa
d) Elongation- Should be more than 15 to 18% (Werkhoven et al., 2011)
Healing
Sten t
8
2.3 Mechanism of alloy corrosion
Figure 5: Mechanism of alloy corrosion
First, the magnesium alloy is exposed or immersed in the body fluid environment.
Sometimes, term in vivo is used to represent the process that occurring within a natural setting. Body fluid environment has two characteristics; a) contains chloride ions b) pH of 7.4. For experimental work, simulated body fluid (SBF) is prepared to be the body fluid environment (Yu et al., 2012).
The oxidation of magnesium will occur after reaction with water then convert magnesium into magnesium ion. A protective layer of MgOH2 is formed. The MgOH2 cannot be stable. Then it will dissolve in body fluid to produce magnesium ions and hydroxyl ion. Magnesium ion will then combine with chloride ion to form soluble MgCl2. This will make the magnesium alloy expose to the body fluid environment. The cycle will keep repeating until the alloy become exhausted (Xue- Nan & Yu-Feng, 2010).
9
2.4 Alloying element
Alloying elements selection is critical in designing biocompatible implant material.
The chance of toxicity can be greatly reduced by using the materials that are essential to the human body. Different alloying elements contain in magnesium alloys will exhibit different degradation rate (Meisam & Yuebin, 2012). Both zinc and calcium can improve the values in magnesium based alloys.
The corrosion resistance of magnesium based alloys in human body environment can be improved with the addition of zinc. Zinc is nobler than magnesium based on galvanic series. That is why zinc can improve the corrosion resistance. It has been reported that zinc can also elevate the charge transfer resistance of magnesium and thus reduce the corrosion rate.(Yu et al., 2012) Based on the recent studies of Mg- Zn-Ca systems, the mechanical properties of the alloy can be improved with increasing amount of zinc (Yu et al., 2012).
The addition of a small amount of calcium has two distinct effects on magnesium alloys. First, it decreases the corrosion resistance and second, it minimizes the grain growth and leads to smaller grains. Based on Mg-Ca binary system, with the increasing amount of calcium in the alloys, the magnitude of corrosion becomes higher. The decrease in corrosion resistance was due to high concentration of Mg2Ca intermetallic phase formed in grain boundaries. The investigation is conducted with different contents of calcium. The corrosion rate increased with increasing calcium content and corrosion potential become more negative(Yu et al., 2012). Thus, a potentially magnesium based alloys can be designed and use for degradable and bioabsorbable implants (Brar et al., 2009).
10
2.5 Degradation of magnesium
Magnesium alloys are known to degrade in vivo. Electrochemical reactions are taken place during the process which yields hydrogen gas and magnesium hydroxide evolution (Guang-Ling, 2011). From the equations, it can be seen that magnesium reactions with aqueous solutions produce hydrogen gas. This could potentially form harmful hydrogen pockets. Zn addition to the alloy can reduce the amount of hydrogen gas formed (Guang-Ling, 2011). The following are the net reaction from half-cell reactions of magnesium alloys corrosion in aqueous environments:
Net reaction
Mg (s) + 2H2O (aq) Mg(OH)2 (s) + H2 (g)
Half-cell reaction
Mg (s) Mg 2+ (aq) +2e- (oxidation)
2H2O (aq) +2e- H2 (g) +2OH- (aq) (reduction)
Mg2+ (aq) + 2OH- (aq) Mg(OH)2 (s) (byproduct formation)
Addition of zinc to the alloy can displace hydrogen ions Zn (s) + 2H2O (aq) Mg(OH)2 (s) + H2 (g)
Zn (s) Zn 2+ (aq) +2e- (oxidation) Magnesium can remove zinc ions
Mg (s) + Zn 2+ (aq) Zn (s) + Mg 2+ (aq)
11
2.6 Mg-Ca-Zn ternary system alloys
The previous study has proven that for binary Mg-Ca alloys, the corrosion rates increased significantly as the calcium contents increased. It is proven that rising in calcium contents also decreased the grain size of the magnesium based alloy (Rad et al., 2012).
Mg-Ca-Zn system with addition of alloying elements has good strength properties, toughness, corrosion resistance and creep resistance. The presence of calcium in the magnesium based alloy enhances the strength and corrosion resistance while zinc improves the precipitation hardening response. It is found that oxidation resistance of magnesium can be improved by addition of calcium at temperature above 750K. On the other hand, alloying with zinc element increases the fracture toughness of wrought magnesium alloys (Rahman, 2008).
One of the samples chemical compositions Mg-Zn-1wt%Ca, Mg-Zn-2wt%Ca or Mg- Zn-0wt%Ca will be chosen as the right magnesium alloys that meet the requirements of biodegradable material. It can be applied as the implants without any harmful effects on host (Nowosielski et al., 2013). Generally, addition of Ca and Zn for magnesium alloy should not be higher than 2wt% and 6wt% respectively (Emley, 1966).
Undesired accompanying elements in magnesium alloys are iron, nickel, cobalt and copper, which, due to their electropositive nature, cause a considerable increase in the tendency for corrosion (Heinz et al., 2012)
Table 2: Influence of alloying elements on the properties of magnesium alloys (Nowosielski et al., 2013)
The effect of the alloying elements on:
Alloying element
Tensile strength
Ultimate compressive
Yield strength
Hardness Corrosion resistance
Refinement grain
Calcium + - +
Zinc + -* +
Manganese + + + +
Silicon + + -
Yttrium + +
+ Positive effect of alloying element (increase property), - Negative effect of alloying element (decrease property),
* Only at high concentrations of zinc in the alloy.
12
2.7 Mg-Ca binary system alloys
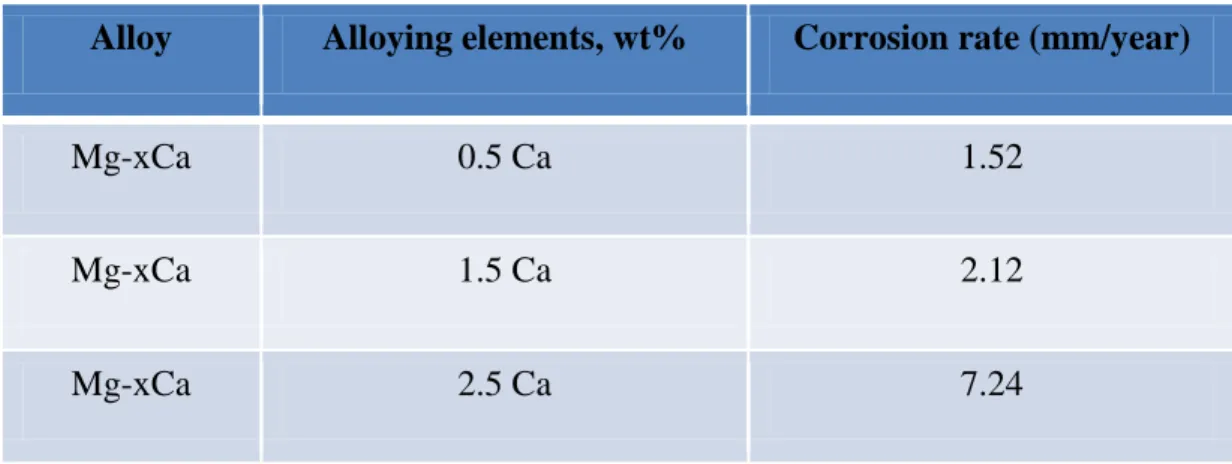
Table 3 : Comparison of corrosion rate for Mg-Ca alloy (Reza et al., 2012) Alloy Alloying elements, wt% Corrosion rate (mm/year)
Mg-xCa 0.5 Ca 1.52
Mg-xCa 1.5 Ca 2.12
Mg-xCa 2.5 Ca 7.24
The table above summarized the corrosion rate of the Mg-Ca binary system alloys based on the previous study. It is shown that, Mg-2.5Ca with higher content of calcium having higher corrosion rate per year.
The degradation of alloys in simulated body fluid follows the equation below:
Mg + 2H20 Mg(OH)2 +H2
There are formation of Mg(OH)2 which act as the protective layer of the alloy. The CO32-
, PO43-
and Cl- ions were attached to the surface of the specimen. This will lead to more accumulation of OH- ion for nucleation. Large amount of deep corrosion will be seen for the specimen with higher content of calcium that is due to higher corrosion rate.
13
2.8 Microstructure of magnesium alloys
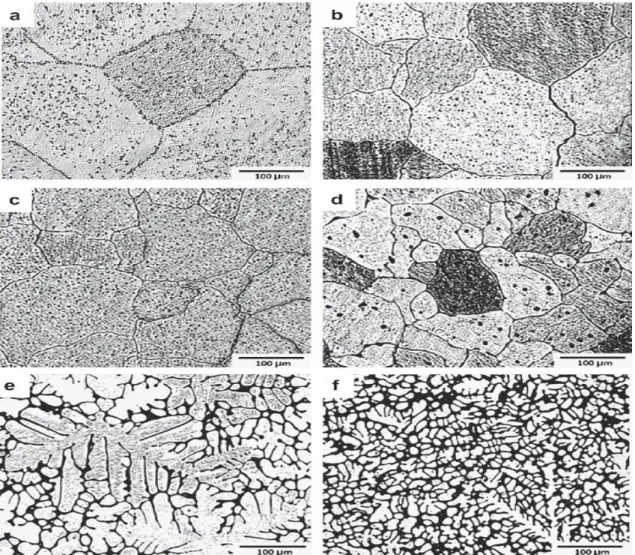
Electrochemically, Mg2Ca phase is more active and assumes the role of anode contradicting other intermetallic which is cathode in relation to magnesium. Calcium is a unique alloying element added to magnesium in the context of degradable implants. The effect of calcium content on microstructure of magnesium alloys based on several studies was shown the significant decrement of grain size and dendritic cell size with higher amount of calcium. More Mg2Ca intermetallic phase formed in grain boundaries when the introduction of calcium is higher. The studies proved that a fine grain structure will lower the ductility of the alloys. Below is the illustration of different microstructure of magnesium alloys after variation of calcium content(He et al., 2011). The grain size seems to be smaller as calcium content increases (from figure (a) to figure (f)).
Figure 6: Optical micrographs a) pure mg b) Mg-0.5Ca c) Mg-1.25Ca d) Mg-2.5Ca e) Mg-5Ca f) Mg-10Ca (He et al., 2011)
14
CHAPTER 3
METHODOLOGY
3.1 Research methodologyBelow is the process flow chart for this study:
Materials preparation
Prepare the right amount for magnesium, zinc and calcium to develop: Mg-Zn-1wt%Ca, Mg-Zn-2wt%Ca, Mg-Zn-0wt%Ca
Fabrication of alloy
Melt the materials under argon gas in ceramic crucible in a furnace.
Immersion test Examine the corrosion resistance by conducting immersion test.
Weight loss measurement
Based on the data gathering in weight loss method, corrosion rate of the samples can be determined
EDX & SEM
Examine the structure and elements of the both alloys by energy dispersed X-ray (EDX) and a scanning electron microscope
(SEM).
Figure 7: Research methodology
15
The details for each step in the research methodology are as follows:
3.1.1 Materials preparation
Prepare pure magnesium (97.99%) , zinc and calcium as raw materials to develop:
a) Mg-Zn-1wt%Ca b) Mg-Zn-2wt%Ca
c) Mg-Zn-0wt%Ca (Rad et al., 2012)
Table 4: Composition of Alloys Alloys
Total mass, mg
Weight, mg
Magnesium Zinc Calcium Mg-Zn-0wt%Ca
5000 4950 50 0
Mg-Zn-1wt%Ca
5000 4900 50 50
Mg-Zn-2wt%Ca
5000 4850 50 100
3.1.2 Fabrication of alloy
Melt the materials with a chemical composition of Mg-Zn-1wt%Ca, Mg-Zn-2wt%Ca and Mg-Zn-0wt%Ca at a temperature of 750oC at 10 oC /min in a ceramic crucible and place them inside the tube furnace.
Figure 8 : Tube furnace
16
Below are the details for heating sequence: (Rad et al., 2012)
1. Argon purging : 15 minutes 2. Heating to 750oC @ 10oC/min : 82 minutes 3. Dwelling (hold in temperature) @ 750oC : 60 minutes 4. Cooling to 30oC @ 10oC/min : 82 minutes 5. Argon purging : 10-30 minutes 6. End of process
Figure 9 : Heating sequence
Set the furnace for 3 ramps (change in temperature) at magnesium, zinc and calcium melting points. The ramp is used to heat up or cool down the rate to the specified melting points of each component. Then, the furnace will dwell or hold the temperature for 60 minutes at 750oC.
0 100 200 300 400 500 600 700 800
0 50 100 150 200 250 300
Temperature (oC)
Time (mins)
Heating Sequence
17
Melting point for magnesium, zinc and calcium are:
Table 5 : Melting Point
Component Melting Point
Magnesium 650oC
Zinc 419.5oC
Calcium 842oC
3.1.3 Immersion test
Immersion test setup:
Figure 10 : Immersion test setup
The samples are placed and held in the glass container with testing solution inside which is simulated body fluid or SBF solution. To ensure its condition is constant throughout the test, agitation of the solution is required by placing the glass container on a magnetic stirrer and its temperature is controlled at 37oC ± 0.5.
Floating balls are scattered on SBF solution surface to reduce energy lost and water evaporation. The pH values of the SBF solution is monitored for 7.4 ± 0.1 by means of pH electrode of a programmable threshold switch.
SBF solution is used to control the pH value of human blood plasma and ionic composition. The composition is the same as stated in Table 6.
18
The mass loss of the samples can be determined accurately by removing the degradation products from the each sample. The loose degradation products can be removed by using a brush after immersion.
Then, ethanol is used to ultrasonically clean the samples and immerse them for 20 minutes in;
11.1 g Sodium Dihydrogen Citrate 1.7 g Citric Acid
0.1 g tryptamine (as corrosion inhibitor) 250 ml Dionized water
The samples are once more mechanically cleaned by using a brush and ultrasonically cleaned in ethanol and finally dried in hot air. (Schinhammer et al., 2013)
Before conducting the immersion test, prepare 2L simulated body fluid (SBF) solution by the following chemical composition:
Table 6: SBF Chemical Composition
Chemicals Concentration Mass for 2L
NaCl 6.8 g/L 13.6 g
CaCl2 0.2 g/L 0.4 g
KCl 0.4 g/L 0.6 g
MgSO4 0.1 g/L 0.2 g
NaHCO3 2.2 g/L 4.4 g
Na2HPO4 0.126 g/L 0.252 g
NaH2PO4 0.026 g/L 0.052 g
Examine the corrosion resistance by conducting immersion test. Immerse the prepared specimens into simulated body fluid (SBF) (Lenka & Frank, 2006). The dimension of test specimen is 20 x 10 x 8 mm rod with total area of 880mm2 or 8.8 cm2. Ratio of solution volume to sample surface area is 20ml/cm2 according to ASTM G31-72. Each immersion test requires 176ml SBF solution (Lenka & Frank, 2006).
19
Experimental procedures can be summarized as follows:
1. Polish the samples with SiC papers of 1200 and 2500 grit.
2. Clean them ultrasonically for 10 minutes with ethanol
3. Weigh the samples before immersion in simulated body fluid (SBF) of pH 7.44 at 37 oC. Monitor the pH values of the solution. Seal the beakers and incubate with pH of the solution is set to 7.44 with HCl and NaOH.
4. Wash the samples with deionized water and dry them in the air 5. Weigh all the samples
The samples are then need to be immerse in SBF solution for 6, 12, 24, 72, 120, 192, 264, 336, 408, 480 hours (Rad et al., 2012)
3.1.4 Corrosion rate - weight loss measurement
The basis to determine the corrosion rate is the sample weight loss due to immersion in simulated body fluid (Rad et al., 2012). Below is the method to determine the weight loss of the samples:
Table 7 : Weight Loss Measurement
Sample Area (cm2)
Initial weight (mg)
Final weight
(mg)
Weight loss (mg)
Corrosion rate (mm/year)
Mg-Zn-0wt%Ca
Mg-Zn-1wt%Ca
Mg-Zn-2wt%Ca
20
Based on the data gathering, corrosion rate is expressed by:
( ) (Rad et al., 2012) ( )
( ) ( )
( ) ( ) Note:
Assume magnesium density based on 97.99%
Area calculated based on sphere shape, A=4πr2
3.1.5 EDX (Energy-dispersed X-ray) and SEM ( Scanning electron microscopy) test
This method is used for elemental analysis and morphology characterization of a sample. The characterization is conducted before and after the immersion test of each sample. Therefore, clear differentiation can be seen on the microstructure of the samples before and after degradation process (Venkannah, 2004).
SEM or optical and scanning electron microscopy is used to observe the interface between corrosion layer and metal substrate using scanning electron microscopy.
Corrosion properties of the immersed samples can be evaluated by the morphology observation. While, EDX adopt the consequence of the collision between an energetic beam electron and target material’s inner-shell electrons of an atom. The energy values from x-rays can determine the elemental presence. This will provide the basis for qualitative analysis using EDX in the SEM (Carlton, 2001).
21 Experiment preparation:
Several procedures as the preparation prior to SEM and EDX examination have to be conducted. The samples are needed to be clean and insure there is no damage on their surface.
The procedures are:
1. Cut the ingots and fit them in the sample holder 2. Degrease the samples in acetone ultrasonically.
3. Wash the samples by using methanol to remove remaining surface film.
4. Mount the samples with hot mounting machine.
5. Grind on progressively on the surface of the samples by using finer SiC paper.
6. Polish the samples by using SiC paper on rotating wheel.
7. Etch the samples in acetic picral solution.
8. Conduct the EDX and SEM treatment to observe the elemental present and microscopy respectively of all the samples. (Nowosielski et al., 2013).
Mounting
The samples will be evaluated before the immersion test is conducted. Mg-Zn- 1wt%Ca ingot is ground progressively on its surface by using silicon carbide paper for sanding down the surface.
Then, the samples are mounted by using hot mounting machine. The purpose of mounting the samples is to ease the handling by shaping them into convenient shape and size and to protect the surface from defects. Thus, the samples can be fit or place into SEM (Nowosielski et al., 2013).
.
22
Figure 11 : Hot Mounting Machine
Before fitting them into SEM, the samples is polished by using alumina powder on rotating wheel and then the samples are etched in acetic picral solution. Magnesium and its alloys have low melting point so, hot compression mounting can be used. So that, the surface of the samples becomes finer for SEM analysis later. But, the pressure in hot compression mounting may induce mechanical twinning in high purity magnesium.
The hot mounting machine is set to:
Pressure : 4000psi Heat time : 3 minutes Cool time : 2 minutes
Too small samples should be held conveniently for grinding and polishing. Hot mounting are preferred for this process. The samples can be clamped together to form packs. Bolting or clamping must be done carefully to avoid cold working (Nowosielski et al., 2013).
23 Grinding
Abrasive paper is used to perform dry and wet grinding of the samples. Abrasives that can be used for grinding are silicon carbide, alumina and emery.
Wet grinding is preferred as it can prevent overheating of the samples. It is also can maintain exposure of the sharp edges of the abrasive. Horizontal polishing wheel of conventional 200 mm and 1000 grit silicon carbide paper are often used for fine grinding. Abraded fragments can be flushed away by directing a small stream of water (Nowosielski et al., 2013).
Mechanical polishing
There are two stages of mechanical polishing, rough and finish. Major remaining metal after grinding can be removed by rough polishing and then superficial scratches remain after rough polishing are removed by finish polishing.
Medium nap cloth is used for both polishing wheels. Rough polishing need a suspension of 2000 grit Al2O3 per 500 ml water on the wheel to yield a better surface finish with less scratch. Time required for polishing is doubled to minimize amount of scratches from grinding process.
Optimum pressure should be used to reduce the relief polishing due to different rate if stock removal between harder and softer micro constituents.
A suspension of 10 g Al2O3 per 500 ml water is used on the wheel for finish polishing. The abrasive solution is added by 15 ml of soft soap. The sample is moved across the surface of the wheel to distribute the abrasive over the samples. An optimum pressure is also required for the process as too less pressure will lead to relief polishing and rough structure.
Remaining light scratches and cold worked surface can be removed by light etching and repolishing. The samples must be rinsed thoroughly if soft soap is used.
The sample exposure to water is kept as brief as possible for cleaning process. It is inconvenient cleaning without using water as the medium. The micro structure is not affected by holding the samples under running water for a second to ease the cleaning (Nowosielski et al., 2013).
24 Etching
Several standard etchants can be used to reveal the microstructure. In this study, acetic picral etching solution is used. The surface of the sample can be scratched by cosmetic cotton puff while etching (Voort, 2010).
Table 8 : Chemical etchants
Name Composition Comments
Glycol 1 ml HNO3
24 ml water
75 ml ethylene glycol
It is general-purpose etchant.
Immerse for 3 to 5 seconds.
Rinse with water and dry under hot air.
Magnesium rare earth alloys and magnesium thorium alloys are preferred to use glycol etch.
Acetic glycol 20 ml acetic acid 1 ml HNO3
60 ml ethylene glycol 20 ml water
It is general-purpose etchant.
Immerse for 1 to 3 seconds for cast alloys and 10 seconds for annealed alloys.
Rinse with water and dry under hot air.
Acetic picral 5 ml acetic acid 6 g picric acid 10 ml water 100 ml ethanol
Immerse until brown film appear on the surface.
Rinse with ethanol and dry under hot air.
May reveal grain boundaries, mechanical twins and residual cold work.
It is a staining reagent that can produce color as viewed with polarized light and sensitive tint.
Phosphor- picral
0.7 ml H3PO4 4.6 g picric acid 100 ml ethanol
Immerse for 10 to 20 seconds.
Rinse with ethanol and dry under hot air.
Looking for undissolved second phase particles in solution annealed samples. A good contrast between the darkened matrix and the unaffected second phase constituents.
Hydrofluoric acid
100 ml Hydrofluoric acid
90 ml water
Place the solution in polyethylene or glass beaker.
Immerse for 1 to 2 seconds.
25
3.2 Study plan (Gantt-Chart) Table 9: Gantt Chart
Details /Activities
Week
FYP1 FYP2
1 2 3 4 5 6 7 8 9 10 11 12 13 14 1 2 3 4 5 6 7 8 9 10 11 12 13 14
Project title selection Understanding the concept of
biodegradation Study microstructure and elemental characterization
concept
Consult supervisor for clear understanding Raw materials preparation and
alloys fabrication Microstructure and elemental
characterization test
Immersion test Weight loss measurement Corrosion rate analysis Microstructure and elemental
characterization test
Preparation for Pre-SEDEX Preparation for viva
26
3.3 Key milestone
Table 10 : Details on key milestone
Week FYP I
Week 2-8
Research work (study on journal articles and books)
Establish firm understanding on degradable magnesium
alloy.
Produce a proposal
Week 9-11
Raw materials preparation and alloys fabrication
Establish methodology to investigate magnesium alloy properties (sample 1)
Week 12-14 Preparation for immersion test
Prepare the immersion solution (simulated body fluid)
Week FYP II
Week 1-4 Raw materials preparation and alloys fabrication
Continue fabricate the magnesium alloy (sample 2 ) Week 5-6 Raw materials preparation and alloys fabrication
Continue fabricate the magnesium alloy (sample 3 )
Week 7-8
Immersion test
Establish methodology to investigate the corrosion properties of the alloy prepared.
Week 9
Conduct EDX and SEM analysis
Microstructure analysis
Weight loss measurement and corrosion rate analysis
Completed weight loss measurement
Determine the corrosion rate of each sample
Week 10-11 Preparation Pre-Sedex, dissertation and technical paper
Week 12-14
Preparation for oral presentation
Establish firm understanding on the effect of calcium composition variation.
27
CHAPTER 4
RESULTS AND DISCUSSION
4.1 Alloy fabrication
1. First
trial (Mg-Zn-1wt%Ca)The first trial shows the alloy is not really well melted. There are only small grains appear. The analysis cannot be proceed due to small grain size. This is due to no ramp (change in temperature) set to the furnace during heating process. The ramp set up is important for single crystal growth of magnesium, zinc and calcium in a tube furnace.
2.
Second trial (Mg-Zn-1wt%Ca)On the second trial, the furnace is set up with 3 ramps at magnesium, zinc and calcium melting point. The ramp is used to heat up or cool down the rate to the specified melting points of each component. Then, the furnace will dwell or hold the
Figure 12 : First trial Mg-Zn-1wt%Ca
Figure 13 : Second trial Mg-Zn-1wt%Ca
28
temperature for 60 minutes at 750oC. The grain size seems larger, shiny and having hard surface than before. Therefore, the analysis can be done on the samples. All three magnesium alloys; Mg-Zn-0wt%Ca, Mg-Zn-1wt%Ca and Mg-Zn-2wt%Ca were fabricated well by applying the ramp setting of the furnace.
4.2 Corrosion rate
The basis to determine the corrosion rate is the sample weight loss due to immersion in simulated body fluid. Below are the corrosion rate obtained for each sample:
Table 11: Corrosion Rate
Sample Area
(cm2)
Initial weight
(mg)
Final weight
(mg)
Weight loss (mg)
Corrosion rate (mm/year)
Mg-Zn-0wt%Ca 8.8 29.5 28.2 1.28 2.12
Mg-Zn-1wt%Ca 8.8 28.3 27.2 1.13 1.87
Mg-Zn-2wt%Ca 8.8 28.7 26.6 2.15 3.56
Figure 14 : Corrosion Rate Based on Difference in Calcium Composition
0 0.5 1 1.5 2 2.5 3 3.5 4
0wt% 1wt% 2wt%
Corrosion Rate (mm/year)
Composition of Calcium (wt%)
Corrosion Rate (mm/year)
29
After each immersion test, each sample was removed from simulated body fluid solution and washed with distilled water. Each sample is weighed before and after the immersion test which we immerse the sample in simulated body fluid. The area of the sample exposed to the simulated body fluid is fixed to 8.8cm2 by cutting the samples into 20 x 10 x 8 mm rod each.
The corrosion rate in mm/year is calculated by this equation;
( ) (Rad et al., 2012) ( )
( ) ( )
( ) ( )
From the corrosion rate calculated, it can be concluded that, the corrosion rate is reduced as there is a presence of calcium in the sample. But, as calcium content increases, the corrosion rate increases. Thus, the corrosion resistance is decreased.
Therefore, Mg-Zn-1wt%Ca with corrosion rate of 1.87 mm per year is the optimum choice to be implemented as the degradable stent because it has the lowest corrosion rate and highest corrosion resistance as compared to other two samples. Mg-Zn- 1wt%Ca having lower corrosion rate than Mg-Zn-0wt%Ca (2.12 mm per year) due to the presence of calcium in the alloy that can reduce the corrosion rate as compared to the alloy without any presence of calcium. While, Mg-Zn-2wt%Ca with corrosion rate of 3.56 mm per year is not able to be applied as good degradable material as it will not prolong in human body due to low corrosion resistance. Thus, complete healing of the arteries cannot be achieved.
30
4.3 Scanning Electron Microscopy (SEM) and Energy Dispersed X-Ray (EDX) analysis
Figure 15 : Magnesium alloy samples ready for SEM and EDX analysis
Magnesium and its alloy are difficult to be prepared due to low matrix hardness and high hardness of precipitate that will lead to relief problem. Cutting, handling or grinding might cause mechanical twinning if the pressure is high. The right technique of cutting is important to produce the least amount of damage to samples. The use of water should be minimized during cleaning process and final polishing. Excellent result can be obtained by using an abrasive cut-off saw. During cutting operation, coolant must be used to reduce the heat produced to minimize sample damage.
Final polishing is one of the weak points in the process. It is difficult to get the best quality of magnesium oxide and its size of particles is too course. It is also hard on polishing cloths and can be suspended in water. Thus, alumina is the best option to be used as abrasive for final polishing. It also has optimum particle size. (Voort, 2010)
After the analysis, the immersion test can be conducted and the corrosion rate Mg- Zn-1wt%Ca, Mg-Zn-2wt%Ca and Mg-Zn-0wt%Ca can be determined. The microstructure of these three samples after immersion can be analyzed and compared.
Mg-Zn-0wt%Ca Mg-Zn-1wt%Ca Mg-Zn-2wt%Ca
31
Figure 16 : SEM and EDX
Below are the results obtained for microstructure from Scanning Electron Microscopy (SEM):
SEM Microscopic Image Details
a) Mg-Zn-0wt%Ca
Large grain
No clear grain boundaries
b) Mg-Zn-1wt%Ca
Smaller grain
Grain boundaries start to be obvious
c) Mg-Zn-2wt%Ca
Smallest grain
More grain boundaries
32
Figure above shows SEM micrographs of Mg-Zn-xCa alloy with different percentage of calcium. SEM was set to 300x magnification. As can be seen from figure a), b) and c) the grain size is getting smaller as percentage of calcium increases.
As can be seen in figure a) which is magnesium alloy without any calcium in, the grain size of the alloy is much larger than other two. Magnesium alloy with 1wt%
calcium shows a bit smaller grain size. And the last one is magnesium alloy with 2wt% calcium, it shows the smallest grain size among these three samples.
The grain size will affect the corrosion behavior of the magnesium alloy. The significant of smaller grain size is it will provide higher yield strength and stress relaxation resistance of the product later. Ductility or solid material’s ability to deform under tensile stress of the alloy is less as the grain size is smaller.
It was also found that the corrosion resistance will be improved with the decrease of grain size. But, smaller grain size will lead to more yield of grain boundaries to appear. Higher grain boundary density will accelerate the corrosion due to no passive process in its environment. It will depend upon the ability of the environment to passivate. Thus, corrosion resistance decreases with refining grain size. Therefore, Mg-Zn-1wt%Ca is selected as the best choice to be implemented as degradable implant due to its optimum corrosion resistance as it has smaller grain size and the grain boundary density is not too bulky (Voort, 2010).
33
Below are the results obtained for microstructure from Energy Dispersed X-Ray (EDX):
a) Mg-Zn-0wt%Ca
Element Number Element Symbol Element Name Concentration
12 Mg Magnesium 74.8
8 O Oxygen 21.9
6 C Carbon 1.4
11 Na Sodium 1.4
30 Zn Zinc 0.5
20 Ca Calcium 0.0
Mg-Zn-0wt%Ca alloy was examined by EDX to determine the composition of the magnesium alloy. The main elements detected on the surface of the sample were Mg, O, C, Na, Zn, and Ca indicating that Mg and Zn was present in the alloy. There is no calcium in the alloy and magnesium is found to be significant in quantities as it is the main constituent of the alloy.
Mg
Zn
Zn Ca
34 b) Mg-Zn-1wt%Ca
Element Number
Element Symbol
Element Name
Confidence Concentration Error
12 Mg Magnesium 100.0 96.6 0.3
11 Na Sodium 100.0 1.2 3.6
30 Zn Zinc Manual 0.9 7.0
20 Ca Calcium Manual 1.3 3.4
Mg-Zn-1wt%Ca alloy was examined by EDX to determine the composition of the magnesium alloy. The main elements detected on the surface of the sample were Mg, Na, Zn, and Ca indicating that Mg, Zn and Ca was present in the alloy.
Mg
Zn Ca
35 c) Mg-Zn-2wt%Ca
Element Number
Element Symbol
Element Name
Confidence Concentration Error
12 Mg Magnesium 100.0 78.2 0.4
20 Ca Calcium Manual 8.1 1.2
8 O Oxygen 100.0 11.3 2.7
30 Zn Zinc Manual 2.5 3.6
Mg-Zn-2wt%Ca alloy was examined by EDX to determine the composition of the magnesium alloy. The main elements detected on the surface of the sample were Mg, Ca, O, and Zn indicating that Mg, Zn and Ca were present in the alloy.
Mg
Caa Zn
36
CHAPTER 5
CONCLUSION AND RECOMMENDATION
5.1 Conclusion
Variation of calcium composition will cause the significant effect on the corrosion resistance and surface morphologies of magnesium alloys. Therefore,
1. Three samples of magnesium alloy with different calcium composition (Mg- Zn-1wt%Ca, Mg-Zn-2wt%Ca and Mg-Zn-0wt%Ca) were fabricated and melted well in a tube furnace after some modification done. The ramp setting of the furnace is required to yield every single crystal growth of each element. As a result, each samples yielded harder, larger and shiny surface which is good for SEM and EDX analysis later.
2. The biodegradability or corrosion resistance for Mg-Zn-1wt%Ca, Mg-Zn- 2wt%Ca and Mg-Zn-0wt%Ca can be determined through the corrosion rate.
From the result obtained, the calculated corrosion rate for the three samples of magnesium alloy shows that the Mg-Zn-1wt%Ca has the optimum composition of calcium which leads to lowest corrosion rate (1.87 mm/year) and highest corrosion resistance among those three samples. Magnesium alloy for degradable implant is desired to have the high corrosion resistance and low degradation rate to prolong its existence in blood arteries for complete healing process. Therefore, Mg-Zn-1wt%Ca can be implemented as degradable implant.
3. According to the previous study, the microstructure of implants will be affected by the amount of calcium present in the alloys (Meisam & Yuebin, 2012). Thus, the effect on surface morphologies of magnesium alloys that influenced by variation in calcium contents have been analyzed through scanning electron microscopy (SEM) and energy dispersed x-ray (EDX) method. From the result obtained, more calcium content in magnesium alloy (Mg-Zn-2wt%Ca) will lead to smaller grain size and more grain boundaries to appear in SEM images. Thus, the corrosion rate is higher as there are more
37
grain boundaries due to no passive process. Therefore, Mg-Zn-2wt%Ca is not recommended to be implemented as degradable implant as it has low corrosion resistance. Once again, Mg-Zn-1wt%Ca is selected as the best magnesium alloy among those three samples as the presence of calcium in the alloy can reduce the corrosion rate as compared to Mg-Zn-0wt%Ca with no calcium at all. From EDX analysis, it is proved that main elements detected in magnesium alloy are magnesium, zinc, and calcium which is respective to its individual composition.
38
5.2 Recommendation
1. Ramping method is required in order to heat up or cool down the rate to the specified melting points of magnesium, zinc and calcium to melt the alloy well. 3 ramps at magnesium, zinc, and calcium melting points are needed for single crystal growth of each element in the furnace. With that, larger grain size can be produced and analysis can be done on each sample. Therefore, Mg-Zn-0wt%Ca, Mg-Zn-1wt%Ca and Mg-Zn-2wt%Ca are melted well in the furnace as the desired alloy sample.
2. It is recommended to use the EIS (electron impedance spectroscopy) or LPR (linear polarization resistance) to analyze and determine the corrosion resistance of magnesium alloy. These two methods can yield more accurate result as compared to weight loss measurement in determining the corrosion resistance.
3. It is difficult to prepare for metallographic examination of magnesium alloy.
The procedures must be followed and executed carefully to yield a true representation of microstructure. The finest SiC as an abrasive for grinding is needed to remove the cutting damage and to produce satisfactory final polishing results for SEM and EDX analysis. (Voort, 2010).
39
REFERENCE
Allan, G., Roger, V., Benjamin, E., Berry, J., & Borden, W. (2013). Circulation. . Heart disease and stroke statistics—2013 update: a report from the American Heart Association.
Brar, H. S., Platt, M. O., Sarntinoranont, M., Martin, P. I., & Manuel, M. V. (2009).
Magnesium as a biodegradable and bioabsorbable material for medical implants.
JOM, 61(9), 31-34. doi: 10.1007/s11837-009-0129-0
Carlton, R. A. (2001). Quantitative x-ray spectrometry using the environmental scanning electron microscope. (3036250 Ph.D.), Lehigh University, Ann Arbor.
Retrieved from http://search.proquest.com/docview/304699905?accountid=47520 ProQuest Dissertations & Theses Full Text: The Sciences and Engineering
Collection database.
Chris, W. (2013). Polymer vs. Metal: The Battle of Bioresorbable Stents. from http://www.mddionline.com/article/polymer-vs-metal-battle-bioresorbable-stents Dharam, P.-S., & Anthony, M. (2012). Biodegradable Magnesium Alloys : A review of material development and applications.
Donnan, Fisher, Macleod, & Davis. (2008). Stroke. doi: 10.1016/S0140- 6736(08060694-7
Dugdale, D. C. (2012). Angioplasty and stent placement - carotid artery from http://www.nlm.nih.gov/medlineplus/ency/article/002953.htm
Emley, E. F. ( 1966). Oxford: Pergamon Press. Principles of Magnesium Technology.
Guang-Ling, S. (2011). Corrosion of Magnesium Alloys. Magnesium(Mg) corrosion : a challenging concept for degradable implants.
He, S.-y., Sun, Y., Chen, M.-f., Liu, D.-b., & Ye, X.-y. (2011). Microstructure and properties of biodegradable β-TCP reinforced Mg-Zn-Zr composites. Transactions of Nonferrous Metals Society of China, 21(4), 814-819. doi:
http://dx.doi.org/10.1016/S1003-6326(11)60786-3 Healthwise, S. ( 2013). Carotid Angioplasty. from
https://myhealth.alberta.ca/health/pages/conditions.aspx?hwid=abk7000
Heinz, M., Peter, U., & Joerg, L. (2012). Magnesium-zinc-calcium alloy, method for production thereof, and use thereof.
Joner, M., Finn, A. V., Farb, E. K. M., Kolodgie, F. D., Ladich, E., Kutys, R., . . . Am, C. J. (2006). Cardiol., 48, 193-202.
Julie, S. (2014). Bioabsorbable Coronary Stents. from http://dujs.dartmouth.edu/wp- content/uploads/2011/03/14_pdfsam_11w_final.pdf
40
Lenka, M., & Frank, A. M. (2006). Acta Biomaterialia. Preparation of SBF with different View the MathML source content and its influence on the composition of biomimetic apatites, 2(2), 181-189.
Maryam, M., & Diego, M. (2011). Molecular Sciences Biodegradable Metals for Cardiovascular Stent Application: Interests in New Opportunities.
Meisam, S., & Yuebin, G. (2012). Biodegradable Orthopedic Magnesium-Calcium (MgCa) Alloys,Processing, and Corrosion Performance.
Nowosielski, R., Cesarz*, K., & Babilas, R. (2013). Structure and corrosion
properties of Mg70-xZn30Cax(x=0.4) alloys for biomedical applications. Journal of achievement in materials and manufacturing engineering, 58(1).
Rad, H. R. B., Idris, M. H., Kadir, M. R. A., & Farahany, S. (2012). Microstructure analysis and corrosion behavior of biodegradable Mg–Ca implant alloys. Materials
& Design, 33(0), 88-97. doi: http://dx.doi.org/10.1016/j.matdes.2011.06.057
Rahman, S. W. (2008). Thermodynamic modeling of the (magnesium, aluminum)- calcium-zinc systems. (MR63195 M.A.Sc.), Concordia University (Canada), Ann Arbor. Retrieved from
http://search.proquest.com/docview/578481064?accountid=47520 ProQuest
Dissertations & Theses Full Text: The Sciences and Engineering Collection database.
Reza, H., Rad, B., Hasbullah, M., Rafiq, M., Kadir, A., & Farahany, S. (2012).
Microstructure analysis and corrosion behavior of biodegradable Mg-Ca implant allos.
Schinhammer, M., Hofstetter, J., Wegmann, C., Moszner, F., Lo¨ffler, J. F., &
Uggowitzer, P. J. (2013). On the Immersion Testing of Degradable Implant Materials in Simulated Body Fluid: Active pH Regulation Using CO2.
Shalaby, W. S., Karen, J. L. B., & Waleed, S. (2012). Polymers for Vascular and Urogenital Applications.
Sims, & Muyderman, H. (2009). Biochimia et Biophysia Acta Mitochondria, oxidative metabolism and cell death in stroke.
Tullmin, M. (2004). Galvanic Corrosion. from http://www.corrosion- club.com/galvanic.htm
Venkannah, S. (2004). MATERIALS SCIENCE MODULE- MECH 2121.
Voort, G. V. (2010). Metallography of Magnesium and its Alloys.
Werkhoven, R. J., Sillekens, W. H., & Lieshout , J. B. J. M. (2011). Proc. Magnes.
Technol. . 419–424.
William, G., Dai, Y., Lei, P., & Patrick, V. (2012). Stenting for stroke prevention becoming safer in high-risk patients, study suggests.
41
Xue-Nan, G., & Yu-Feng, Z. (2010). A review on magnesium alloys as biodegradable materials.
Xue, G., & Yu, Z. (2010). A review on magnesium alloys as biodegradable materials. 111-115.
Yu, S., Baoping, Z., Yin, W., Lin, G., & Xiaohui, J. (2012). Preparation and characterization of a new biomedical Mg–Zn–Ca alloy.