CERTIFICATION OF APPROVAL
PALM WASTE BRIQUETTE & BIO-BRIQUETTE AS POTENTIAL FUEL
by
Khairil Nizam Bin Mohamad Darus
A project dissertation submitted to the Mechanical Engineering Programme
Universiti Teknologi PETRONAS in partial fulfillment of the requirement for the
BACHELOR OF ENGINEERING (Hons) (MECHANICAL ENGINEERING)
Approved by,
_____________
(Chin Yee Sing)
UNIVERSITI TEKNOLOGI PETRONAS TRONOH, PERAK
December 2010
CERTIFICATION OF ORIGINALITY
This is to certify that I am responsible for the work submitted in this project, that the original work is my own except as specified in the references and acknowledgements, and that the original work contained herein have not been undertaken or done by unspecified sources or persons.
_________________________
KHAIRIL NIZAM BIN MOHAMAD DARUS
ABSTRACT
Excessive amount of Greenhouse Gas (GHG) emissions has increase global warming and is threatening our world right now. Fossil fuel burning for power generation is one of the major sources of those hazardous gases. Considering the current situation, a lot of study on the utilization of biomass to be used as alternative fuel is currently going on. This study is considering the utilization of palm shell and fibre to be used as fuel or either as supplement medium in coal co-firing power plants. Co-firing with biomass is one way to counter the excessive GHG emissions problem since the amount of carbon dioxide (CO2) produced from combustion of biomass is equal to the amount of CO2 absorbed during plant growth.
This report started with brief introduction of the study which includes the background of study, problem statements and objectives of the study. This report also includes some information in literature review parts where the author explains thoroughly on biomass, advantages and disadvantages, coal and co-firing. The author is considering three cases in the study which are:-
Case 1: 100% Brown Coal
Case 2: Bio-briquette – 50% Coal + 50% Palm-waste
Case 3: Palm-waste briquette – 60% Shell + 40% Fibre
The report continues with the methodology of the project which includes the project milestone, work flow and details on tools and equipments used in the project. Next, results and discussion part is where analysis of ultimate and proximate results, and also analysis on calorific values of the samples are gathered. The main part of the project which are the results from modelling and simulations of the fuels combustions are also included in this section.
The report then followed by conclusions and recommendations from findings and analysis that had been made. For further clarification on the projects, the report ended with a list of references and appendices used throughout the project.
ACKNOWLEDGEMENT
I would like to take this opportunity to thank God for all His blessing that allows me to complete this project. I would also like to acknowledge and thank everyone that has given me all the supports and guidance throughout the whole period of completing the final year project.
Firstly, many thanks to my supervisor, Ms. Chin Yee Sing for the endless help, support, guidance and time allocated throughout the working period in order to ensure the project is successfully completed.
Next, I would also like to give a token of appreciation to Mr Kamal Ariff Bin Zainal Abidin and Dr Azuraien Binti Japper @ Jaafar as the examiners, for their supports, comments and guidance that can further improve my project.
I would also like to thank Dr. Saravanan a/l Karuppanan as the Final Year Project coordinator that had made necessary arrangements for this course.
Finally, thanks to the university, staff, technicians, my fellow colleagues and not to forget my family for their help, ideas and supports throughout the completion of this study. Thank you.
TABLE OF CONTENTS
CERTIFICATION OF APPROVAL . . . i
CERTIFICATION OF ORIGINALITY . . . . ii
ABSTRACT . . . iii
ACKNOWLEDGEMENT . . . iv
LIST OF FIGURES . . . 1
LIST OF TABLES & ABBREVIATIONS . . . . 2
CHAPTER 1: INTRODUCTION
1.1 Background of Study . . . 3
1.2 Problem Statement . . . 4
1.3 Objectives & Scope of Study . . . . 5 CHAPTER 2: LITERATURE REVIEW
2.1 Biomass . . . 6
2.2 Coal . . . 7
2.3 Co-firing . . . 10
CHAPTER 3: METHODOLOGY
3.1 Project Activities & Milestones . . . . 17
3.2 Work flow . . . 18
3.3 Tools, Machines and Software Used . . . 19
CHAPTER 4: RESULTS & DISCUSSION
4.1 Sample Details . . . 22
4.2 Analysis of Experimental Results . . . . 23
4.3 FLUENT Simulations . . . 25
4.4 Gas Analyzer Results . . . 33
CHAPTER 5: CONCLUSIONS & RECOMMENDATIONS
5.1 Conclusions . . . 36
5.2 Recommendations . . . 36
CHAPTER 6: REFERENCES . . . 37
CHAPTER 7: APPENDICES . . . 39
LIST OF FIGURES
Figure 1.1: Biomass resources distribution in Malaysia 3
Figure 2.1: Biomass from trees carbon cycle 6
Figure 2.2: Biomass carbon cycle 7
Figure 2.3: Direct Co-firing 13
Figure 2.4: Indirect Co-firing 14
Figure 2.5: Parallel Co-firing 15
Figure 3.1: Thermal Gravimetric Analyzer (TGA) module 19
Figure 3.2: CHNS-932 Analyzer 20
Figure 3.3: Bomb calorimeter 20
Figure 4.1: Proximate Analysis results 22
Figure 4.2: Ultimate Analysis results 23
Figure 4.3: Heating Values 24
Figure 4.4: Dimension of control volume adapted for modelling 25 Figure 4.5: Model of the meshed burner and combustion chamber in GAMBIT 26
Figure 4.6: Static Temperature (Coal) 27
Figure 4.7: Static Temperature (Bio-briquette) 28
Figure 4.8: Static Temperature (Palm-waste briquette) 28 Figure 4.9: Summary of Contour Plots of Static Temperature 29 Figure 4.10: Carbon Dioxide Concentration (Coal) 29 Figure 4.11: Carbon Dioxide Concentration (Bio-briquette) 30 Figure 4.12: Carbon Dioxide Concentration (Palm waste briquette) 30 Figure 4.13: Summary of Carbon Dioxide Concentration results 31
Figure 4.14: Nitrogen Concentration (Coal) 31
Figure 4.15: Nitrogen Concentration (Bio-briquette) 32 Figure 4.16: Nitrogen Concentration (Palm waste briquette) 32 Figure 4.17: Summary of Nitrogen Concentration results 33
Figure 4.18: Gas Analyzer results 34
Figure 7.1: Gas Analyzer unit 39
LIST OF TABLES
Table 4.1: Cases of Study 22
Table 7.1: Proximate Analysis (wt%) 41
Table 7.2: Ultimate Analysis (wt%) 41
Table 7.3: Calorific Value (cal/g) 41
Table 7.4: Constants used for modelling 42
Table 7.5: Gas analyzer results 43
LIST OF ABREVIATIONS
GHG Greenhouse Gas CO2 Carbon Dioxide EFB Empty Fruit Bunches POME Palm Oil Mill Effluent NOx Nitrogen Oxide
TGA Thermogravimetric Analysis
CHNS Carbon, Hydrogen, Nitrogen, Sulphur DSSN Dry Small Steam Nuts
CFD Computational Fluid Dynamics HHV High Heating Value
CAD Computer-Aided Design DBR Densified Biomass Residue TNB Tenaga Nasional Berhad PDF Probability Density Functions
CHAPTER 1 INTRODUCTION
1.0 INTRODUCTION
1.1 Background of Study
Biomass is biological material derived from living, or recently living organisms [1].
In the context of biomass for energy, this is often used to mean plant based material, but biomass can equally apply to both animal and vegetable derived material. Within this definition, biomass for energy can include a wide range of materials and it can be categorized to five main sources [2]:-
Virgin wood: from forestry, arboricultural activities or wood processing
Energy crops: high yield crops grown specifically for energy applications
Agricultural residues: from agriculture harvesting or processing
Food waste: from food and drink manufacture, preparation and processing, and post-consumer waste
Industrial waste and co-products: from manufacturing and industrial processes.
In Malaysia, agricultural residues is said to be the most abundant biomass where more than 70 million tonnes of biomass are produced annually. Suitable weather condition such as high sunlight intensity/time and high rainfall is one of the main reasons that contribute to continuous biomass production throughout the year [3].
Figure 1.1: Biomass resources distribution in Malaysia [3]
As shown in Figure 1.1, the main contributor of biomass in Malaysia is the palm oil industry where it contributed 94% of the overall resources. Basically, there are five materials that can be obtained from palm oil industry and considered as biomass which are [3]:-
Empty fruit bunches (EFB)
Palm oil mill effluent (POME)
Mesocarp fibre
Palm kernel shells
Palm kernel cake (residue)
This study is focusing on the utilization of palm fibre and shell as potential fuel.
There are three cases involve in this study as described below:-
Case 1: Brown coal
Composition: 100wt% Brown Coal Case 2: Bio-briquette
Composition: 50wt% Brown Coal and 50wt% palm waste briquette Case 3: Palm waste briquette
Composition: 60wt% shell and 40wt% fibre (60:40)
This study is basically an extension from the author’s supervisor’s project on
‘Energy from waste-development of alternative fuel briquettes from agricultural waste’ [15].
1.2 Problem Statement
Fossil fuel burning to produce energy is one of the major sources of excessive emission of GHG especially CO2 and Nitrogen Oxide (NOx), thus increasing the threat of global warming to the earth. Since the industrial age, those gases emission have increased by one-third. Uncontrolled anthropogenic release of those gases had increased heat trapped in the atmosphere and consequently increase the earth temperature ranging from 0.6 - 2.5°C for the last 50 years and 1.4 - 5.8°C in the 21st century [3]. Fossil fuel burning to produce energy is identified as one of the major
sources of those gases and the threat of global warming has already created consciousness among people to find better alternatives. In addition, rising fossil fuels price, rapid depletion of fuels reserves and growing energy demand are also some of the reasons that further research on biomass as potential fuels is required [3].
1.3 Objectives and scope of study
The main objective of the project is to investigate the feasibility of palm waste to be used as fuel or supplement medium for coal-biomass co-firing in coal fired power plants with the benefits of reduced amount of carbon dioxide and nitrogen oxide produced during combustion. The sub-objectives of this project basically consist of:- 1.3.1 To gather, examine and analyze the data from bomb calorimeter experiment,
ultimate and proximate analysis
1.3.2 To model and run combustion simulations using FLUENT software to see whether the required combustion temperatures are achieved and the concentration of CO2 and N are reduced.
1.3.3 To make justification by comparing the results from simulation with gas analyzer results
Considering the global warming condition and the mass abundant of biomass resources available in Malaysia nowadays, this study is a relevant effort to be done.
CHAPTER 2
LITERATURE REVIEW
2.0 LITERATURE REVIEW 2.1 Biomass
Biomass can be defined as a renewable energy source, is biological material from living, or recently living organisms, such as wood, waste, (hydrogen) gas, and alcohol fuels. Biomass is carbon, hydrogen and oxygen based. Nitrogen and small quantities of other atoms, including alkali, alkaline earth and heavy metals can be found as well [1].
2.1.1 Biomass carbon cycle
The combustion (direct or indirect) of biomass as a fuel returns CO2 to the atmosphere. However, this carbon is part of the current carbon cycle where it was absorbed during the growth of the plant over the previous few months or years and, provided the land continues to support growing plant material, a sustainable balance is maintained between carbon emitted and absorbed.
Figure 2.1: Biomass from trees carbon cycle [2]
Figure 1.2 above shows a carbon cycle by using biomass from harvested trees as the example. The amount of carbon in the atmosphere is balanced by going through this cycle:-
Figure 2.2: Biomass carbon cycle [2]
2.1.2 Advantages of using biomass
Biomass utilization brings a lot of benefits and advantages. Some of them are as describe and explained below:-
2.1.2.1 Renewable Energy Sources
Renewable energy is energy which comes from natural resources such as sunlight, wind, rain, tides, and geothermal heat, which are renewable (naturally replenished) [4]. The biomass energy source is considered to be the renewable energy source because biomass is mainly obtained from plants where they are always available [5].
2.1.2.2 Reduced Greenhouse Effect [5]
Burning of biomass fuels does releases CO2 gases just like the burning of fossil fuels.
However, fossil fuels CO2 gases are lying in the latent state since millions of years and their release in present times leads to the overall increase in the CO2 content of the atmosphere. On the other hand, biomass is the plant material generated recently hence the CO2 gas is lying dormant in it as the plant grows. CO2 from the fossil fuels is new for the earth, while CO2 from biomass is part of the growth of the plant in
(a)
As trees grow, they absorb carbon dioxide from the atmosphere.
(b) During photosynthesis the
trees released oxygen to the atmosphere.
(c) At harvest, the
woodfuel is transported to the
power plant.
(d) Carbon produced from burning woods
combine with oxygen to produce carbon dioxide and emitted back to the
atmosphere.
present times. Thus the burning of fossil fuels adds new CO2 to the atmosphere while burning of biomass balances the CO2 absorbed by the plants during its growth [5].
2.1.2.3 Indigenous Fuels and Are Widely Available
The fuels from biomass materials can be produced indigenously and no high technology is required for it. Further, the biomass materials are available in almost all the countries. Producing the fuel from biomass materials reduces the dependence of the country on foreign resource for their fuel requirements [5].
2.1.2.4 Reduced Animal, Food Processing and Municipal wastes
Anaerobic digestion which is a series of processes in which microorganisms break down biodegradable material in the absence of oxygen is used to convert wastes from livestock, food processing and households into energy [6]. Using this biomass as energy can yield the following benefits: production of heat or electricity, odour reduction, reduced risk of water contamination, and reduced exposure to disease- causing organisms [7].
2.1.2.5 Reduced Risk of Wildfire
The risk of catastrophic wildfire can be reduced by removing small diameter trees that act as a fuel for the flames. The removal of trees is a labour intensive and costly process, but the use of these biomass materials can create a market outlet and thereby help defer the costs of forest thinning activities [7].
2.1.2.6 Improved Watershed Quality
Reducing waste flows from livestock, food processing and city sanitation services can contribute to improved water quality. Preventing wildfires can improve water quality. Wildfires reduce the ability of soil to absorb water which leads to increased debris and sediments in the riparian area [7].
2.1.2.7 Economic and Social Benefits
Biomass benefits include creation and retention of local jobs in a rural economy. For biomass power systems, it is estimated that six full time jobs are created for each MW of installed capacity. Depending upon the capacity, this employment figure includes 15 to 20 or more personnel at the power plant and the balance of people hold jobs in fuel processing and delivery. For corn-based ethanol plants, 100 jobs per year would be created for a 15 million gallon/year facility. More than 66,000 jobs are supported by the biomass producing industry in the United States [7].
2.1.2.8 Clean environment
The biomass material is the waste generated by the plants, animals and human beings. It includes lots of municipal waste, garbage, paper water, industrial scrap etc.
Using biomass as the fuel not only gives us the energy but also helps remove the garbage from the surroundings and keep the surroundings clean [5].
2.1.3 Disadvantages of using biomass
Despite all the advantages of using biomass as alternative fuel, there is also a list of disadvantages occurring from the utilization of this matter to produce energy. They are as listed and described below:-
2.1.3.1 Greenhouse gases produced by burning
Burning of biomass do produces greenhouse gases and contributes to global warming. Exhaust gas cleaning technology must be applied to biomass energy plants to make them truly environmentally-friendly [8].
2.1.3.2 Expensive to plant, harvest and process
It requires more cost and energy to plant, harvest and process the raw materials than it is worth to get a net energy gain especially when considering the large volumes required compared to fossil fuels [8]. The cost of installing and maintaining the
infrastructure for processing the biomass is also very expensive. It involves making infrastructure for collecting, processing, and then purifying the biofuel [9]. It also takes up more water from the earth and other fossil fuels to make the fertilizers and fuels for planting and harvesting, thus supposedly, takes up more land for the crops and trees.
2.1.3.3 Biomass crops not available all year (some cases)
Corn, wheat, barley and the like are seasonal crops. They are not available all year.
Trees are also a slow growing resource even though they are renewable. This would also tend to be a negative on the side of biomass fuels [10].
2.1.3.4 Large scale crops production requires vast areas of land and water
Biomass energy depends largely on grown crops. If bio-fuels are to replace fossil fuels to a significant extent, these grown crops will take up huge tracts of land. It also takes up more water from the earth and other fossil fuels to make the fertilizers and fuels for planting and harvesting, thus supposedly, takes up more land for the crops and trees. Consequently, land might be deforested to clear those areas first. Those lands are in fact needed for feeding the growing population of billions of people [8].
2.1.3.5 Low energy produced
Biomass fuels usually have lower fuel economy than normal fossil fuels. They are not able to generate enough energy efficiently [9].
2.2 Coal
Coal is a readily combustible black or brownish-black sedimentary rock normally occurring in rock strata in layers or veins called coal beds or coal seams. The harder forms, such as anthracite coal, can be regarded as metamorphic rock because of later exposure to elevated temperature and pressure. Coal is composed primarily of carbon
along with variable quantities of other elements, chiefly sulphur, hydrogen, oxygen and nitrogen [11].
The fossil fuel, is the largest source of energy for the generation of electricity worldwide, as well as one of the largest worldwide anthropogenic sources of carbon dioxide emissions. Gross carbon dioxide emissions from coal usage are slightly more than those from petroleum and about double the amount from natural gas. Coal is extracted from the ground by mining, either underground by shaft mining through the seams or in open pits.
2.2.1 Types of coal
As geological processes apply pressure to dead biotic material over time, under suitable conditions it is transformed successively into [11]:-
2.2.1.1 Peat
Considered to be a precursor of coal, has industrial importance as a fuel in some regions, for example, Ireland and Finland. In its dehydrated form, peat is a highly effective absorbent for fuel and oil spills on land and water.
2.2.1.2 Lignite
Also referred to as brown coal, is the lowest rank of coal and used almost exclusively as fuel for electric power generation. Jet is a compact form of lignite that is sometimes polished and has been used as an ornamental stone since the Iron Age.
Lignite can be separated into two types. The first is xyloid lignite or fossil wood and the second form is the compact lignite or perfect lignite [12].
2.2.1.3 Sub-bituminous coal
The properties of this coal range from those of lignite to those of bituminous coal and are used primarily as fuel for steam-electric power generation. Additionally, it is an important source of light aromatic hydrocarbons for the chemical synthesis industry.
2.2.1.4 Bituminous coal
A dense mineral, black but sometimes dark brown, often with well-defined bands of bright and dull material, used primarily as fuel in steam-electric power generation, with substantial quantities also used for heat and power applications in manufacturing and to make coke.
2.2.1.5 Steam coal
The grade is between bituminous coal and anthracite, once widely used as a fuel for steam locomotives. In this specialized use it is sometimes known as sea-coal. Small steam coal (dry small steam nuts or DSSN) was used as a fuel for domestic water heating.
2.2.1.6 Anthracite
The highest rank; a harder, glossy, black coal used primarily for residential and commercial space heating. It may be divided further into metamorphically altered bituminous coal and petrified oil, as from the deposits in Pennsylvania
2.2.1.7 Graphite
Technically the highest rank, but difficult to ignite and is not so commonly used as fuel: it is mostly used in pencils and, when powdered, as a lubricant.
The classification of coal is generally based on the content of volatiles matter.
2.3 Co-firing
Co-firing can be defined as simultaneous combustion of different fuels in the same boiler, provides one alternative to achieve emissions reduction [13]. This is not only accomplished by replacing fossil fuel with biomass, but also as a result of the interaction of fuel reactants of different origin, e.g. biomass and coal. The fuels used can be solid fuels, liquid fuels or gaseous, and its nature either fossil or renewable.
Co‐firing also creates less air pollution than power generation using fossil‐based fuels alone. There are basically three options for co-firing: direct, indirect and parallel co-firing. Direct co-firing is combustion of biomass together with fossil fuel in a single combustion chamber. Indirect co-firing means combustion of fossil fuel
with previously gasified biomass, and parallel co-firing requires at least two boilers as biomass is burned in one and fossil fuel in another [14].
2.3.1 Direct co-firing method
In this configuration, biomass (as a secondary fuel) is included along with coal (as the primary fuel) into the same boiler. Direct co-firing is commonly used because the of the lower operation cost. Direct co-firing method can be done in two ways. The first is the mixing and pre-treatment of biomass and coal are carried out together before being fed into the burner. Secondly, pre-treatment of biomass and coal are conducted separately, and then fed into the burner [14]. In addition, there are also two types of direct co-firing method which are co-milling and direct injection method. The bio-briquettes sample was processed using the co-milling direct co- firing method [15].
Figure 2.3: Direct Co-firing [13]
Figure 2.3 shows an example of direct co-combustion in CFB furnace. Coal and biomass are blended together in the fuel handling system and fed into the boiler.
Biomass
Coal Combustion
2.3.2 Indirect co-firing method
Indirect co-firing configuration refers to the process of biomass gasification, where the gas is then fed into the burner and burned along with coal. This is also called indirect co-combustion with pre-gasification. By using this configuration, the ashes from biomass will be separated from the coal ashes with the capability of maintaining high ratio of co-firing. The only disadvantage of this method is the high investment cost [14]. Figure 2.4 below shows the configuration for the indirect co- combustion with pre-gasification. Initially, biomass is gasified by burning it at high temperature. Then the gas state biomass is used and burned with coal in the gas-fired boilers as shown in the right hand side of the picture.
Figure 2.4: Indirect Co-firing with Pre-gasification [13]
2.3.3 Parallel co-firing method
Parallel co-firing method involves separate burners and boilers for biomass. The burned biomass will generate steam which will then be used on coal burning power plant circuit. Although this configuration requires a larger investment than direct co- firing, this configuration has the advantage of capability to use fuel with alkali metal and high chlorine content. Besides, ash from the burning of coal and biomass will also be produced separately (refer Figure 2.5) [14]:-
Figure 2.5: Parallel Co-firing [13]
2.3.4 Advantages of co-firing
Since burning biomass is carbon neutral, co-firing reduces the amount of greenhouse gases that are released. At the same time, co-firing can be used to lower the emission of some pollutants. For example, coal co-firing with biomass results in less sulphur emissions than burning coal by itself. The main advantage of co-firing is that it can be done in existing power plants with little or no modification, allowing for comparatively inexpensive and rapid reductions in greenhouse gases [14].
CHAPTER 3 METHODOLOGY
3.0 METHODOLOGY
As describe the scope of studies, this project consists of four stages that have been completed which are:
Analyze ultimate and proximate analysis and calorific value results,
Run modelling and simulations for combustion using GAMBIT and FLUENT software,
Prepare samples and perform gas analyzer experiments
Compare the results obtained and provide justification
Thermogravimetric Analysis (TGA), carbon, hydrogen, nitrogen, sulphur (CHNS- 932) and bomb calorimeter were used to obtain the proximate and ultimate analysis, and calorific value results, respectively. Then, modelling and simulations of the combustion process were done using GAMBIT and FLUENT software and followed by gas analyzer experiments for final comparison and justification. The description and procedure for each tool, machine and software is discussed later in this chapter.
3.1 Project Activities and Milestone
Details/Week1234567891011121314 Project Work Continues :- Obtain Brown coal, palm shell and fibre samplesXXX :- Process samples into fine powder samples :- Collect TGA, CHNS and Calorific Value data from Supervisor :- Analyze and examine gathered data Submission of Progress Report 1X Project Work Continues :- Work on modelling and simulationsXXX :- Perform gas analyzer experiment Submission of Progress Report 2X SeminarX Project Work Continues :- Continue working on simulationsXXXXXXXX :- Provide comparison and justification Poster ExhibitionX Submission of Dissertation DraftX Oral PresentationDuring Study Week Submission of Dissertation (Hardbound)7 days after oral presentation
3.2 Work Flow
Provide justification and conclusion Perform gas analyzer experiments
Prepare samples according to the decided composition:- Case 1:Coal
(100% Brown Coal)
Case 2: Palm waste briquette (60% shell + 40% fibre)
Case 3: Bio-briquette (50% coal + 50% palm waste
briquette)
Run combustion modelling and simulations using Computational Fluid Dynamics (CFD) method
GAMBIT FLUENT
Acquire and analyze data resulted from experiments:-
TGA - Proximate Analysis CHNS - Ultimate Analysis Bomb calorimeter - Calorific Value
Obtain raw materials to prepare the samples
Palm waste - shell and fibre Brown coal
Perform researchs and studies mainly on biomass and co-firing.
Thesis, Final Year Project reports, Internet, Books, Journals,
3.3 Tools, Machines and Software Used
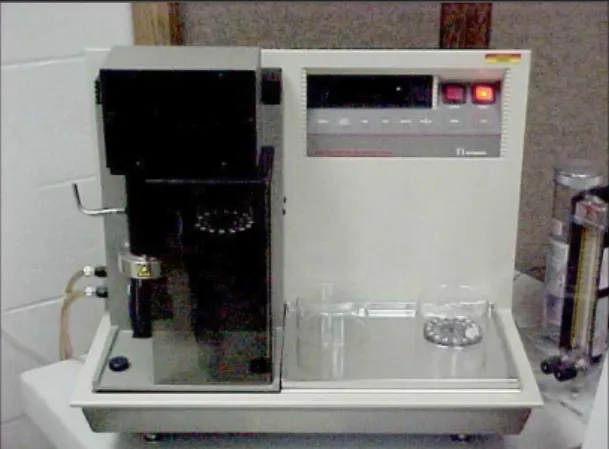
3.3.1 Thermogravimetric Analysis (TGA)
Thermogravimetric analysis or thermal gravimetric analysis (TGA) is a type of testing that is performed on samples to determine changes in weight in relation to change in temperature [16]. The output will gives a plot of weight loss (%) versus temperature or time. In this project, TGA is used to analyze biomass and coal to obtain the proximate analysis which gives the weight percentage of moisture, volatile matter, fixed carbon and ash. Figure 3.1 shows an example of a TGA unit.
Figure 3.1: Thermal Gravimetric Analyzer (TGA) module
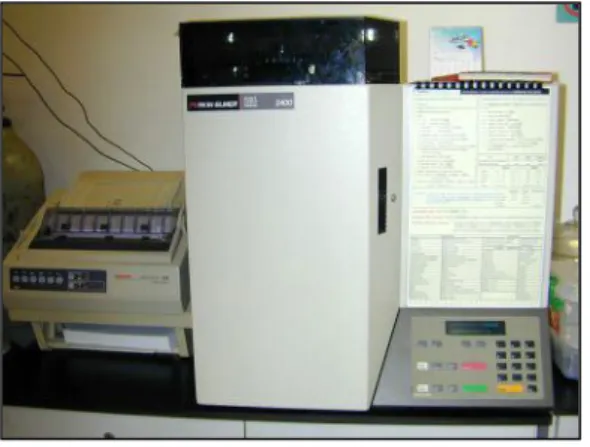
3.3.2 CHNS-932 Analyzer
A CHNS Analyzer is a scientific instrument which can determine the elemental composition of a sample. The analyzer uses a combustion process to break down substances into simple compounds which are then measured [17]. By using this device, organic carbon in a sample can also be measured by separating out inorganic carbon using a solvent. This equipment gives the Ultimate analysis of the samples which consists of the weight percentages of Carbon, Hydrogen, Nitrogen, and Sulphur composition in the solid fuel. Figure 3.2 shows a picture of CHNS-932 analyzer.
Figure 3.2: CHNS-932 Analyzer
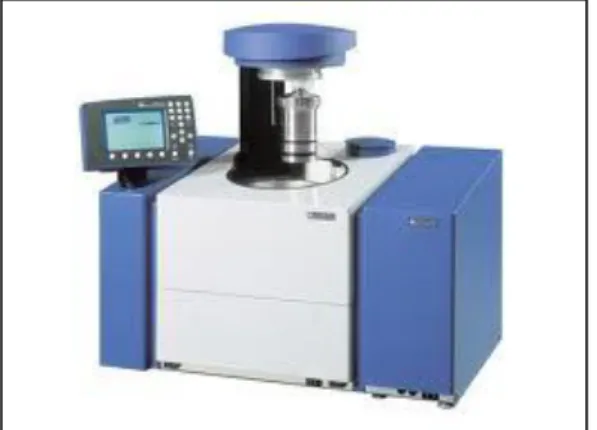
3.3.3 Bomb Calorimeter
A bomb calorimeter is a type of constant-volume calorimeter used in measuring the heat of combustion of a particular reaction [18]. Bomb calorimeters have to withstand the large pressure within the calorimeter as the reaction is being measured.
Electrical energy is used to ignite the fuel; as the fuel is burning, it will heat up the surrounding air, which expands and escapes through a tube that leads the air out of the calorimeter. When the air is escaping through the copper tube it will also heat up the water outside the tube. The temperature of the water allows for calculating calorie content of the fuel. In this project, it is used to calculate the High Heating Value (HHV) content of the fuel. Figure 3.3 shows an example of bomb calorimeter unit.
Figure 3.3: Bomb calorimeter
3.3.4 Gas Analyzer
It is used to analyze the gases combusted from co-firing from a bomb calorimeter. It can analyze and measure HC, CO, CO2, O2, NOx (5 gas version), and Air Fuel ratio.
The picture and steps to operate this equipment is incorporated in Appendix A.
3.3.5 Computational Fluid Dynamics (CFD)
Computational fluid dynamics (CFD) is a branch of fluid mechanics that uses numerical methods and algorithms to solve and analyze problems that involve fluid flows [18]. The first step in CFD is called pre-processing. It involves building and analyzing a flow model within a computer-aided design (CAD) package, creating and applying a suitable computational mesh, and entering the flow boundary conditions and fluid material properties. Next step is solving by using calculations based on the mesh and produces the results required in the analysis. Final step is post-processing where it involves the organization and interpretation of the results.
3.3.6 GAMBIT 2.4.6
GAMBIT is a state-of-the-art pre-processor for engineering analysis. With advanced geometry and meshing tools in a powerful, flexible, tightly-integrated, and easy-to- use interface, GAMBIT can dramatically reduce pre-processing times for many applications [19]. GAMBIT is used to model the burner and meshed it to smaller quadrilaterals cells to enable the solver to compute data at the area.
3.3.7 FLUENT 6.3.2.6
FLUENT is a powerful and flexible general-purpose CFD package used for engineering simulations of all levels of complexity [20]. It offers a comprehensive range of physical models that can be applied to a broad range of industries and applications. The meshed files from GAMBIT are exported to FLUENT software for combustion modelling because of the availability of parameters.
CHAPTER 4
RESULTS & DISCUSSIONS
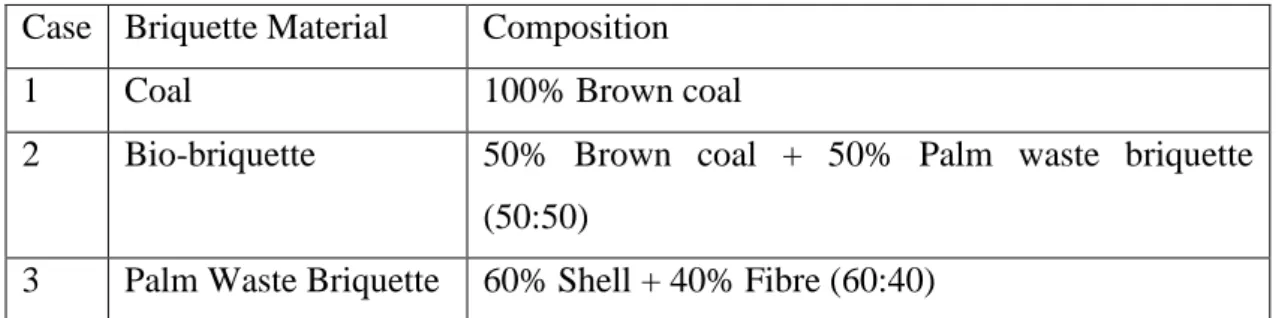
4.0 RESULTS & DISCUSSIONS 4.1 Samples details
The raw materials of the samples (i.e. palm shell and fibre) were collected from Felcra Nasaruddin, Bota and the coal from Tenaga Nasional Berhad (TNB) Janamanjung power plant. The samples were then dried in an oven, granulated using Granulator and crushed using Rocklabs to produce fine powder samples. These powder samples then were blended together according to the percentage of the three cases decided in the early stage of the project as shown in Table 4.1 below:-
Table 4.1: Cases of study Case Briquette Material Composition
1 Coal 100% Brown coal
2 Bio-briquette 50% Brown coal + 50% Palm waste briquette (50:50)
3 Palm Waste Briquette 60% Shell + 40% Fibre (60:40)
One method of upgrading loose residue material to improve their handling and or combustion properties is by densification into pellets or briquettes of higher density than original bulk density of the material. It has been noted that, there is marked improvement in combustion characteristics of densified biomass residue (DBR) compared to loose biowaste. DBR's have been reported to have superior and comparable combustion characteristics to wood-based fuels [21].
The palm shell and fibre powder samples were then densified into briquettes under moderate pressure in a hydraulic press. Experiments were carried out to determine the chemical and mechanical properties of the samples. TGA was used to obtain the proximate analysis such as the degradation temperature, solvent residues and percentage of ash content. For ultimate analysis, CHNS-932 was used to get the composition in weight percentage of carbon, hydrogen, nitrogen, and sulphur gases.
Bomb calorimeter experiments were also performed to obtain the calorific value of
the samples followed by experiments to determine the mechanical properties of the samples such as the impact, compressive strength etc. From those experiments, Palm Waste Briquette and Bio-briquette samples were found to have good chemical and mechanical properties.
4.2 Analysis of experimental results 4.2.1 Proximate analysis
The weight percentages of the samples content (i.e. moisture, volatile matter, fixed carbon and ash) are extracted from TGA graphs acquired from the experiments.
Figure 4.1 below shows column chart with components composition for each case.
Tabulated forms of the results are incorporated in Appendix B.
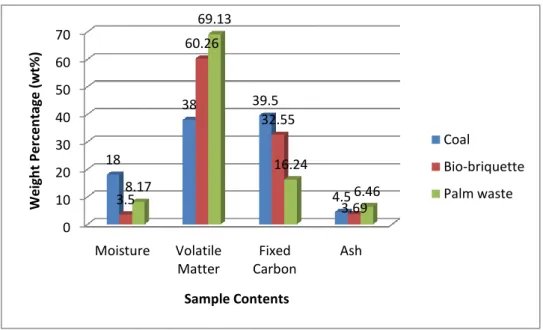
Figure 4.1: Proximate Analysis results
The result shows that fixed carbon content which is the main component of greenhouse gases CO2 is highest in coal when compared with palm waste and bio- briquette. So initial assumption made is that burning 100% coal will produce the most CO2 compared with the other two cases. When comparing the ash content of those three samples, it shows that palm waste has the highest percentage. According to Soraya (2008), usually ashes from combustion are sold and used, but in biomass firing, the ashes produced are in large quantity but low quality. Thus, they cannot be
0 10 20 30 40 50 60 70
Moisture Volatile Matter
Fixed Carbon
Ash 18
38 39.5
3.5 4.5
60.26
32.55
3.69 8.17
69.13
16.24 Weight Percentage (wt%) 6.46
Sample Contents
Coal
Bio-briquette Palm waste
sold for profit. Therefore, the percentage of biomass burned with the coal for co- firing need to be controlled to produce high quality ashes. There is also an increasing trend in the amount of volatile matter. It shows that the volatile matter is increasing with a reduction of coal percentage in the mixture.
4.2.2 Ultimate Analysis
The results obtained for ultimate analyses were converted to bar charts in Figure 4.2 for better interpretation. Tabulated forms of the results are incorporated in Appendix B.
Figure 4.2: Ultimate Analysis results
Based on the results, it shows that there is downward trending of carbon, nitrogen and sulphur contents proportional to a reduction in the percentage of coal in the samples. Those three gases are the main content of GHG, so the amount of GHG produced will be reduced by increasing the percentage of coal in the fuel.
4.2.3 Calorific value analyses
The results for calorific value are analyzed using bar chart as shown in Figure 4.3 below. Tabulated form of the results can be obtained from Appendix B.
0 10 20 30 40 50 60 70
C H N S O
61.81
4.647
1.117 0.53
9.396 52.96
4.803 0.894 0.177
33.976 45.7
6.229
0.806 0.113
32.522
Weight percentage (wt%)
Coal
Bio-briquette Palm waste
Figure 4.3: Heating Values
The values obtained from Bomb Calorimeter experiments were in calorific value (cal/g), so those values are converted into heating value (J/g) for discussion purposes.
The values are converted by multiplying the calorific values with 4.184 since 1 cal/g
= 4.184 J/g. According to the graph, the lower percentages of coal in the mixtures make the heating values lower. This also proves that lesser amount of coal in the mixture will contribute to lower heat content, thus reducing the combustion temperature. Consequently, the steam produced will not be able to produce the required power for optimum electricity generation in power plants.
4.3 FLUENT Simulations
4.3.1 2 Dimensional (2D) Modelling of the furnace
A single burner was modelled using GAMBIT software in order to model the flame occurring. The model created was adapted from a real coal power plant in TNB Kapar, Selangor and the real dimensions of the furnace were approximately given by [22]:-
Height: 11m
Width: 7m
Length: 9m
0 5000 10000 15000 20000 25000
23012 22570
18556
Heating value (J/g)
Coal Bio-briquette Palm waste
The model of the furnace was then simplified and created using a control volume of 7m by 1.45m [22]. The model of the burner is shown in Figure 4.4 below:-
Figure 4.4: Dimension of control volume adapted for modelling [22]
After meshing 101140 faces, the mesh produced was as shown in Figure 4.5 below.
Figure 4.5: Model of the meshed burner and combustion chamber in GAMBIT 2.4.6
4.3.2 Modelling with FLUENT
Due to the limitation to the chemical database for solid fuels in FLUENT, a modified definition of the fuel mixture was made to allow the solver performing the calculations needed. The definition of fuel was made by first creating a pre- Probability Density Function (pre-PDF) file where the file consists of the concentration of fuel being fed at the burner.
7000mm
1450m m 500mm
450mm
80mm
Conditions applied to the pre-PDF files such as temperatures used were according to the parameter suggested by Borman (1998). The temperatures which were defined were the temperature of fuel at 373K, oxidizer at 613K and the secondary air to be preheated to 500K [22].
In FLUENT, the k-epsilon equation was utilised because the mixture of fuel and air is assumed to be fully turbulent and the effects of molecular viscosity are negligible [22]. The fuel inlet was set by definition of injection, but since the properties of the fuel used is unavailable in the definition of injections, medium volatility coal was assumed with its thermodynamic properties altered to suit the samples. The data used were tabulated in table form in Appendix B. The particles are also assumed to be in spheres shapes.
4.3.3 Results from FLUENT 4.3.3.1 Temperature profiles
The results from the contour of static temperature for those three cases are shown in the figures below:-
Figure 4.6: Static Temperature (Coal)
Figure 4.7: Static Temperature (Bio-briquette)
Figure 4.8: Static Temperature (Palm-waste briquette)
4.3.3.2 Discussion
According to Lee (2004), the optimum temperature in power plant’s combustion chamber or furnace should be above 2000K. From the modelling the combustions obtained, it shows that 100% coal and the 50-50 mixture of coal and biomass manage to achieve the required temperature where the temperatures are 2120K and 2100K,
respectively but the highest temperature obtained by for palm waste briquette which consists of 100% biomass is 1750K, which did not achieve the optimum temperature.
Basically, the temperature decreases with the increase in biomass percentages. This is due to the high moisture and volatility of biomass which reduces the flame temperature of fuel rich zone [22]. The summary of the contour plots of static temperature is shown in Figure 4.8 below, which clearly shows the downward trending:-
Figure 4.9: Summary of Contour Plots of Static Temperature
4.3.3.3 Carbon Dioxide Concentration
Figures below shows the modelling results for CO2 concentration for all three cases:-
Figure 4.10: Carbon Dioxide Concentration (Coal)
0 500 1000 1500 2000 2500
21202100 1750
Temperature (K)
Coal
Bio-briquette Palm waste
Figure 4.11: Carbon Dioxide Concentration (Bio-briquette)
Figure 4.12: Carbon Dioxide Concentration (Palm waste briquette)
4.3.3.4 Discussion
The concentration of CO2 produced is reduced with the reduction of coal percentages. This is because coal is a high carbon content matter compared to biomass, so the formation of CO2 will also increase. In this case, the simulation of 100% palm waste produced the lowest amount of CO2 concentration. This might be
the most ideal solution to solve the excessive emission of CO2, but it is not capable of achieving optimum required temperature for power plant’s furnace (above 2000K). This is why coal co-firing with biomass is introduced. The combustion of both coal and biomass such as the bio-briquettes manages to satisfy the requirements to achieve the required temperature and reduce the amount of CO2 produced. From the simulations, coal burning shows 5.70x10⁻³ kmol/m3 molar concentration of CO2, while bio-briquette and palm waste burning give 4.11x10⁻³ and 3.53x10⁻³ kmol/m3, respectively. Figure 4.12 summarizes the CO2 concentration results for blending from 100% coal to 100% biomass and clearly shows the downward trending:-
Figure 4.13: Summary of Carbon Dioxide Concentration results
4.3.3.5 Nitrogen Concentration
Figures below show the simulation results for Nitrogen concentration.
Figure 4.14: Nitrogen Concentration (Coal)
0.00E+00 2.00E-03 4.00E-03
6.00E-03 5.70E-03 4.11E-03
3.53E-03
Molar Concentration of CO2 (kmol/m3)
Coal
Bio-briquette Palm waste
Figure 4.15: Nitrogen Concentration (Bio-briquette)
Figure 4.16: Nitrogen Concentration (Palm waste briquette)
4.3.3.6 Discussion
Nitrogen concentration also shows downward trending with increasing biomass percentages and reduction in coal percentages. The reduction in the concentration of nitrogen will basically reduce the amount NOx produces since there will be lesser
amount of nitrogen atoms which is able to react with oxygen to form NOx in spite of forming due to high combustion temperature [22]. From the simulations, coal burning shows 1.23x10⁻¹⁰ kmol/m3 molar concentration of N, while bio-briquette and palm waste burning give 7.00x10⁻¹¹ and 5.15x10⁻¹¹ kmol/m3, respectively. Figure 4.16 below summarizes the Nitrogen concentration results from simulation for the 3 types of samples used:-
Figure 4.17: Summary of Nitrogen Concentration results
4.4 Gas Analyzer Results 4.4.1 Results
In order to verify and prove the reliability of the results obtained from the simulations, those results are compared with the results acquired from experiments using bomb calorimeter and gas analyzer. The graph in Figure 4.17 below shows the results of gas analyses and the tabulated data are incorporated in Appendix C.
0.00E+00 2.00E-11 4.00E-11 6.00E-11 8.00E-11 1.00E-10 1.20E-10
1.40E-10 1.23E-10
7.00E-11
5.15E-11
Molar Concentration of N (kmol/m3)
Coal
Bio-briquette Palm waste
Figure 4.18: Gas Analyzer results
4.4.2 Discussion
Based on Figure 4.17, it shows that percentage volume of CO2 and NOx concentration decrease with the reduction of coal percentages. This is basically due to less carbon and nitrogen elements in palm fibre and shell used as biomass. This data also verify the reduction of CO2 and Nitrogen concentration shown in the simulations. From gas analyzer experiments, coal burning shows 32.46% vol and 83ppm NOx, bio-briquette burning shows 25.38% vol and 46ppm NOx, while palm waste briquette burning gives 22.83%vol and 33ppm NOx. From the simulations, the reduction of CO2 from bio-briquette to palm waste briquette is 8.38% while the gas analysis shows a reduction of 11.17%. For NOx, the reduction shows in the simulation from bio-briquette to palm waste briquette is 26.43 % and gas analyzer gives a reduction of 28.26%. The calculations are available in Appendix C. For more accurate results, the emissions of both gases need to be examined more thoroughly with higher precision of gas analyzer settings.
The comparison for Nitrogen content is actually more complicated than CO2 content due to various factors affecting the NOx emission. NOx refers to all oxides of nitrogen. According to Lee (2004), the formation of NOx relies solely on the temperatures and the availability of unused oxygen. There are three types of formation of NOx which are:-
0 10 20 30 40 50 60 70 80 90
32.46
83
25.38
46
22.83
33
%vol / ppm
CO2 (%vol)
Coal
Bio-briquette Palm waste
NOx (ppm)
i) Thermal NOx: formed by the reaction of atmospheric nitrogen and oxygen at high temperatures
ii) Fuel NOx: oxidation of fuel bond nitrogen
iii) Prompt NOx: formed by reaction of hydrocarbon fragments with atmospheric oxygen
Due to some reasons, the results from simulation and experimentation are slightly different. This is basically because:-
i) Simulations were done in perfect condition where they were not influenced by any external factors, whereby experiment considers all the external factors such as the ambient temperature, wind, flame and moisture
ii) The software will simulate based on the input given and so the results would depend a lot on factors such as human errors.
iii) The results are also highly dependent on the accuracy and precision of the equipments used, for example the gas analyzer.
As for time being, the results obtained are enough to prove that FLUENT simulation is reliable to predict the temperature profile, CO2 and NOx emissions concentration.
CHAPTER 5
CONCLUSIONS AND RECOMMENDATIONS
5.0 CONCLUSIONS AND RECOMMENDATIONS 5.1 Conclusions
As for conclusion, the author manages to complete the project and at the same time successfully acquires the objectives stated in the early stages of the project:-
i) It is proven that palm shell and fibre are feasible to be used as fuel for boiler in power plant given that it is co-fired with coal in order to achieve the optimum temperature and at the same time reduces GHG emissions
ii) The modelling and simulations show that coal and bio-briquette burning achieves the required combustion temperature, and bio-briquette reduces the CO2 and NOx emissions concentrations. While palm-waste briquette burning unable to achieve the required temperature but reduces the amount of CO2
and NOx emissions concentrations significantly.
iii) Based on the comparison on the percentage of reduction between results from simulations with gas analyzer results, the best candidate to be used as boiler fuel is bio-briquette. Although it reduces the temperature in combustion chamber, it is still in an acceptable range considering its contribution in reducing the CO2 and NOx emissions concentrations.
5.2 Recommendations
For future studies, it is recommended to consider the effects of different particle sizes and shapes other than spherical shape assumed in this project, to the chemical, mechanical properties, calorific values and also to the temperature profile and carbon dioxide and nitrogen concentrations. Besides, further studies could also consider increasing the range of ratio used for the samples, thus a better solution and justification can also be made. Finally, it is also recommended to research the feasibility of other types of biomass that can be utilized as supplement medium in coal co-firing power plants.
CHAPTER 6 REFERENCES
[1] Biomass. (n.d). Retrieved on 18 October 2010, from http://en.wikipedia.org/wiki/Biomass
[2] Biomass Energy Centre. (n.d). Retrieved on 18 October 2010, from
http://www.biomassenergycentre.org.uk/portal/page?_pageid=73,1&_dad=portal&_s chema=PORTAL
[3] Hassan, M. A. Yacob, S (2007), Biomass Utilization in Malaysia: Current Status of Conversion of Biomass into Bioproducts,Universiti Putra Malaysia.
[4] Renewable Energy. (n.d). Retrieved on 19 October 2010, from http://en.wikipedia.org/wiki/Renewable_energy
[5] Khemani H (2008). Advantages of Using Biomass Energy Source. (September 5, 2008). Retrieved on 19 October 2010 , from
http://www.brighthub.com/engineering/mechanical/articles/6465.aspx [6] Anaerobic Digestion. (n.d). Retrieved on 19 October 2010, from http://en.wikipedia.org/wiki/Anaerobic_digestion
[7] Benefits of Using Biomass. (n.d) Retrieved on 19 October 2010, from http://www.emnrd.state.nm.us/emnrd/biomass/benefits.html
[8] Alternate Energy Sources. (n.d) Retrieved on 19 October 2010, from http://www.alternate-energy-sources.com/disadvantage-of-biomass.html [9] Biomass Energy Disadvantages.(n.d) Retrieved on 19 October 2010, from http://www.buzzle.com/articles/biomass-energy-disadvantages.html
[10] Alternate Energy Disadvantages. (n.d) Retrieved on 19 October 2010, from http://www.alternative-energy-resources.net/biomass-energy-disadvantages.html [11] Coal. (n.d) Retrieved 24 October 2010, from http://en.wikipedia.org/wiki/Coal [12] Lignite. (n.d) Retrieved 24 October 2010, from
http://en.wikipedia.org/wiki/Lignite
[13] Patumsawad S. (2007), Co-firing Biomass with Coal for Power Generation, King Mongkut’s Institut of Technologym North Bangkok, Thailand.
[14] Co-firing Batubara Dengan Limbah Biomassa, (2009). Retrieved on 26 October 2010, from http://majarimagazine.com/2009/06/co-firing-batubara-dengan-limbah- biomassa/
[15] Chin, Y. S. (2005). Energy from Waste-development of Alternative Fuel Briquettes from Agricultural Waste. Degree Thesis, Universiti Teknologi PETRONAS, Malaysia.
[16] Thermogravimetric Analysis. (n.d) Retrieved 26 October 2010, from http://en.wikipedia.org/wiki/Thermogravimetric_analysis
[17] CHN Analyzer. (n.d) Retrieved 26 October 2010, from http://en.wikipedia.org/wiki/CHN_analyzer
[18] Soraya, A.R. (2008). A Study on Co-firing Empty Fruit Bunches (EFB) with Coal as Potential Fuel. Degree Thesis, Universiti Teknologi PETRONAS, Malaysia.
[19] GAMBIT. (n.d) Retrieved on 26 October 2010, from
http://www.supercomputing.it/At_Cilea/soft_fluent/gambiteng.htm
[20] Complete Product Portfolio for Simulation Driven Product Development. (n.d) Retrieved on 26 October 2010, from http://www.fluent.com/software/index.htm [21] Z.Husain, Z. Zainac, Z.Abdullah. Briquetting of palm fibre and shell from the processing of palm nuts to palm oil. School of Mechanical Eng., Universiti Sains Malaysia, Vol.22, Issue 6, June 2002. Retrieved on 28 October 2010 from
http://www.sciencedirect.com/science?_ob=ArticleURL&_udi=B6V22-455VKW7- 4&_user=1196560&_coverDate=06%2F30%2F2002&_rdoc=1&_fmt=high&_orig=s earch&_origin=search&_sort=d&_docanchor=&view=c&_searchStrId=1550118661
&_rerunOrigin=google&_acct=C000048039&_version=1&_urlVersion=0&_userid=
1196560&md5=b3d0aa57a0147ec801a9057c989eef8e&searchtype=a
[22] Lee, V.H. (2004). Co-firing of Rice Husk for Electricity Generation in Malaysia.
Degree Thesis, University of Southern Queensland, Australia.
[23] Brian Birmingham. How to Use A Gas Analyzer (December 2, 2010) Retrieved on 8 December 2010, from http://www.ehow.com/how_7587600_use-gas-
analyzer.html.
CHAPTER 7 APPENDICES
Appendix A: Steps to Operate Gas Analyzer [23]
1. Plug the PowerLab (a data acquisition system that records the information picked up by the gas analyzer) into the computer. Plug the gas analyzer into the PowerLab by plugging the BNC chords and the I2C chord into the appropriate outlets.
2. Check the exhaust ports of the gas analyzer to make sure they are clear of any obstruction and turn on the analyzer. Lights should come on to indicate that it is on. To make sure the internal pump is functioning properly, flick the pump on switch so its indicator is on and the pump is heard. Allow the gas analyzer to warm up for 10 minutes.
3. Turn on the PowerLab and open the Lab Chart. The status indicator on the gas analyzer will glow green.
4. Select CO2 or O2 from the proper channel pop-up menu to preview the gas analyzer's signal. The CO2 or O2 dialog box will appear.
5. Record data in absolute or difference mode. Difference mode will record changes in gas concentration from ambient levels.
6. Click "Units" to open the Units Conversion dialog box. Enter different values depending on how you calibrated your gas analyzer. If you did not calibrate it, put in the default units.
7. Record the gas concentration by setting the pump to breathe across rather than directly into the sampling tube. Record your findings in the Lab Chart.
Figure 7.1: Gas Analyzer unit
Appendix B: Results for Proximate, Ultimate Analysis and Calorific Value [15]
Table 7.1: Proximate Analysis (wt%)
Moisture Volatile Matter Fixed Carbon Ash
Coal 18 38 39.5 4.5
Bio-briquette 3.5 60.26 32.55 3.69
Palm waste 8.17 69.13 16.24 6.46
Table 7.2: Ultimate Analysis (wt%)
C H N S O
Coal 61.81 4.647 1.117 0.53 9.396
Bio-briquette 52.96 4.803 0.894 0.177 33.976
Palm waste 45.7 6.229 0.806 0.113 32.522
Table 7.3: Calorific Value (cal/g)
Material 1 2 3 4 Average
Coal 5500 5500 5500 5500 5500
Bio-Briquette 5305.6 5398.7 5395.2 5442.8 5429.5 Palm Waste
Briquette 4434.96 4434.96 4434.96 4434.96 4434.96
APPENDIX C: Constants used for modelling
Table 7.4: Constants used for modelling
Coal Bio-briquette Palm waste
Thermal Conductivity 0.0454
Density 1300 kg/m3
Specific Heat 1000
Volatile Component 38 60.26 69.13
Binary Diffusivity 5 X 10^-4
Particle Emissivity 0.9
Scattering Factor 0.6
Swelling Coefficient 2
Burnout Ratio 2.67
Combustible Fraction 39.5 32.55 16.24
APPENDIX D: Gas Analyzer Results
Table 7.5: Gas analyzer results
Coal Bio-briquette Palm waste
CO2 (%vol) 32.46 25.38 22.83
NOx (ppm) 83 46 33
Gas Analyzer Calculations for Percentage Reduction in Emissions
1. Percentage reduction for CO2 (%) =
Simulations:
[(4.11 x 10⁻³) – (3.53 x 10⁻³)] kmol/m3 x 100% = 16.4%
(3.53 x 10⁻³) kmol/m3 Gas Analysis:
[(25.38) – (22.83)] %vol x 100% = 11.17%
22.83 %vol
2. Percentage reduction for NOx (wt%):
Simulations:
[(7 x 10-11) – (5.15 x 10⁻¹¹)] kmol/m3 x 100% = 26.43%
(7 x 10-11) kmol/m3 Gas Analysis:
[(46) – (33)] ppm x 100% = 28.26%
46 ppm
![Figure 2.1: Biomass from trees carbon cycle [2]](https://thumb-ap.123doks.com/thumbv2/azpdforg/11059498.0/12.892.332.673.728.971/figure-2-1-biomass-trees-carbon-cycle-2.webp)
![Figure 2.2: Biomass carbon cycle [2]](https://thumb-ap.123doks.com/thumbv2/azpdforg/11059498.0/13.892.276.741.105.459/figure-2-2-biomass-carbon-cycle-2.webp)
![Figure 2.3: Direct Co-firing [13]](https://thumb-ap.123doks.com/thumbv2/azpdforg/11059498.0/19.892.354.661.571.935/figure-2-3-direct-co-firing-13.webp)
![Figure 2.4: Indirect Co-firing with Pre-gasification [13]](https://thumb-ap.123doks.com/thumbv2/azpdforg/11059498.0/20.892.298.660.477.826/figure-indirect-co-firing-with-pre-gasification-13.webp)
![Figure 2.5: Parallel Co-firing [13]](https://thumb-ap.123doks.com/thumbv2/azpdforg/11059498.0/21.892.294.717.137.609/figure-2-5-parallel-co-firing-13.webp)