The Changing Educational Gradient in Marriage: Evidence from Malaysia
Siow Li Laia
Abstract: The rising age at marriage and non-marriage has been occurring concurrently with the rising educational level in many developing countries. This paper examines the changing relationship between educational attainment and the marriage rate (per cent ever married) and timing (age at marriage) in Malaysia over the past four decades, using multiple waves of Labour Force Survey data. Bivariate analyses show significant educational differentials in the proportion ever married and mean age at marriage for males and females, across ethnic groups and urban-rural locations. The educational effect on the rate and timing of marriage varied over time. Results from binary logistic regression show that controlling for ethnicity, urban-rural location, and age, the negative educational effect on the rate of marriage has turned positive in recent years.
The change in the direction of the relationship between education and marriage rate was more pronounced for males than for females. The reduction in the educational gradient and a shift from negative to positive effect means that the conventional hypothesis of the education-marriage nexus needs to be re-assessed. The effects of rising education on the rate and timing of marriage should be considered in the implementation of the National Family Policy.
Keywords: Educational level; Marital status; Ever married; Singulate mean age at marriage; Ethnicity.
JEL Classification: I210, J120, J100
a Population Studies Unit, Faculty of Business and Economics, Lembah Pantai, University of Malaya, 50603 Kuala Lumpur, Malaysia. Email : [email protected], ORCID: 0000-0001-9945- 9986
1. Introduction
In developing countries, the marriage institution has undergone dramatic changes in the past few decades (Jones, 1994, 1997, 2005, 2007, 2010;
Jones and Gubhaju, 2009; Jones et al., 2011; Jones et al., 2012; Jones and Yeung, 2014; Leete, 1994). Marriage was almost universal until 1970 when a trend towards delayed and non-marriage emerged (Tsuya, 2001). The rising age at marriage occurred concurrently with rising education in many countries, including Malaysia. The strong positive association between education and age at marriage is well established (Gangadharan and Maitra, 2003; Goldstein and Kenney, 2001; Li and Cheng, 2019; Sabbah-Karkaby and Stier, 2017; Tey, 2007, 2011). Oppenheimer (1997) argued that better- educated women have better opportunities in the labour market than lesser educated women, which reduces their economic need to get married, and perhaps their desire to marry (Dykstra and Poortman, 2010).
The World Development Indicators (World Bank, 2021) show that in many developing countries, males used to have more education than females until the 1990s when the gender gap reversed in favour of females. Between 1980 and 2019, the secondary enrolment ratio in Malaysia rose from 56.0%
to 80.7% for males and 53.4% to 87.0% for females. The gross tertiary enrolment ratio rose from below 10% in the 1980s to over 20% by the late- 1990s, with males outnumbering females. At the turn of the 21st century, more women than men were enrolled in institutions of higher learning, and the gender gap is growing wider. In 2019, the gross tertiary enrolment ratio for females was more than 10 percentage points higher than for males (48.7% compared to 37.7%) (World Bank, 2021).
The age at marriage and non-marriage among Malaysian men and women has risen significantly since 1970, especially among the better educated. Between 1991 and 2000, the singulate mean age at marriage (SMAM) for males rose from 27.9 years to 28.6 years and that for the females from 24.6 years to 25.1 years. While the SMAM for the females continued to rise to 25.7 years in 2010, that of the males declined slightly to 28.0 years (United Nations, 2019). At the same time, the proportion never married for those aged 25-29 years among males and females had increased from 49.0% and 25.9% in 1991 to 54.9% and 29.8% respectively in 2000, but decreased slightly to 53.1% for males in 2010, as opposed to the
continuing rise to 37.8% for females (United Nations, 2019).
The literature shows a changing educational gradient in marriage in recent years, and there are different educational effects for men and women.
This paper examines the changing educational gradient on the rate (as measured by proportion ever married) and the timing of marriage (measured by SMAM) in Malaysia for both males and females across ethnicity and stratum in the past four decades – an era of rapid socio-economic development, social changes, globalisation, and the advent of information technology.
2. Literature Review
Marital patterns have major implications for the society, including population growth, fertility, female labour force participation, inequality in income, ability, and other aspects among families (Becker, 1973). An individual searches for a partner who can maximise his or her well-being, as measured by the consumption of household-produced commodities, which include the quality of meals, quality and quantity of children, prestige, recreation, companionship, love, and health status. The gain from marriage as compared to remaining single is directly linked to income, human capital, the relative difference in wage rates, and the level of non-market-productivity- augmenting variables such as education.
With higher education and economic independence, women tend to set a higher standard for the minimally acceptable match, and this has resulted in delayed marriage and a greater risk of non-marriage, in keeping with the theory of marriage timing (Oppenheimer, 1988). An increasing number of better-educated women chose to pursue a career over family formation (Johnson-Hanks, 2015; Mills et al., 2011), resulting in marriage postponement and childbearing. Furthermore, as women have overtaken men in higher education (World Bank, 2021), many of them would find it increasingly difficult to find a compatible partner if they adhere to the traditional norm of seeking a life partner with at least similar educational background.
Several studies showed that better-educated males and females were no longer more likely to remain unmarried than their lesser-educated counterparts, especially at later ages. The reduction and even reversal of the negative educational gradient in marriage were seen for both males and
females (Cheng, 2014; Fukuda et al., 2020; Kalmijn, 2013; Schoen and Cheng, 2006), with some studies focusing on females (Goldscheider et al., 2001; Goldstein and Kenney, 2001; Heard, 2011; Torr, 2011). Studies also found that the educational effect on age at marriage differs between males and females. Li and Cheng (2019) noticed that better-educated males and females delayed marriage, but the period of marriage postponement was shorter for women. The educational gradient in marriage depends on the socio-cultural context. A study by Kalmijn (2013) in 25 European countries show that for females, the negative effect of education on the marriage rate was evident in countries where gender roles are traditional, but the opposite was true in gender-egalitarian countries; for men, the educational effect on marriage is absent in traditional countries but becomes positive as gender roles become more equal. The relationship between education and marriage was also found to vary over time. The negative relationship between education and marriage for women in the past has turned positive in recent years (Fukuda et al., 2020; Goldstein and Kenney, 2001; Torr, 2011).
Past studies on marriage in Malaysia focused on delayed marriage and/or non-marriage (Brien and Lillard, 1994; Tey, 2007, 2011), or among the females only (Tey, 2009), and very little is known about the effects of educational improvement on the timing and rate of marriage. This paper sought to fill this gap and contribute to a better understanding of the changing marriage trends and patterns in Malaysia, which may reflect the situation in other developing countries.
3. Methodology
This study used data from four waves of the Labour Force Survey (LFS) conducted by the Department of Statistics, Malaysia (DOSM). These surveys elicited information on the marital status and educational level of the population aged 15-64 years. The 30% sample microdata from surveys conducted in 1982, 1997, 2009, and 2018 provided by DOSM was utilised to examine the changing marriage patterns and the educational gradient on the marriage rate and timing over the past four decades. The sampling frame for LFS was based on the listing of enumeration blocks (EBs) in the Household Sampling Frame created for the censuses, covering both urban and rural areas for all administrative districts across the states in Malaysia.
A two-stage stratified sampling design was adopted in the sample
selection. In the first stage, the EBs were selected using the probability proportional to size method. The living quarters (LQs) were chosen from the selected EBs in the second stage, using systematic sampling to ensure an equal probability of selection. The survey included individuals residing in private LQs, and excluded those residing in institutional LQs such as hotels, hostels, hospitals, prisons, boarding houses, and construction worksites. Personal interview was used to collect information on labour force participation, employment, demographic, and socio-economic characteristics from the respondents. A detailed explanation of the sampling design is available in the survey’s main report downloadable from the DOSM portal.
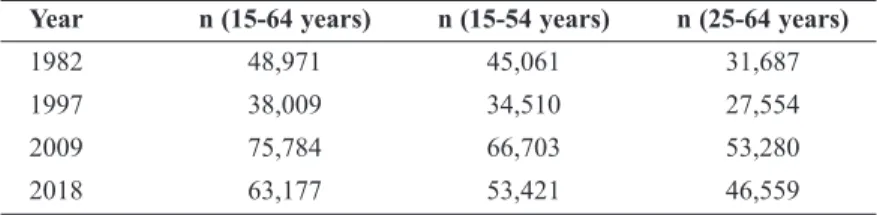
The analysis on the marriage rate focused on Malaysian citizens aged 25-64 years. At this age, most people would have completed schooling, and be old enough to enter marriage. On the other hand, the SMAM was computed for respondents aged 15-54 years. The sample size for each wave of data is shown in Table 1.
Table 1: Sample Size (Malaysian Citizens), Multiple Waves of LFS Year n (15-64 years) n (15-54 years) n (25-64 years)
1982 48,971 45,061 31,687
1997 38,009 34,510 27,554
2009 75,784 66,703 53,280
2018 63,177 53,421 46,559
Source: Author’s computation using multiple waves of LFS (30% sample).
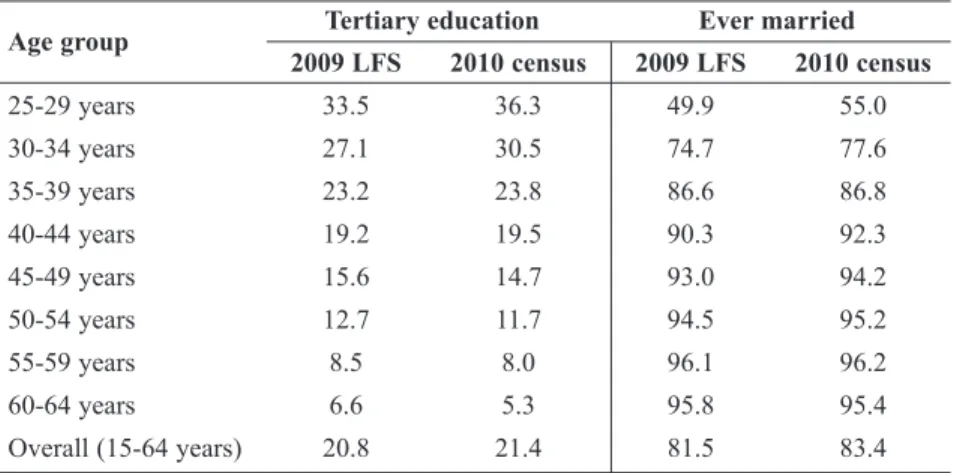
The LFS provided updated information on the educational attainment and marriage pattern of Malaysians, since the last census was conducted in 2010. Table 2 shows that the estimated proportion of population with tertiary education and per cent ever married based on the 2009 LFS corresponded closely with the estimates from the two per cent sample of the 2010 population census. The discrepancy of the estimates from the two data sets is rather small, especially among those aged 35 and over, as few people would continue studying or enter marriage beyond that age. This close correspondence indicates the high reliability of the LFS data on per cent with tertiary education and per cent ever married.
Table 2: Individuals with Tertiary Education and Ever Married by Age Group, 2009 LFS and 2010 Census (%)
Age group Tertiary education Ever married
2009 LFS 2010 census 2009 LFS 2010 census
25-29 years 33.5 36.3 49.9 55.0
30-34 years 27.1 30.5 74.7 77.6
35-39 years 23.2 23.8 86.6 86.8
40-44 years 19.2 19.5 90.3 92.3
45-49 years 15.6 14.7 93.0 94.2
50-54 years 12.7 11.7 94.5 95.2
55-59 years 8.5 8.0 96.1 96.2
60-64 years 6.6 5.3 95.8 95.4
Overall (15-64 years) 20.8 21.4 81.5 83.4
Note: The “tertiary” education classification in the 2010 census was recoded according to the classification used in LFS, in which those whose highest level of education was above Form 5.
Sources: Author’s computation using the 2009 LFS (30% sample) and the 2010 census (2% sample).
The main variables used in this study include marital status (never married versus ever married), educational level (none/primary, secondary, and tertiary), ethnic group (Bumiputera, Chinese, Indian, and Others), stratum (urban versus rural), and age. Individuals with no education and primary education were grouped into one category, as the 2018 data showed that only 2% of the Malaysian citizens had no formal education. The analysis began with an examination of the changing levels of education and marital status in the past four decades. Crosstabulations were used to examine the relationship between education and marriage rate (per cent ever married) and timing (age at marriage – SMAM). Because information on age at marriage was not collected in the LFS, the SMAM was computed to indicate an increase of delayed marriage over the period 1982-2018. The SMAM is the average years of single life among those who marry before age 50, and it is a synthetic indicator estimated from marital status categories of males and females aged 15-54 years. This period measure of age at marriage is subject to several deficiencies (Hajnal, 1953), such as biases arising from the use of five-year age groups in the computation, different age distributions
across various sub-groups of the population, and ignoring the fact that most individuals aged 15-19 are not ready to enter the institution of higher learning. Nevertheless, given that over 90% of the males and females aged 15-19 years were never married in the selected waves of LFS, the inclusion of this age group in the computation of SMAM at the tertiary level will have only a small effect on the estimated SMAM.
Scatter plots were used to present the association between age at marriage and education according to ethnic groups, urban-rural locations, and state. The strength of the relationship between education and SMAM was measured using the Spearman correlation. At the multivariate level, binary logistic regression was performed to estimate the educational gradient in marriage, by assessing the likelihood of being ever married among individuals in different educational groups, after adjusting for other variables in the model. The marginal effect was used to assess the change in the predicted probability of the dichotomous dependent variable in the multivariate context. The marginal effects were computed using STATA version 14, while SPSS version 26 was utilised to perform all other data analyses. The sample weight was applied to minimise sampling error. All analyses were stratified by gender to explore the differential educational effect on marriage between males and females.
4. Results
4.1 Trends in educational attainment and marital status
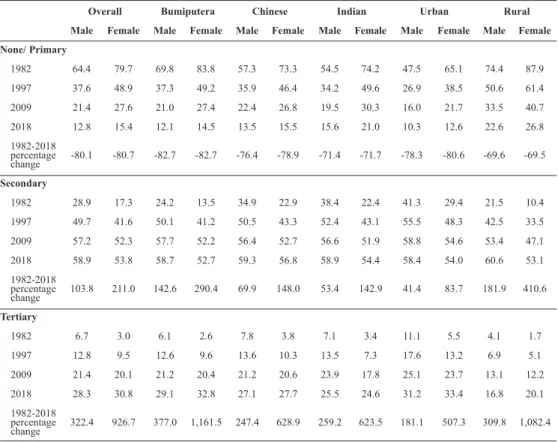
Malaysia has made commendable progress in education and socio-economic development since Independence in 1957. Between 1982 and 2018, the proportion of males aged 25-64 with tertiary education rose from 6.7%
to 28.3% while that of females rose from 3.0% to 30.8% (Table 3). The proportion with primary or no education decreased correspondingly from 64.4% and 79.7% to 12.8% and 15.4% for males and females respectively.
In 2009, females still lagged behind males in tertiary education but had overtaken the males a few years later. The 40 years period under study witnessed a faster increase in tertiary education among women compared with men, across all ethnic groups and in both urban and rural areas.
All ethnic groups have made tremendous progress in secondary and tertiary education. The Bumiputera registered a faster increase than the
non-Bumiputera in secondary and tertiary education, while the Chinese and Indians had about the same pace of progress in educational attainment.
The educational level rose in both urban and rural areas. The LFS showed that the proportion with secondary and tertiary educational attainment had increased faster in the rural areas, compared with urban areas, especially among the females. However, rural residents still trailed behind urban residents in tertiary education. In 2018, about one-quarter of the rural population had no schooling or only primary education, compared to slightly above 10% among the urban dwellers (Table 3). The higher educational level of urban dwellers compared to those from rural areas can be attributed partly to the location of institutions of higher learning and better employment opportunities, which are concentrated in the cities and major towns.
Table 3: Educational Level of Individuals Aged 25-64 Years by Selected Socio- Demographic Variables, 1982-2018 (%)
Overall Bumiputera Chinese Indian Urban Rural
Male Female Male Female Male Female Male Female Male Female Male Female None/ Primary
1982 64.4 79.7 69.8 83.8 57.3 73.3 54.5 74.2 47.5 65.1 74.4 87.9
1997 37.6 48.9 37.3 49.2 35.9 46.4 34.2 49.6 26.9 38.5 50.6 61.4
2009 21.4 27.6 21.0 27.4 22.4 26.8 19.5 30.3 16.0 21.7 33.5 40.7
2018 12.8 15.4 12.1 14.5 13.5 15.5 15.6 21.0 10.3 12.6 22.6 26.8
1982-2018 percentage
change -80.1 -80.7 -82.7 -82.7 -76.4 -78.9 -71.4 -71.7 -78.3 -80.6 -69.6 -69.5 Secondary
1982 28.9 17.3 24.2 13.5 34.9 22.9 38.4 22.4 41.3 29.4 21.5 10.4
1997 49.7 41.6 50.1 41.2 50.5 43.3 52.4 43.1 55.5 48.3 42.5 33.5
2009 57.2 52.3 57.7 52.2 56.4 52.7 56.6 51.9 58.8 54.6 53.4 47.1
2018 58.9 53.8 58.7 52.7 59.3 56.8 58.9 54.4 58.4 54.0 60.6 53.1
1982-2018 percentage
change 103.8 211.0 142.6 290.4 69.9 148.0 53.4 142.9 41.4 83.7 181.9 410.6
Tertiary
1982 6.7 3.0 6.1 2.6 7.8 3.8 7.1 3.4 11.1 5.5 4.1 1.7
1997 12.8 9.5 12.6 9.6 13.6 10.3 13.5 7.3 17.6 13.2 6.9 5.1
2009 21.4 20.1 21.2 20.4 21.2 20.6 23.9 17.8 25.1 23.7 13.1 12.2
2018 28.3 30.8 29.1 32.8 27.1 27.7 25.5 24.6 31.2 33.4 16.8 20.1
1982-2018 percentage
change 322.4 926.7 377.0 1,161.5 247.4 628.9 259.2 623.5 181.1 507.3 309.8 1,082.4
Note: “Others” ethnic group was included in the computation of “Overall” percentages.
Source: Author’s computation using multiple waves of LFS (30% sample).
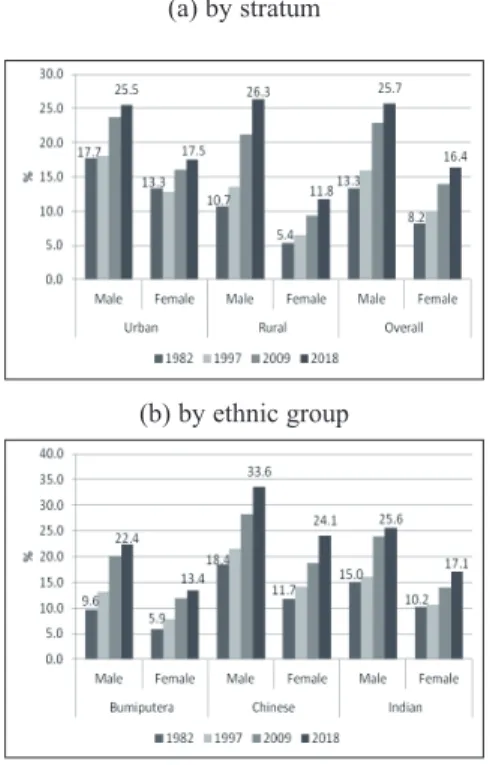
Concomitant with rising educational attainment in Malaysia, the marriage pattern has undergone significant changes. More and more individuals are remaining single. Males were more likely to remain single than females (Figure 1). Non-marriage for males and females doubled from 13.3% and 8.2% in 1982 to 25.7% and 16.4% respectively in 2018. Non- marriage among the rural males increased fastest from 10.7% to 26.3%, while it also more than doubled from 5.4% to 11.8% among rural females. In contrast, the increase in the non-marriage rate was more gradual in the urban areas, from 17.7% to 25.5% for males, and 13.3% to 17.5% for females.
Figure 1: Individuals Aged 25-64 Years Who Were Never Married by Selected Socio- Demographic Variables, 1982-2018 (%)
(a) by stratum
(b) by ethnic group
Note: “Others” ethnic group was included in the computation of “Overall” percentages.
Source: Author’s computation using multiple waves of LFS (30% sample).
There was wide ethnic variation in the non-marriage rate. In 2018, 33.6% and 24.1% of the Chinese males and females were never married, as compared to 22.4% and 13.4% among the Bumiputera, and 25.6% and 17.1% among the Indians (Figure 1).
4.2 Changing educational effect on the proportion ever married
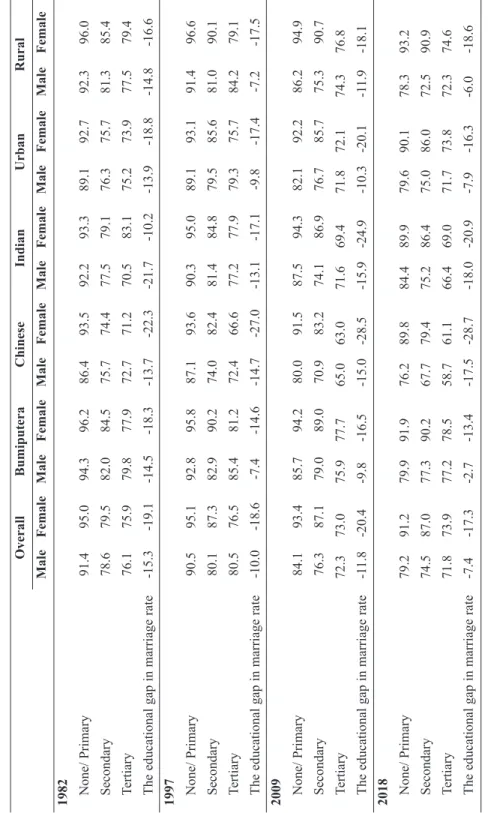
The marriage rate had declined across all educational levels, except for females with secondary education. The proportion of the population aged 25-64 who were ever married among males and females was much lower among the better educated compared to those with lesser education (Table 4). However, the effect of education on the proportion ever married has diminished in recent years for the males, with the gap across educational levels decreasing from 15.3% to 7.4%, but it remained substantial for the females, at 17.3% in 2018, a small decline of about two percentage points from 1982. For males, the marriage rate decreased markedly between 1982 and 2018 among those with primary or no education (from 91.4% to 79.2%), but the change was more modest among those with tertiary education (from 76.1% to 71.8%). The decrease in marriage rate was much more modest for females, from 95.0% to 91.2% among those with primary/no education, and from 75.9% to 73.9% for the tertiary educated.
Females were more likely than males to enter marriage at different ages across all educational groups, except for those with tertiary education in 1982 and 1997. The gender gap in the marriage rate was smallest at the tertiary level (0.2%-4%), and had not changed much over time. However, the gender gap in the marriage rate at the primary and secondary educational levels had widened over time, due to the faster decline in the marriage rate among the males.
The educational gap in the marriage rate was more pronounced for the non-Bumiputera. Chinese males and females were more likely than others to remain single across all educational levels. In 2018, 58.7% of the Chinese males and 61.1% of the Chinese females aged 25-64 with tertiary education were ever-married, compared to 77.2% and 78.5% for the Bumiputera, and 66.4% and 69.0% for the Indians. Between 1982 and 2018, the educational effect in reducing the marriage rate became stronger for the Chinese (males and females) and Indian females but became weaker for the Bumiputera. An increase in the marriage rate was observed among females with secondary education for all ethnic groups, and Bumiputera females with tertiary education. Higher educational attainment reduced the marriage rate of the females more than that of the males, except the Indians in 1982.
Educational attainment reduced the marriage rate at about the same amount in urban and rural areas. In 2018, the educational effect in reducing
Table 4: Individuals Aged 25-64 Years Who Were Ever Married at Each Educational Level by Selected Socio-Demographic Variables, 1982-2018 (%) OverallBumiputeraChineseIndianUrbanRural MaleFemaleMaleFemaleMaleFemaleMaleFemaleMaleFemaleMaleFemale 1982 None/ Primary91.495.094.396.286.493.592.293.389.192.792.396.0 Secondary78.679.582.084.575.774.477.579.176.375.781.385.4 Tertiary76.175.979.877.972.771.270.583.175.273.977.579.4 The educational gap in marriage rate-15.3-19.1-14.5-18.3-13.7-22.3-21.7-10.2-13.9-18.8-14.8-16.6 1997 None/ Primary90.595.192.895.887.193.690.395.089.193.191.496.6 Secondary80.187.382.990.274.082.481.484.879.585.681.090.1 Tertiary80.576.585.481.272.466.677.277.979.375.784.279.1 The educational gap in marriage rate-10.0-18.6-7.4-14.6-14.7-27.0-13.1-17.1-9.8-17.4-7.2-17.5 2009 None/ Primary84.193.485.794.280.091.587.594.382.192.286.294.9 Secondary76.387.179.089.070.983.274.186.976.785.775.390.7 Tertiary72.373.075.977.765.063.071.669.471.872.174.376.8 The educational gap in marriage rate-11.8-20.4-9.8-16.5-15.0-28.5-15.9-24.9-10.3-20.1-11.9-18.1 2018 None/ Primary79.291.279.991.976.289.884.489.979.690.178.393.2 Secondary74.587.077.390.267.779.475.286.475.086.072.590.9 Tertiary71.873.977.278.558.761.166.469.071.773.872.374.6 The educational gap in marriage rate-7.4-17.3-2.7-13.4-17.5-28.7-18.0-20.9-7.9-16.3-6.0-18.6 Note: “Others” ethnic group was included in the computation of “Overall” percentages. Source: Author’s computation using multiple waves of LFS (30% sample).
the marriage rate ranged from 6.0% in the rural areas to 7.9% in the urban areas for the males, and 18.6% in the rural areas to 16.3% in the urban areas for females. Between 1982 and 2018, rural residents with primary or no education recorded a greater reduction in the marriage rate than their urban counterparts, especially among males. The marriage rate among rural females was higher than that in urban areas at all educational levels. The gender gap in the proportion ever married was relatively larger among those with lesser education, but the urban-rural differential was negligible at the tertiary level in recent years.
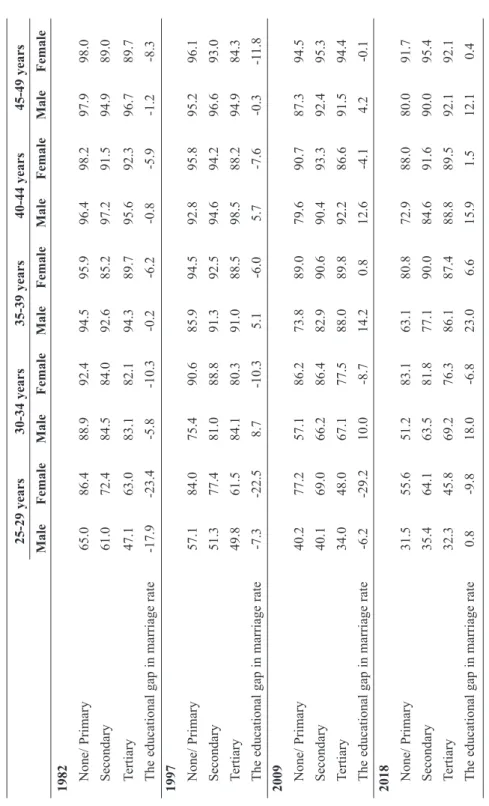
Table 5 shows a considerably lower marriage rate among the younger cohort compared to the older cohorts, especially for those with tertiary education. In 1982, tertiary-educated males and females aged below 35 were less likely to enter marriage than those with lower education. However, the educational effect on the marriage rate for males had weakened and reversed in direction over the years. For females, the effect of education in reducing the marriage rate had also waned but remained rather substantial in 2018, even among those aged 25-29. Better educated younger women were more likely than the lesser educated ones to remain single upon graduation and starting their career. However, as of 2018, better-educated females aged 35 and older were more likely to enter marriage than the lesser educated females, but the educational effect was not as significant as for males.
Between 1982 and 2018, the decline in the marriage rate was faster among those with lesser education than those who were better educated, across all age groups. This indicates a declining trend in marriage among the lesser educated individuals, particularly among the males. On the other hand, there was an increase in the marriage rate among the secondary educated females aged 35 and above, and tertiary educated females aged 45-49 years.
The 2018 statistics showed that the proportion ever married among females was relatively higher than that of males, and the gender gap was wider at younger ages, especially at the lower educational level.
Table 5: Ever Married at Each Educational Level by Age Group, 1982-2018 (%) 25-29 years30-34 years35-39 years40-44 years45-49 years MaleFemaleMaleFemaleMaleFemaleMaleFemaleMaleFemale 1982 None/ Primary65.086.488.992.494.595.996.498.297.998.0 Secondary61.072.484.584.092.685.297.291.594.989.0 Tertiary47.163.083.182.194.389.795.692.396.789.7 The educational gap in marriage rate-17.9-23.4-5.8-10.3-0.2-6.2-0.8-5.9-1.2-8.3 1997 None/ Primary57.184.075.490.685.994.592.895.895.296.1 Secondary51.377.481.088.891.392.594.694.296.693.0 Tertiary49.861.584.180.391.088.598.588.294.984.3 The educational gap in marriage rate-7.3-22.58.7-10.35.1-6.05.7-7.6-0.3-11.8 2009 None/ Primary40.277.257.186.273.889.079.690.787.394.5 Secondary40.169.066.286.482.990.690.493.392.495.3 Tertiary34.048.067.177.588.089.892.286.691.594.4 The educational gap in marriage rate-6.2-29.210.0-8.714.20.812.6-4.14.2-0.1 2018 None/ Primary31.555.651.283.163.180.872.988.080.091.7 Secondary35.464.163.581.877.190.084.691.690.095.4 Tertiary32.345.869.276.386.187.488.889.592.192.1 The educational gap in marriage rate0.8-9.818.0-6.823.06.615.91.512.10.4 Source: Author’s computation using multiple waves of LFS (30% sample).
4.3 The changing educational effect on SMAM
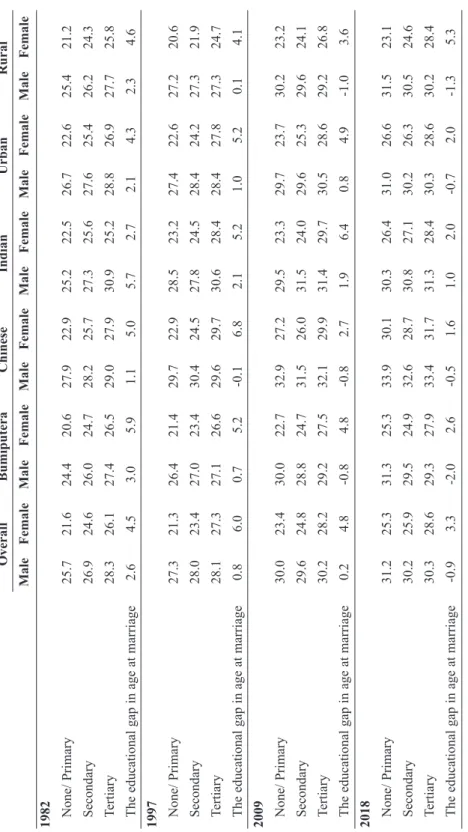
Between 1982 and 2018, SMAM for both males and females showed an increasing trend across all educational levels, and it was more pronounced among the lesser educated individuals (Table 6). Males married 2-6 years later than females in 2018, and the gender gap in age at marriage decreased with educational level. The 2018 statistics revealed that tertiary-educated females were more likely to marry later than those who were less educated (SMAM of 28.6 years versus 25.3 years among those with no/primary education). The educational effect on age at marriage was less pronounced for males and even showed a reversal more recently, as tertiary-educated men married earlier than those with lower education. The educational gap in SMAM for females also narrowed over time but remained substantial.
The trend in delayed marriage was observed for all three ethnic groups.
The transition to later age at marriage began earliest among the Chinese.
Recent statistics showed that the Bumiputera and Chinese males with lesser education married later than those with tertiary education, starting from the year 2009 (1997 for the Chinese males). The positive educational effect on age at marriage for the males persisted for the Indians, albeit with a smaller effect in recent years. Higher female education was positively associated with later age at marriage for all ethnic groups. It is noteworthy that Chinese females with no/primary education registered the most significant increase in age at marriage between 1982 and 2018.
Urbanisation is associated with later marriage. The positive educational effect on age at marriage for females varied between urban and rural areas.
Between 1982 and 2018, the positive educational effect on delayed marriage became smaller in urban areas, but the opposite was true in rural areas. For males, education became negatively associated with age at marriage since the year 2009 in rural areas, and in 2018 in urban areas. The mean age at marriage for females in the urban areas has always been higher than that of the rural areas, especially at the lower educational level. The smaller urban- rural gap in mean age at marriage in recent years for females at the tertiary level indicates the strong influence of education in delaying marriage, where rural women with higher education were as likely as their urban counterparts to postpone marriage.
Table 6: SMAM at Each Educational Level by Selected Socio-Demographic Variables, 1982-2018 OverallBumiputeraChineseIndianUrbanRural MaleFemaleMaleFemaleMaleFemaleMaleFemaleMaleFemaleMaleFemale 1982 None/ Primary25.721.624.420.627.922.925.222.526.722.625.421.2 Secondary26.924.626.024.728.225.727.325.627.625.426.224.3 Tertiary28.326.127.426.529.027.930.925.228.826.927.725.8 The educational gap in age at marriage2.64.53.05.91.15.05.72.72.14.32.34.6 1997 None/ Primary27.321.326.421.429.722.928.523.227.422.627.220.6 Secondary28.023.427.023.430.424.527.824.528.424.227.321.9 Tertiary28.127.327.126.629.629.730.628.428.427.827.324.7 The educational gap in age at marriage0.86.00.75.2-0.16.82.15.21.05.20.14.1 2009 None/ Primary30.023.430.022.732.927.229.523.329.723.730.223.2 Secondary29.624.828.824.731.526.031.524.029.625.329.624.1 Tertiary30.228.229.227.532.129.931.429.730.528.629.226.8 The educational gap in age at marriage0.24.8-0.84.8-0.82.71.96.40.84.9-1.03.6 2018 None/ Primary31.225.331.325.333.930.130.326.431.026.631.523.1 Secondary30.225.929.524.932.628.730.827.130.226.330.524.6 Tertiary30.328.629.327.933.431.731.328.430.328.630.228.4 The educational gap in age at marriage-0.93.3-2.02.6-0.51.61.02.0-0.72.0-1.35.3 Note: “Others” ethnic group was included in the computation of “Overall” percentages. Source: Author’s computation using multiple waves of LFS (30% sample).
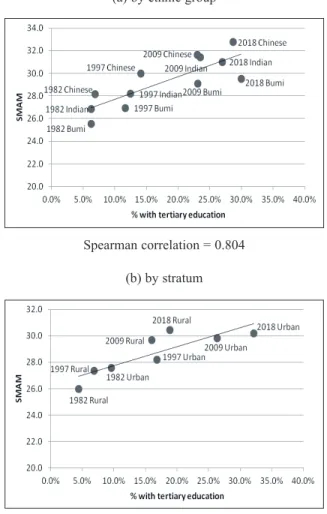
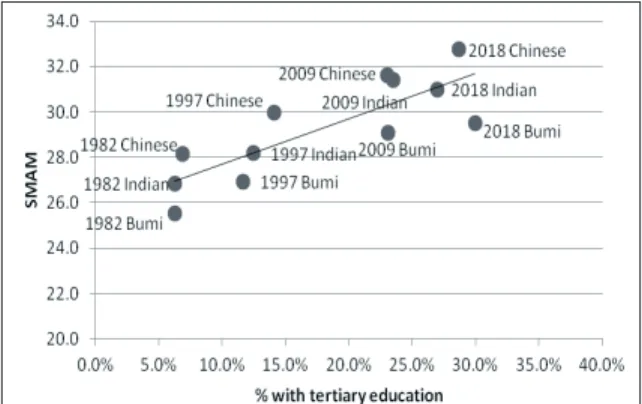
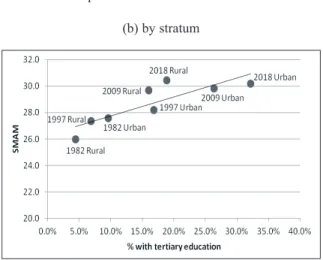
Scatter plots were used to portray the linkage between education and age at marriage by ethnic group and urban-rural location (Figures 2 and 3). The figures show a strong positive relationship between age at marriage and per cent with tertiary education, by ethnicity and urban-rural location for both males and females. The per cent with tertiary education rose rather sharply for all the three ethnic groups, accompanied by a rise in age at marriage over the years.
In 1982, the proportion with tertiary education was about the same for all ethnic groups but there was a rather wide variation in the age at marriage, with the Chinese marrying latest and the Bumiputera the earliest, for both males and females. The ethnic differentials in age at marriage persisted over the years. However, the Bumiputera, who lagged a little in tertiary education until the 1990s, had overtaken the non-Bumiputera since then. For both Bumiputera males and females, the age at marriage was lower than expected, given their level of education.
The positive correlation between education and age at marriage can be observed in both urban and rural areas. The proportion of males and females with tertiary education and age at marriage had risen concurrently over the years. Urban residents had higher education and married later than those living in the rural areas, resulting in a strong positive correlation between the two variables. There was a slight anomaly in the lower age at marriage among urban males than rural males in 2018, given their educational differential. The positive educational gradient in the timing of marriage was more pronounced by urban-rural location than by ethnicity, and for the females than for the males, as indicated by the scatter plots and the Spearman correlation coefficients.
A comparison of the scatter plots of SMAM with per cent with tertiary education by state for 1982 and 2018 shows that the positive educational gradient in marriage timing for males had become flat over the years (Figure 4). However, the education gradient for females remained almost unchanged over the forty years (Figure 5). This trend shows that the increase in tertiary education was not the main reason for marriage postponement among males.
Except for males in 2018, states with higher educational levels also had a later age at marriage. In 2018, the mean age at marriage among the males in Putrajaya was about the same as most other states, despite having the highest educational level. Part of this could be attributed to the fact that the majority of the population in the federal administrative centre are
The Changing Educational Gradient in Marriage 77
Bumiputera, who marry earlier than the non-Bumiputera, as alluded to above. With a relatively high educational level, males and females in Kuala Lumpur entered marriage much later than others. The late marriage in Pulau Pinang can be partly attributed to the ethnic composition of the state, where the Chinese (who married the latest) constituted a majority.
Figure 2: SMAM and Percentage of Individuals with Tertiary Education by Selected Socio-Demographic Variables, Male, 1982-2018
(a) by ethnic group
10 Note: “Others” ethnic group was included in the computation of “Overall” percentages.
Source: Author’s computation using multiple waves of LFS (30% sample).
Scatter plots were used to portray the linkage between education and age at marriage by ethnic group and urban-rural location (Figures 2 and 3). The figures show a strong positive relationship between age at marriage and per cent with tertiary education, by ethnicity and urban-rural location for both males and females. The per cent with tertiary education rose rather sharply for all the three ethnic groups, accompanied by a rise in age at marriage over the years.
In 1982, the proportion with tertiary education was about the same for all ethnic groups but there was a rather wide variation in the age at marriage, with the Chinese marrying latest and the Bumiputera the earliest, for both males and females. The ethnic differentials in age at marriage persisted over the years. However, the Bumiputera, who lagged a little in tertiary education until the 1990s, had overtaken the non-Bumiputera since then. For both Bumiputera males and females, the age at marriage was lower than expected, given their level of education.
The positive correlation between education and age at marriage can be observed in both urban and rural areas. The proportion of males and females with tertiary education and age at marriage had risen concurrently over the years. Urban residents had higher education and married later than those living in the rural areas, resulting in a strong positive correlation between the two variables. There was a slight anomaly in the lower age at marriage among urban males than rural males in 2018, given their educational differential. The positive educational gradient in the timing of marriage was more pronounced by urban-rural location than by ethnicity, and for the females than for the males, as indicated by the scatter plots and the Spearman correlation coefficients.
Figure 2: SMAM and Percentage of Individuals with Tertiary Education by Selected Socio- Demographic Variables, Male, 1982-2018
(a) by ethnic group (b)
Spearman correlation = 0.804
(c) by stratum (d)
Spearman correlation = 0.905 Source: Author’s computation using multiple waves of LFS (30% sample).
Figure 3: SMAM and Percentage of Individuals with Tertiary Education by Selected Socio- Demographic Variables, Female, 1982-2018
(a) by ethnic group (b) by stratum
Spearman correlation = 0.804 (b) by stratum
10 gap in age
at marriage
Note: “Others” ethnic group was included in the computation of “Overall” percentages.
Source: Author’s computation using multiple waves of LFS (30% sample).
Scatter plots were used to portray the linkage between education and age at marriage by ethnic group and urban-rural location (Figures 2 and 3). The figures show a strong positive relationship between age at marriage and per cent with tertiary education, by ethnicity and urban-rural location for both males and females. The per cent with tertiary education rose rather sharply for all the three ethnic groups, accompanied by a rise in age at marriage over the years.
In 1982, the proportion with tertiary education was about the same for all ethnic groups but there was a rather wide variation in the age at marriage, with the Chinese marrying latest and the Bumiputera the earliest, for both males and females. The ethnic differentials in age at marriage persisted over the years. However, the Bumiputera, who lagged a little in tertiary education until the 1990s, had overtaken the non-Bumiputera since then. For both Bumiputera males and females, the age at marriage was lower than expected, given their level of education.
The positive correlation between education and age at marriage can be observed in both urban and rural areas. The proportion of males and females with tertiary education and age at marriage had risen concurrently over the years. Urban residents had higher education and married later than those living in the rural areas, resulting in a strong positive correlation between the two variables. There was a slight anomaly in the lower age at marriage among urban males than rural males in 2018, given their educational differential. The positive educational gradient in the timing of marriage was more pronounced by urban-rural location than by ethnicity, and for the females than for the males, as indicated by the scatter plots and the Spearman correlation coefficients.
Figure 2: SMAM and Percentage of Individuals with Tertiary Education by Selected Socio- Demographic Variables, Male, 1982-2018
(a) by ethnic group (b)
Spearman correlation = 0.804
(c) by stratum (d)
Spearman correlation = 0.905 Source: Author’s computation using multiple waves of LFS (30% sample).
Figure 3: SMAM and Percentage of Individuals with Tertiary Education by Selected Socio- Demographic Variables, Female, 1982-2018
(a) by ethnic group (b) by stratum
Spearman correlation = 0.905
Source: Author’s computation using multiple waves of LFS (30% sample).
Figure 3: SMAM and Percentage of Individuals with Tertiary Education by Selected Socio-Demographic Variables, Female, 1982-2018
(a) by ethnic group
11 Spearman correlation = 0.839 Spearman correlation = 0.976
Source: Author’s computation using multiple waves of LFS (30% sample).
A comparison of the scatter plots of SMAM with per cent with tertiary education by state for 1982 and 2018 shows that the positive educational gradient in marriage timing for males had become flat over the years (Figure 4). However, the education gradient for females remained almost unchanged over the forty years (Figure 5). This trend shows that the increase in tertiary education was not the main reason for marriage postponement among males.
Except for males in 2018, states with higher educational levels also had a later age at marriage.
In 2018, the mean age at marriage among the males in Putrajaya was about the same as most other states, despite having the highest educational level. Part of this could be attributed to the fact that the majority of the population in the federal administrative centre are Bumiputera, who marry earlier than the non-Bumiputera, as alluded to above. With a relatively high educational level, males and females in Kuala Lumpur entered marriage much later than others. The late marriage in Pulau Pinang can be partly attributed to the ethnic composition of the state, where the Chinese (who married the latest) constituted a majority.
Figure 4: SMAM and Percentage of Individuals with Tertiary Education by State, Male, 1982 and 2018
(a) 1982
Spearman correlation = 0.411
(b) 2018
Spearman correlation = 0.093 Source: Author’s computation using multiple waves of LFS (30% sample).
Figure 5: SMAM and Percentage of Individuals with Tertiary Education by State, Female, 1982 and 2018
(a) 1982 (b) 2018
Spearman correlation = 0.839 (b) by stratum
11 Spearman correlation = 0.839 Spearman correlation = 0.976
Source: Author’s computation using multiple waves of LFS (30% sample).
A comparison of the scatter plots of SMAM with per cent with tertiary education by state for 1982 and 2018 shows that the positive educational gradient in marriage timing for males had become flat over the years (Figure 4). However, the education gradient for females remained almost unchanged over the forty years (Figure 5). This trend shows that the increase in tertiary education was not the main reason for marriage postponement among males.
Except for males in 2018, states with higher educational levels also had a later age at marriage.
In 2018, the mean age at marriage among the males in Putrajaya was about the same as most other states, despite having the highest educational level. Part of this could be attributed to the fact that the majority of the population in the federal administrative centre are Bumiputera, who marry earlier than the non-Bumiputera, as alluded to above. With a relatively high educational level, males and females in Kuala Lumpur entered marriage much later than others. The late marriage in Pulau Pinang can be partly attributed to the ethnic composition of the state, where the Chinese (who married the latest) constituted a majority.
Figure 4: SMAM and Percentage of Individuals with Tertiary Education by State, Male, 1982 and 2018
(a) 1982
Spearman correlation = 0.411
(b) 2018
Spearman correlation = 0.093 Source: Author’s computation using multiple waves of LFS (30% sample).
Figure 5: SMAM and Percentage of Individuals with Tertiary Education by State, Female, 1982 and 2018
(a) 1982 (b) 2018
Spearman correlation = 0.976
Source: Author’s computation using multiple waves of LFS (30% sample).
The Changing Educational Gradient in Marriage 79
Figure 4: SMAM and Percentage of Individuals with Tertiary Education by State, Male, 1982 and 2018
(a) 1982
11 Source: Author’s computation using multiple waves of LFS (30% sample).
A comparison of the scatter plots of SMAM with per cent with tertiary education by state for 1982 and 2018 shows that the positive educational gradient in marriage timing for males had become flat over the years (Figure 4). However, the education gradient for females remained almost unchanged over the forty years (Figure 5). This trend shows that the increase in tertiary education was not the main reason for marriage postponement among males.
Except for males in 2018, states with higher educational levels also had a later age at marriage.
In 2018, the mean age at marriage among the males in Putrajaya was about the same as most other states, despite having the highest educational level. Part of this could be attributed to the fact that the majority of the population in the federal administrative centre are Bumiputera, who marry earlier than the non-Bumiputera, as alluded to above. With a relatively high educational level, males and females in Kuala Lumpur entered marriage much later than others. The late marriage in Pulau Pinang can be partly attributed to the ethnic composition of the state, where the Chinese (who married the latest) constituted a majority.
Figure 4: SMAM and Percentage of Individuals with Tertiary Education by State, Male, 1982 and 2018
(a) 1982
Spearman correlation = 0.411
(b) 2018
Spearman correlation = 0.093 Source: Author’s computation using multiple waves of LFS (30% sample).
Figure 5: SMAM and Percentage of Individuals with Tertiary Education by State, Female, 1982 and 2018
(a) 1982 (b) 2018
Spearman correlation = 0.411 (b) 2018
11 Spearman correlation = 0.839 Spearman correlation = 0.976
Source: Author’s computation using multiple waves of LFS (30% sample).
A comparison of the scatter plots of SMAM with per cent with tertiary education by state for 1982 and 2018 shows that the positive educational gradient in marriage timing for males had become flat over the years (Figure 4). However, the education gradient for females remained almost unchanged over the forty years (Figure 5). This trend shows that the increase in tertiary education was not the main reason for marriage postponement among males.
Except for males in 2018, states with higher educational levels also had a later age at marriage.
In 2018, the mean age at marriage among the males in Putrajaya was about the same as most other states, despite having the highest educational level. Part of this could be attributed to the fact that the majority of the population in the federal administrative centre are Bumiputera, who marry earlier than the non-Bumiputera, as alluded to above. With a relatively high educational level, males and females in Kuala Lumpur entered marriage much later than others. The late marriage in Pulau Pinang can be partly attributed to the ethnic composition of the state, where the Chinese (who married the latest) constituted a majority.
Figure 4: SMAM and Percentage of Individuals with Tertiary Education by State, Male, 1982 and 2018
(a) 1982
Spearman correlation = 0.411
(b) 2018
Spearman correlation = 0.093 Source: Author’s computation using multiple waves of LFS (30% sample).
Figure 5: SMAM and Percentage of Individuals with Tertiary Education by State, Female, 1982 and 2018
(a) 1982 (b) 2018
Spearman correlation = 0.093
Source: Author’s computation using multiple waves of LFS (30% sample).
Figure 5: SMAM and Percentage of Individuals with Tertiary Education by State, Female, 1982 and 2018
(a) 1982
12 Spearman correlation = 0.554 Spearman correlation = 0.557
Source: Author’s computation using multiple waves of LFS (30% sample).
4.3 Multivariate analysis
The factors affecting the rate and timing of marriage are inter-related and have confounding effects. For instance, the educational level is higher in urban areas than in rural areas, and both variables are positively correlated with the rate and timing of marriage. Hence, binary logistic regression was used to examine the relationship between education and marital status, by estimating the likelihood that males and females ever marry, net of other socio-demographic variables for the four years under study (Table 7). The control variables in Model 1 include ethnic group and stratum, while age was added in Model 2. The likelihood ratio test of overall significance shows that all the independent variables were significant in explaining the dependent variable in each of the logistic regression models (p<0.001). The overall percentage of correct prediction was higher for model 2 as compared to model 1, especially for the males.
The first model shows a negative educational gradient in the marriage rate (per cent ever married), as indicated by odds ratios of less than 1 and negative marginal effects. The educational effect on the marriage rate was larger for females than males. However, the educational effect on the marriage rate had decreased in recent years. In the second model, adjusting for age would have reduced the negative educational gradient on the marriage rate, and even reversed into a positive effect in the more recent years, as shown by odds ratios of greater than 1 and positive marginal effects.
In 2018, males and females with secondary and tertiary education were more likely to enter marriage than those with primary or no schooling, after controlling for ethnicity, stratum, and age in the model.
The positive educational gradient in marriage was seen since 1997 for the males.
Table 7: Adjusted Odds Ratios and Marginal Effects in the Binary Logistic Regression Analysis (for individuals aged 25-64 years)
Male Female
Model 1 Model 2 Model 1 Model 2
(95% CI) AOR Marginal
effect AOR
(95% CI) Marginal
effect AOR
(95% CI) Marginal
effect AOR
(95% CI) Marginal effect 1982
Secondary 0.38***
(0.38, 0.38) -0.11 0.90***
(0.89, 0.90) -0.01 0.25***
(0.24, 0.25) -0.13 0.46***
(0.45, 0.46) -0.06
Tertiary 0.33***
(0.32, 0.33) -0.14 0.64***
(0.63, 0.65) -0.05 0.20***
(0.20, 0.20) -0.16 0.34***
(0.34, 0.35) -0.09 Chi-square test
statistic [p] 114,301.31
[p<0.001] 480,234.39
[p<0.001] 139,159.26
[p<0.001] 246,239.44 [p<0.001] Overall percentage
of correct prediction 86.72 87.51 91.77 91.77
1997
Secondary 0.42*** -0.10 1.43*** 0.04 0.38*** -0.07 0.81*** -0.02
Spearman correlation = 0.554 (b) 2018
12 Spearman correlation = 0.554 Spearman correlation = 0.557
Source: Author’s computation using multiple waves of LFS (30% sample).
4.3 Multivariate analysis
The factors affecting the rate and timing of marriage are inter-related and have confounding effects. For instance, the educational level is higher in urban areas than in rural areas, and both variables are positively correlated with the rate and timing of marriage. Hence, binary logistic regression was used to examine the relationship between education and marital status, by estimating the likelihood that males and females ever marry, net of other socio-demographic variables for the four years under study (Table 7). The control variables in Model 1 include ethnic group and stratum, while age was added in Model 2. The likelihood ratio test of overall significance shows that all the independent variables were significant in explaining the dependent variable in each of the logistic regression models (p<0.001). The overall percentage of correct prediction was higher for model 2 as compared to model 1, especially for the males.
The first model shows a negative educational gradient in the marriage rate (per cent ever married), as indicated by odds ratios of less than 1 and negative marginal effects. The educational effect on the marriage rate was larger for females than males. However, the educational effect on the marriage rate had decreased in recent years. In the second model, adjusting for age would have reduced the negative educational gradient on the marriage rate, and even reversed into a positive effect in the more recent years, as shown by odds ratios of greater than 1 and positive marginal effects.
In 2018, males and females with secondary and tertiary education were more likely to enter marriage than those with primary or no schooling, after controlling for ethnicity, stratum, and age in the model.
The positive educational gradient in marriage was seen since 1997 for the males.
Table 7: Adjusted Odds Ratios and Marginal Effects in the Binary Logistic Regression Analysis (for individuals aged 25-64 years)
Male Female
Model 1 Model 2 Model 1 Model 2
(95% CI) AOR Marginal
effect AOR
(95% CI) Marginal
effect AOR
(95% CI) Marginal
effect AOR
(95% CI) Marginal effect 1982
Secondary 0.38***
(0.38, 0.38) -0.11 0.90***
(0.89, 0.90) -0.01 0.25***
(0.24, 0.25) -0.13 0.46***
(0.45, 0.46) -0.06
Tertiary 0.33***
(0.32, 0.33) -0.14 0.64***
(0.63, 0.65) -0.05 0.20***
(0.20, 0.20) -0.16 0.34***
(0.34, 0.35) -0.09 Chi-square test
statistic [p] 114,301.31
[p<0.001] 480,234.39
[p<0.001] 139,159.26
[p<0.001] 246,239.44 [p<0.001]
Overall percentage
of correct prediction 86.72 87.51 91.77 91.77
1997
Secondary 0.42*** -0.10 1.43*** 0.04 0.38*** -0.07 0.81*** -0.02
Spearman correlation = 0.557
Source: Author’s computation using multiple waves of LFS (30% sample).
4.3 Multivariate analysis
The factors affecting the rate and timing of marriage are inter-related and have confounding effects. For instance, the educational level is higher in urban areas than in rural areas, and both variables are positively correlated with the rate and timing of marriage. Hence, binary logistic regression was
used to examine the relationship between education and marital status, by estimating the likelihood that males and females ever marry, net of other socio-demographic variables for the four years under study (Table 7). The control variables in Model 1 include ethnic group and stratum, while age was added in Model 2. The likelihood ratio test of overall significance shows that all the independent variables were significant in explaining the dependent variable in each of the logistic regression models (p<0.001). The overall percentage of correct prediction was higher for model 2 as compared to model 1, especially for the males.
The first model shows a negative educational gradient in the marriage rate (per cent ever married), as indicated by odds ratios of less than 1 and negative marginal effects. The educational effect on the marriage rate was larger for females than males. However, the educational effect on the marriage rate had decreased in recent years. In the second model, adjusting for age would have reduced the negative educational gradient on the marriage rate, and even reversed into a positive effect in the more recent years, as shown by odds ratios of greater than 1 and positive marginal effects. In 2018, males and females with secondary and tertiary education were more likely to enter marriage than those with primary or no schooling, after controlling for ethnicity, stratum, and age in the model. The positive educational gradient in marriage was seen since 1997 for the males.