CUSTOMER SATISFACTION ON PARCEL DELIVERY COMPANY
NUR FARZANA BINTI HASRUNLAH NUR FARAHHANI BINTI SAIDIN
MUHAMMAD SYAHIDAN BIN JALALUDDIN KANG HUI ZHEN
JALALUDDIN BIN JAMSURI
DEGREE OF BACHELOR OF ENTREPRENEURSHIP (LOGISTICS AND DISTRIBUTIVE TRADE) WITH HONOURS
2023
FKP
FKP
Customer Satisfaction on Parcel Delivery Company Among University Malaysia Kelantan (UMK) SAL Course Students
By
Nur Farzana Binti Hasrunlah Nur Farahhani Binti Saidin Muhammad Syahidan Bin Jalaluddin
Kang Hui Zhen Jalaluddin Bin Jamsuri
A thesis submitted in fulfillment of the requirements for the degree of Bachelor of Entrepreneurship (Logistics And Distributive Trade) With Honours
Faculty of Entrepreneurship and Business UNIVERSITI MALAYSIA KELANTAN
2023
FKP
i
THESIS DECLARATION
I hereby certify that the work embodied in this thesis is the result of the original research and has not been submitted for a higher degree to any other University or Institution.
OPEN ACCESS I agree that my thesis is to be made immediately available as hardcopy or on-line open access (full text).
EMBARGOES I agree that my thesis is to be made available as hardcopy or on-line (full text) for a period approved by the Post Graduate Committee.
Dated from until .
CONFIDENTIAL (Contain confidential information under the Official Secret Act 1972)*
RESTRICTED (Contains restricted information as specified by the organization where research was done)*
I acknowledge that Universiti Malaysia Kelantan reserves the right as follows:
1. The thesis is the property of Universiti Malaysia Kelantan.
2. The library of Universiti Malaysia Kelantan has the right to make copies for the purpose of research only.
3. The library has the right to make copies of the thesis for academic exchange.
SIGNATURE SIGNATURE OF SUPERVISOR
NAME: NUR FARZANA BINTI HASRUNLAH
SIGNATURE NAME: NUR FARAHHANI BINTI SAIDIN
NAME: DR ZAMINOR BINTI ZAMZAMIR @ ZAMZAMIN
Date:
SIGNATURE
NAME: MUHAMMAD SYAHIDAN BIN JALALUDDIN
SIGNATURE NAME: KANG HUI ZHEN
SIGNATURE NAME: JALALUDDIN BIN JAMSURI
Date: 29th JANUARY 2023 /
/ / /
FKP
ii
ACKNOWLEDGEMENT
First and foremost, we would like to express our gratitude to everyone who assisted us in our research, and we are very grateful to be able to complete our final year project. In performing our research, we had to take the help and guideline of some respected persons, who deserve our greatest gratitude. We would like to show our gratitude to our supervisor, Dr Zaminor Binti Zamzamir @ Zamzamin for giving us a good guideline for research throughout numerous consultations. We would also like to expand our deepest gratitude to all those who have directly and indirectly guided us in writing this research.
Next, we also would like to dedicate our gratitude to University Malaysia Kelantan particularly for the Faculty of Entrepreneurship and Business (FKP), for providing these opportunities to conduct this research for us to be able to complete our studies.
Numerous people, especially our classmates and team members themselves, have made valuable comment suggestions on this research which gave us inspiration to improve our research. We thank all the people for their help directly and indirectly to complete our study.
FKP
iii ABSTRACT
Nowadays, the growing popularity of e-commerce has altered not just how products are sold, but also how they are delivered. Customers expect customized items to be sent swiftly, with full order convenience and flexibility. The SERVQUAL model is important to measure the customer satisfaction for the parcel delivery company so that the parcel delivery company can improve and avoid mistakes by knowing the feedback that the customers give them. Due to COVID-19 and the effect of technology, it has resulted in a significant change in business-to- customer delivery. Customer behaviour, values, and culture have also altered the geographical situation and purchasing power. Hence, the primary goal of this research is to determine the relationship between tangible, reliability, and responsiveness with customer satisfaction of parcel delivery company. There are 272 respondents who are University Malaysia Kelantan (UMK) SAL students that were chosen at random to participate in the researchers' questionnaire. Data analysis was conducted by using SPSS tools. This study presented 272 data regarding how tangible, reliability, and responsiveness strongly influences the customer satisfaction of parcel delivery company. The result shows that there are significant correlations between tangible, reliability, and responsiveness with customer satisfaction of parcel delivery company. In conclusion, the findings of this research indicates that tangible, reliability, and responsiveness have positive relationships with the customer satisfaction of parcel delivery company. This study has implications for delivery service providers and individual consumers, who can review their service to suit the needs of its present customers.
Keywords: Customer satisfaction, reliability, responsiveness, SERVQUAL, tangible
FKP
iv
TABLE OF CONTENT
ITEMS Page
Cover Page Blank page Title Page
Thesis Declaration i
Acknowledgment ii
Abstract iii
Table Of Content iv – v
List of Tables vi
List of Figures vii
CHAPTER 1: INTRODUCTION 1
1.1 Background of the study 1
1.2 Problem Statement 2 – 4
1.3 Research Objectives 4
1.4 Research Question 4
1.5 Significance of Study 4
1.6 Definition of Term 5
1.7 Summary 5
CHAPTER 2: LITERATURE REVIEW 6
2.1 Introduction 6
2.1.1 Online Shopping 6
2.1.2 Parcel Delivery Service 7
2.2 Underpinning Theory 9
2.2.1 Tangible 10
2.2.2 Reliability 10
2.2.3 Responsiveness 11
2.3 Hypotheses Statement 12
2.4 Conceptual Framework 12
2.5 Summary 13
CHAPTER 3: RESEARCH METHODS 14
3.1 Introduction 14
3.2 Research Design 14
3.3 Data Collection Methods 15
3.4 Study Population 15
3.5 Sample size 16
3.6 Sampling Techniques 17
3.7 Research Instrument Development 18 – 20
3.8 Measurement of the Variables 20
3.8.1 Independent Variable: Service Quality 20
3.8.2 Dependent Variable: Customer Satisfaction 20
3.9 Procedure for Data Analysis 20
3.10 Summary / Conclusion 21
FKP
v
CHAPTER 4: DATA ANALYSIS AND FINDINGS 22
4.1 Introduction 22
4.2 Preliminary Analysis 23 – 24
4.3 Demographic Profile of Respondents 25 – 26
4.4 Descriptive Analysis 27
4.4.1 Overall Mean Score for Variables 27
4.4.2 Descriptive Analysis for Independent Variables 28 4.4.3 Descriptive Analysis for Dependent Variable 30 – 31
4.5 Cronbach’s Alpha Reliability Analysis 32
4.5.1 Actual Reliability Test 32 – 33
4.6 Normality Test 34
4.7 Hypotheses Testing 35
4.7.1 Pearson Correlation 35 – 36
4.7.2 Multiple Linear Regression 37 – 38
4.7.3 Relationship Between Tangible and Customer Satisfaction on Parcel Delivery Company
39 4.7.4 Relationship Between Reliability and Customer Satisfaction
on Parcel Delivery Company
39 4.7.5 Relationship Between Responsiveness and Customer
Satisfaction on Parcel Delivery Company
39 – 40
4.8 Summary / Conclusion 41
CHAPTER 5: DISCUSSION AND CONCLUSION 42
5.1 Introduction 42
5.2 Key Findings 42 – 43
5.3 Discussion 44
5.3.1 Relationship between tangible and customer satisfaction on parcel delivery company
44 5.3.2 Relationship between reliability and customer satisfaction on
parcel delivery company
45 5.3.3 Relationship between responsiveness and customer
satisfaction on parcel delivery company
46 – 47
5.4 Implications of the Study 48
5.4.1 Practical Implications 48
5.4.2 Theoretical Implications 48
5.5 Limitations of the Study 49
5.6 Recommendations/ Suggestion for Future Research 50
5.7 Overall Conclusion of the Study 51
REFERENCES 52 – 54
APPENDIX A – Draft of Questionnaire 55 – 65
APPENDIX B – Gantt Chart 66 – 67
APPENDIX C − Enrollment of Active Bachelor's Degree Students 68
APPENDIX D − Result of Turnitin 69
FKP
vi
LIST OF TABLES
Table 3. 1: Table for determining sample size from a given population 16
Table 3. 2: Research Instrument 18
Table 4. 1: Reliability Statistics 23
Table 4. 2: Summary item Statistics 24
Table 4. 3: Respondents demographic profile 25
Table 4. 4: General Information 26
Table 4. 5 The overall Mean Score on Each Variable and Dimension 27
Table 4. 6: Descriptive Analysis of Tangible Dimension. 28
Table 4. 7: Descriptive Analysis of Reliability Dimension. 29 Table 4. 8: Descriptive Analysis of Responsiveness Dimension. 30 Table 4. 9: Descriptive Analysis of Customer Satisfaction. 31 Table 4. 10: Rules of Thumb of Cronbach’s Alpha Coefficient Range 32 Table 4. 11: Reliability Coefficient for each Section of Questionnaire. 32
Table 4. 12: Result of normality Test 34
Table 4. 13: The magnitude Relationship of Pearson Correlation Value 35
Table 4. 14: The Pearson Correlation Result 36
Table 4. 15: Model Summary 37
Table 4. 16: ANOVA 37
Table 4. 17: Coefficient 38
Table 5. 1: Findings of The Results 43
FKP
vii
LIST OF FIGURES
Figure 2. 1: Research Framework for Dependent and Independent Variables 13
Figure 3. 1: Sample size formula 17
FKP
1 CHAPTER 1 INTRODUCTION 1.1 Background of the Study
Every business strives to provide the finest customer service possible. It is important to focus on customer satisfaction because it indicates whether your intended audience likes what you are doing. According to study Franklin (2021), excellent customer satisfaction promotes company's reputation, customer loyalty, and retaining customers. Therefore, many companies take customer satisfaction seriously.
The perception of customer satisfaction as a component of financial performance.
Long- and short-term sales growth could result from higher consumer satisfaction. Otherwise, customer unhappiness poses a range of hazards, including a drop in sales, boycotts or demonstrations by consumer groups, government involvement, rival retaliation, and the emergence of new replacement items on the market (Tarigan & Hatane, 2019).
The increase of use of e-commerce has transformed not only how products are sold, but also how they are delivered. Customers expect customized items to be sent quickly, with full order convenience and flexibility. The e-commerce has successfully revolutionized how consumers shop for products and has gained widespread acceptance (Tribhuvan, 2020).
The parcel service industry is one of the key elements of the transportation industry.
Customer satisfaction is vital for these carriers to keep their customers. In addition, Higher service quality capabilities can help service trades make aggressive improvements (Yaacob &
Yaacob, 2022). When it comes to delivery customers always want everything immediately, and they consider distribution options that offer a suitable combination of comfort, speed, and reliability (Pandey et al., 2021). Customers identify service excellence when they are concerned about cognitive challenges, which results in customer satisfaction (Yaacob & Yaacob, 2022).
FKP
2
For the research, only three were used out of five variables which were reliability, responsiveness, and tangibles. For this need to understand first what reliability, responsiveness and tangibles is, according to Kobiruzzaman (2020), the reliability dimension of the SERVQUAL model validates the capacity to deliver services exactly, on time, and convincingly. The business must promise to deliver the requested service to clients in a timely and correct manner. Responsiveness is the desire to provide prompt service and to treat customers with respect to satisfy. The two essential elements, promptness, and willingness are emphasised in this level. Researchers gauged responsiveness by how long customers must wait for a response or resolution (Kobiruzzaman, 2020). Tangible objects serve as representations for the actual buildings, staff clothing, machine, gear, and information network. It prioritizes supplying resources and material infrastructure (Kobiruzzaman, 2020).
1.2 Problem Statement
The customer behaviour, values, and culture had changed the geographical condition and purchasing power due to the influence of technology. In addition to work from home which has been implemented during COVID-19, the amount of home delivery increased dramatically and changed the pattern of delivery of goods (Kahalimoghadam et al., 2022). For example, in 2019, more than 120 million parcels of courier traffic and this number increased to 303 million parcels of courier traffic in 2020 in Malaysia domestically ((MCMC), 2020). This due to the government restriction such as lockdown, social distancing, and many other restrictions due to COVID-19 that has led to a huge change to business to customer deliveries. Malaysians have shown a higher tendency to purchase products online because of the time spent browsing online during Movement Control Order (MCO) (Langgat et al., 2020). Although there was a significant increase of demand in courier services in this period, as claimed by Ilyas et al.
(2021) Malaysians had a positive perception of courier services during the MCO.
FKP
3
The SERVQUAL model is important because it is to measure the customer satisfaction for the parcel delivery company is crucial and important so that the parcel delivery company can improve and avoid mistakes by knowing the feedback that the customers give them. The SERVQUAL model is beneficial in that it centres a company's strategy around customer happiness. The SERVQUAL approach, in fact, provides a framework for evaluating customer satisfaction and service quality across five variables: reliability, responsiveness, assurance, tangibles, and empathy (Cuofano, 2022). Customer satisfaction is connected to a company’s product or services since it might reflect the company’s long-term competitiveness and success (Razik et al., 2018). By measuring SERVQUAL dimensions, the parcel delivery company can tackle deficiency in the service quality provided to customers.
Online shoppers are the most prominent customer to the parcel delivery company, and it is important for the management to consider their customer's perceived value of the service offered. It is because experience quality determines customer perception based on the benefits they received from used service (Kusumawati & Rahayu, 2020). Parcel delivery company should avoid customers from having a negative experience such as lost parcel, long delivery time, rude company representative, and many other negative impact experiences. This is because according to Shbool et al. (2022) word of mouth will greatly boost the number of customers due to the satisfied customer positive feedback that they provide about the company to non-customer.
From the previous study, many agree that the quality of the logistics service had influenced customer satisfaction and customer loyalty. Based on Cho et al. (2021), they argue that parcel delivery company should emphasize more on the output of service quality which can allow customer to make a close gap comparison between expected quality and perceived quality which enhance customer satisfaction. According to Libo (2021), customer satisfaction
FKP
4
has numerous positive returns, including greater sales, repeat purchases, a stronger company image, fewer complaints and issues, cheaper costs, and so on. Business in this era should focus not only on the product quality but also on the service and experience quality that can lead to customer retention and customer loyalty to the business (Kusumawati & Rahayu, 2020).
1.3 Research Objective
i. To examine the relationship between tangibility and customer satisfaction of parcel delivery company among SAL students.
ii. To analyses the association between reliability and customer satisfaction of parcel delivery company among SAL students.
iii. To determine the relationship between responsiveness and customer satisfaction of parcel delivery company among SAL students.
1.4 Research Question
i. What is the relationship between tangibility and customer satisfaction of parcel delivery company among SAL students?
ii. What is the association between reliability and customer satisfaction of parcel delivery company among SAL students?
iii. What is the relationship between responsiveness and customer satisfaction of parcel delivery company among SAL students?
1.5 Significant of the Study
This study focuses on customer satisfaction with parcel delivery company service quality. The increase in demand for the use of parcel delivery shows that the assessment of customer satisfaction is important for business in addition to maintaining customer loyalty.
FKP
5
Customer satisfaction with the parcel delivery company's quality service can be measured through several indicators such as tangible, reliability and responsiveness.
This study could also contribute to other service-related companies in improving their service quality to obtain a competitive edge, as well as customers in understanding which dimensions influence their satisfaction with their services. This could be a support for the company with the data that were obtained. Future researchers can also use the data obtained for the purpose of strengthening their research in identifying customer satisfaction on parcel delivery companies.
1.6 Definition of Term
According to Franklin (2021), customer satisfaction (CSAT) is a metric for gauging how well a company's goods, services, and general customer experience live up to expectations.
By demonstrating how well the goods or services are received by customers, it represents the health of the firm.
1.7 Summary
Having high customer satisfaction is important for every business out there because customer satisfaction will increase the company revenue. By having high customer satisfaction, people will put more trust in the service and product. This will indirectly increase the revenue of the company.
FKP
6 CHAPTER 2 LITERATURE REVIEW
2.1 Introduction
Customers are the company's top concern to preserve business continuity. Customer satisfaction will be generated by providing good service and product quality to consumers.
Customer pleasure will help the organisation sustain its service.
Nowadays customer satisfaction is a very important issue for service company. This is because it is responsible for measuring the level of expectations between the company's products and customer expectations. products and companies can be measured through the presence of customers and subsequent reactions from them. In past research, 99% of dissatisfied customers will not repeat using the parcel delivery from companies that do not provide true customer satisfaction (Ali et al., 2021; Powton, 2018). This means, recognizing customer satisfaction will be one of the ways to reduce the customers' unhappiness while also increasing the company's profit.
The movement and scope of business nowadays requires different types of customers for the purpose of exploring customer satisfaction and their response. Therefore, customers are an important and critical asset for a business. As stated, a business needs proper procedures and responsibilities to perform tasks to create trust between products and trust in customers.
This is because it will lead to an increase in asset utilization and a lot of profit for service of the company. Many researchers stated that there is a good and strong relationship between service quality and customer trust (Ali & Anwar, 2021). Additionally, customer satisfaction is an important issue for the purpose of increasing profits for the service and companies.
FKP
7
The effectiveness of a parcel delivery company can be measured through the level of customer satisfaction where they are using the service provided by the company. If there is an increase or decrease in profit of the service company, it is based on the customer's response to the effect of their choice. Quality service that is effective can give an option to customers to achieve the maximum level of satisfaction. Therefore, customer satisfaction can be considered as the main indicator of performance in business (Ali & Anwar, 2021).
Customer satisfaction can be described as the psychology experienced by consumers when the services used are able to meet or exceed the requirements and experience for actual use (Patricks et al., 2020). When reaching the level of user satisfaction, it can be measured when service is used. This is because each customer usually responds and decides to buy or continue using the service after evaluating their level of satisfaction and experience.
Customer satisfaction can be measured according to usage patterns, and it is the sum of perceptions and evaluations from customer psychology towards products or services from past use. Therefore, it is considered subjective because only the user who uses the service can assess satisfaction with the service (Benoit et al., 2020).
2.1.1 Online Shopping
Online shopping is known as the form of electronic commerce which allows consumers to directly buy goods from the internet using the browser. This has shown that consumers buy goods directly from the seller without using an intermediary. This online shopping offer provides customers with various types of products and services. Therefore, the customer can compare with other intermediary offers while being able to choose one of the best offers for the customer (Sivanesan, 2017).
FKP
8
This online shopping process is one of the causes of a busy lifestyle and tight working hours. This is an easy solution and can save time compared to walk-in shopping. Online shopping also provides more comfort where it can reduce travel time and cost and can make payments easily (Al-Debei et al., 2015). With this virtual way, consumers can search the items that they need to purchase. Nowadays, many ways that are provided to consumers pay for their purchase to make it easy.
Consumer influence towards online shopping is due to prominent factors such as influencing detailed information, comfort and being able to do shopping activities in a relaxed manner, less time consumption and being able to compare prices (Agift et al., 2014).
Furthermore, during festive seasons as well as public holidays, online retailers must provide special offers such as promotions, free items for purchase of items over the limit as well as high discounts to increase online traffic to high levels (Karthikeyan, 2016). Therefore, online retailers should provide services such as free delivery, cash on delivery to attract customers' attention towards online purchases to further expand sales.
2.1.2 Parcel Delivery Service
The function in this delivery service is important where the core is based on the organization of the logistic process. This is related to how delivery is received from any delivery point to the end user. In practice, it shows that the sender or receiver does not need to move to exchange goods.
Usually, this service starts with a pickup system, as soon as the company receives a request from the customer, the courier will use a vehicle such as a van to pick up the package from the pickup point to the warehouse. At the starting point the packages are collected, then consolidated for the next process where larger vehicles are used to deliver to the central hub.
However, the vehicle used to make the delivery is based on the amounts of parcels available.
FKP
9
Before leaving the hub, each available package will be sorted according to the same Delivery Area. After the parcel is delivered according to the respective hub area, it will be separated according to where for local distribution to the end user destination. Each delivery will be given an additional procedure where it is as evidence of a successful delivery signature.
(Wang et al., 2021).
As a customer, this online purchase is choosing the appropriate package service is important where accurate delivery time is an important factor for choosing a courier (Nguyen et al., 2019). Therefore, So, this delivery service requires effective technology that aims to enable customers to monitor the delivery process in a specified time track such as bar code scanning. With this application, it can be the fastest to fulfill customer satisfaction with the service quality of the company.
2.2 Underpinning Theory
SERVQUAL Model is a model that consists of multiple-scale dimensions and was developed by Parasuraman et al. (1985) to measure service quality of any company that offers services in its businesses. From the model, there are ten known dimensions to be measured but, there are only three dimensions that are relevant in this study namely, tangible, reliability, and responsiveness. Trust is significantly impacted by customer service quality who are satisfied with a service will influence the development of faith in him. Several earlier research have demonstrated that SERVQUAL significantly affects trust. (Mohammed & Sahin, 2020;
Purwanto et al., 2020; Rahman et al., 2020).
Researchers A. Parasuraman, Valarie Zeithaml, and Leonard L. Berry created the SERVQUAL model in 1985 to evaluate and enhance quality in the service and retail industries.
The SERVQUAL model offers a framework for assessing service quality and customer satisfaction using five criteria: dependability, responsiveness, assurance, tangibles, and
FKP
10
empathy (Cuofano, 2022). Even though the SERVQUAL model was developed before the internet, it is still helpful today. Now that customers can share their thoughts online with a captive audience, perception management is more important than ever (Cuofano, 2022).
2.2.1 Tangible
Tangibles are physical facilities, equipment, and communication mediums. This tool is relevant because it can help improve the overall service of the company (Ramya et al., 2019).
Stated by Davis et al. (2003) had also asserted that service quality has a significant impact on higher education service providers as well. The company needs to ensure the appearance of employees, uniforms, equipment, and a comfortable work site area. This is to provide comfort and increase the productivity of employee services in the company.
The courier's delivery personnel evaluate tangible factors such as if the service delivery is damaged and whether you can track your delivery in real-time online. The look of physical buildings, equipment, employees, and communication materials are tangibles. The rapid service and service facilities' capacity to provide assurance of service is known as guarantee of service. The sophistication of the distribution and collecting facilities, the courier's appearance, his or her demeanour, communication abilities, and business level are all directly tied to the degree of customer service. Therefore, the tangibles of express service directly affect the customer's impression and mood during package pickup. The consumer would feel happier if the 30 rapid service may be better tangibles. As a result, the tangibles have some effect on consumer satisfaction (Wang, 2017).
2.2.2 Reliability
Reliability is known as the delivery of services that are accurately expressed to customers. It is an important component in service quality where most customers prefer to use their service with companies that keep promises to customers (Ramya et al., 2019). Reliability
FKP
11
shows the ability and consistency in an organization to perform certain services in a variety of ways to meet requirements, including delivery or service implementation activities. This is because customers have certain expectations about reliability in using services in the company.
Reliability is a capability to provide the given service consistently and accurately.
Organization needs to gain customer trust by completing their service at promised time because customers will be dissatisfied if they cannot trust an organization to do what they request.
Express delivery for the express delivery company to be considered reliable, it must be able to secure the products and their packaging, have a low rate of delivery-related damage, deliver goods accurately and safely into the hands of the customer, and carefully maintain the privacy of all personal information. The client will be satisfied if the goods are delivered precisely and safely within the specified time after the buyer makes their purchase and the vendor sends them. Consequently, it may state that consumer pleasure will be somewhat impacted by the service's dependability (Wang, 2017).
2.2.3 Responsiveness
Responsiveness is related to the way employees help their customers by dealing with complaints and problems that occur by customers immediately. Companies can monitor employee performance by helping the customer requests to improve the company service performance dimensions (Ramya et al., 2019). Therefore, this shows the company dedication and ability in providing prompt service to customers. The company way of monitoring the company by imagining receiving, evaluating, and responding quickly to requests.
The delivery service's responsiveness, on the other hand, relates to the express company's efficiency or speed of service, which primarily refers to door-to-door delivery, tracking of order information, and a prompt response to customer complaints and differential damage. Express delivery times are essential since customers could need their purchases right
FKP
12
away. mainly seen in three areas: first, the delivery time to pick up the cargo; second, the express delivery or transit time; and third, when the express came, the delivery time to the 29 hands of the consumers. Long wait times may be necessary, which will be detrimental to the customer's happiness with the level of service (Wang, 2017).
2.3 Hypothesis Statement
The hypothesis of the research was made based on the SERVQUAL dimensions such as tangible, reliability, and responsiveness relationship on customer satisfaction on parcel delivery company.
HI: There is a significant relationship between tangible and customer satisfaction on parcel delivery company among SAL students.
H2: There is a significant relationship between reliability and customer satisfaction on parcel delivery company among SAL students.
H3: There is a significant relationship between responsiveness and customer satisfaction on parcel delivery company among SAL students.
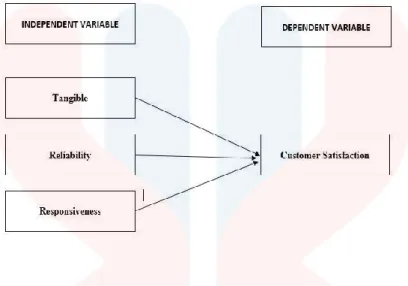
2.4 Conceptual Framework
The correlation between the independent and dependent variables was depicted in the diagram below. Reliability, responsiveness, and tangible were three observable independent variables from the research's framework. Customer satisfaction served as the research's dependent variable.
FKP
13
CUSTOMER SATISFACTION ON PARCEL DELIVERY COMPANY
Figure 2. 1: Research Framework for Dependent and Independent Variables 2.5 Summary
This chapter had discussed the dimension used namely tangible, reliability and responsiveness to measure customer satisfaction. Variables were items that can be measured, controlled, or modified. In research, variables such as independent variables (IV) and dependent variables (DV) were important. As the five SERVQUAL dimensions served as the IV and customer satisfaction as the DV. This study could bring a great impact to parcel delivery company, academician, and other related organizations from the result it brings.
FKP
14 CHAPTER 3
RESEARCH METHODOLOGY
3.1 Introduction
The primary goal of the study was to determine how well a parcel delivery service is performing in terms of tangibles, reliability, and responsiveness. This study used a quantitative methodology. When one began with a hypothesis and sought to validate or refute that hypothesis, one used the quantitative technique. This chapter concentrated on the methods for testing the viability of various variables. This was used to conduct research, data collection, sampling design, instrument validity and reliability, and data analysis.
3.2 Research Design
The purpose of the research design was to provide an appropriate framework for a study. According to Sileyew (2019), the selected research strategy is an important choice because it determines how pertinent data for a study are acquired. In this study, the researchers applied quantitative research designs where it has produced forecasts or findings that can be represented numerically. Descriptive and correlational designs used to measure variables and describe relationships between SERVQUAL dimensions and customer satisfaction on parcel delivery company. Therefore, the researchers evaluated the understanding of the relationship between the independent variable (tangible, reliability, and responsiveness) and the dependent variable (customer satisfaction on parcel delivery company). This research was implemented and executed to test the relationship of the parcel service quality towards customer satisfaction on parcel delivery company.
FKP
15 3.3 Data Collection Methods
The primary quantitative data method was applied to gather responses and information throughout the research. The data was analysed by the researchers using descriptive and inferential statistics. This research was the collecting of data from a sample of the population.
As a sampling method, the researchers applied non-probability sampling. For this purpose, the researchers had employed survey data from a questionnaire survey. It was distributed online through google form. To elicit respondents' valuable opinions, a 5-point Likert scale rating questionnaire is used in data collecting.
3.4 Study Population
According to Shukla (2020), the notion of population includes all the units to which research findings were applied. In other words, a population is a collection of all the units that have the variable feature under investigation and for whom research findings are generalised.
In this research, the researchers focused on undergraduate students in logistics and distributive trade of University Malaysia Kelantan in Pengkalan Chepa, Kelantan, Malaysia. According to Table 3.1 (Appendix), Faculty of Entrepreneurship and Business has shown that the total enrollment of active bachelor of Entrepreneurship (Logistic & Distributive Trade) degree students is 835 students. Based on this research, logistics and distribution trade undergraduate students were equipped with the knowledge of logistics entrepreneurship, which includes the quality of parcel service. The overall population size was given by the letter 'N,' and the total number of undergraduate students in logistics and distributive trade of University Malaysia Kelantan, for this study was about 835. Thus, the target population has been 835 for this study.
FKP
16 3.5 Sample Size
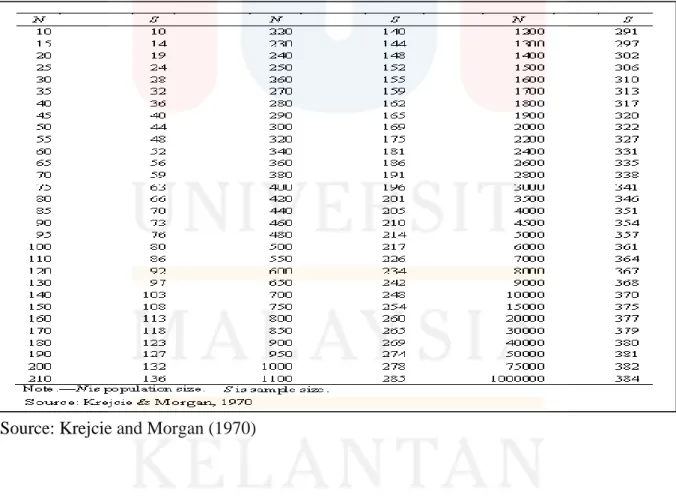
A sample size is a subset of a population that completely reflects it. It meant that the units chosen as a sample from the population must represent all the features of various sorts of population units (Shukla, 2020). In this study, the sample size of 263 estimated students represents the whole population. According to Krejcie and Morgan (1970), this table is likewise applicable to any specified population, and does not require any computations. Furthermore, when employing the KMT, a sample must be representative of the population under investigation (Memon et al., 2020). Therefore, a minimum of 263 respondents had been required to statistically represent about 835 individuals. To minimize any data errors, 272 students were chosen at random for this study.
Table 3. 1: Table for determining sample size from a given population
Source: Krejcie and Morgan (1970)
FKP
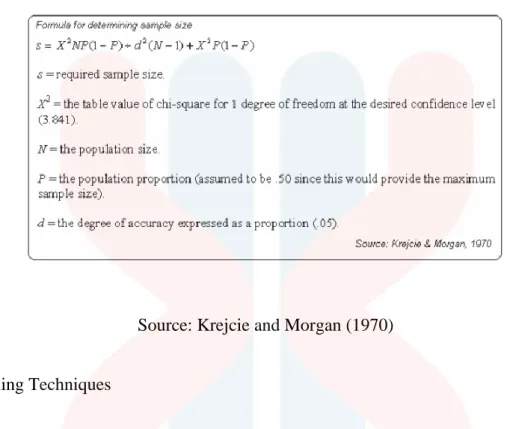
17
Figure 3. 1: Sample size formula
Source: Krejcie and Morgan (1970) 3.6 Sampling Techniques
The sampling technique is a way for picking enough rudiments from a population. A sample analysis and comprehension of its attributes or explanation simplify the properties or characteristics of the population's rudiments for researchers. In the sampling procedure, researchers selected specific population rudiments as the participants of the study. The sampling technique used in this research was a non-probability sampling approach.
The non-probability sampling technique that researchers used was convenience sampling. Convenience sampling is a method of selecting respondents who are already prepared and easily available. This means that there is no pattern in the way these respondents were obtained. As claimed by Simkus (2022), many researchers choose convenience sampling since it has few constraints to follow and allows them to collect huge samples in a short amount of time. It can be employed to enhance the results and simplify sampling. This strategy is especially beneficial for students on a tight budget because it involves little money and experience. In this study, convenience sampling has been used to represent the respondents, and a total of 263 questionnaires were gathered during the procedure.
FKP
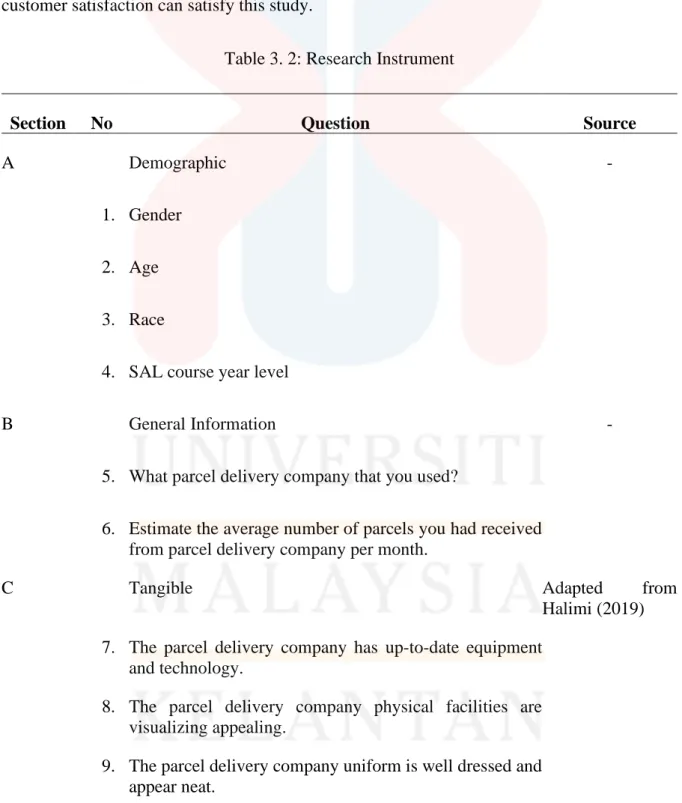
18 3.7 Research Instrument Development
The questionnaire was adapted from the previous study to fit the purpose of this study.
The questionnaire was created to get data of customer satisfaction of parcel delivery company from three SERVQUAL dimensions namely tangible, reliability and responsiveness. Thus, only 13 items which attribute to the dimension stated above and 4 items which attribute to customer satisfaction can satisfy this study.
Table 3. 2: Research Instrument
Section No Question Source
A Demographic -
1. Gender 2. Age 3. Race
4. SAL course year level
B General Information -
5. What parcel delivery company that you used?
6. Estimate the average number of parcels you had received from parcel delivery company per month.
C Tangible Adapted from
Halimi (2019) 7. The parcel delivery company has up-to-date equipment
and technology.
8. The parcel delivery company physical facilities are visualizing appealing.
9. The parcel delivery company uniform is well dressed and appear neat.
FKP
19
10. The appearance of the physical facilities of the parcel delivery company is keeping with the type of services provided.
D Reliability Adapted from
Halimi (2019) 11. When the parcel delivery company promises to do
something by a certain time, it does so.
12. When you have a problem, the parcel delivery company is sympathetic and reassuring.
13. The parcel delivery company is dependable.
14. The parcel delivery company provides its services at the time it promises to do so.
15. The parcel delivery company keep it records accurately.
E Responsiveness Adapted from
Halimi (2019) 16. The parcel delivery company does tell customer exactly
when services will be performed.
17. You receive prompt service from the parcel delivery company employees.
18. Employees of the parcel delivery company are always willing to help customer.
19. Employees of the parcel delivery company are available to respond to customer requests promptly.
F Customer Satisfaction Adapted from
Halimi (2019) 20. I am satisfied with the safety and condition of my parcel.
21. I am satisfied with the postman of the parcel delivery company.
22. I am satisfied with the service provided by customer service of the parcel delivery company.
23. Overall, I am satisfied with the parcel delivery company.
FKP
20
Based on table 3.2, there are seven sections altogether. Section A and B consists of demographic and general information questions, respectively. Section C to Section E consists of questions about independent variables and Section F consists of questions for dependent variable.
3.8 Measurement of the Variable
In this study, responses from the questionnaire were measured using a five-point Likert scale format which ranged from 1 = “strongly disagree” to 5= “strongly agree”.
3.8.1 Independent Variable: Service Quality Dimensions
This measure is based on 23 items that were adapted and correlated with three dimensions SERVQUAL Model developed by Parasuraman et al. (1985) with some changes made to suit this study.
3.8.2 Dependent Variable: Customer Satisfaction
This measure is based on 4 items that were adapted and correlated from the SERVQUAL Model.
3.9 Procedure for Data Analysis
Data analysis is the act of transforming, cleaning, and analysing raw data to produce useful, pertinent information that helps businesses make informed decisions. By providing pertinent information and facts, which are typically presented as charts, photos, tables, and graphs, the strategy lowers the risks involved with decision-making (Kelley, 2022). According to Ali (2021), quantitative data analysis is the systematic collection and evaluation of quantifiable and verifiable data. The primary goal of a quantitative research analyst is to quantify a hypothetical circumstance. The data processing method aids in the reduction of huge
FKP
21
datasets to smaller bits, which make some sense. Furthermore, the goal of data analysis is to help us to better understand the data and draw conclusions. The Statistical Package for Social Science (SPSS) was used to evaluate the data that were received from respondents in this study.
This program is a capable of generating extensive data processing and analysis with simple instruction, such as distribution charts and plots. The descriptive statistics, reliability test, and Pearson correlation coefficient were used to analyse the result of this study.
3.10 Summary
This chapter clarified the target population, sample size, sampling procedure, data collecting, research tool, and data analysis. The researchers learn how to use the research design as well as other components, as a result of this study. This chapter further described how the questionnaire was adapted and how it could be used in this study.
FKP
22 CHAPTER 4 DATA ANALYSIS 4.1 Introduction
This chapter's goal was to present certain statistical approaches' findings and provide a brief discussion of them. There were eight sections in this chapter, starting with this introduction, and they are organized as follows. In section 4.2, the preliminary analysis was presented. In section 4.3, the demographic of the respondent was presented. In section 4.4, the descriptive analysis was analysed from the variables which were tangible, reliability, responsiveness, and customer satisfaction. In section 4.5, the validity and reliability test were measured using Cronbach's Alpha reliability test. In section 4.6, the normality test was done to measure the normality distribution of responses. In section 4.7, the hypothesis was tested using Pearson Correlation which was used to measure the relationship between customer satisfaction with tangibles, reliability, and responsiveness. Finally, in section 4.8 was the summary or conclusion for this chapter. The tool used to analyse the data obtained is the Statistical Package for Social Science (SPSS).
FKP
23 4.2 Preliminary Analysis
The preliminary analysis or the pilot test is done to ensure that the instruction, question, and scale item are clear. On the same kind of persons that would be utilized as respondents in the main study, such as students, the survey measurement was pilot tested. Although the measurement tool was taken from a recent study conducted by Halimi (2019), it was still important to make sure that the study's respondents could comprehend the questionnaire item and give an accurate response. The purpose of the pilot test was to find any questions or items that would offend potential respondents as well as to find any potential problems with the data collection procedure. For this reason, 30 persons were given the pilot test questionnaire, and after completing it, they were asked what they thought of the questionnaire. The findings that were learned during the pilot test are listed below:
a) The respondent made no requests for clarification regarding the questionnaire. It was agreed that each question was simple to understand as a result.
b) It normally takes the respondent 5 to 10 minutes on average to complete the questionnaire.
c) To examine the reliability of the questionnaire, statistical testing was conducted.
When reliability for this questionnaire analysis was examined, it was determined that a Cronbach's alpha coefficient of 0.7 or higher was acceptable. The Cronbach's alpha table is shown below.
FKP
24
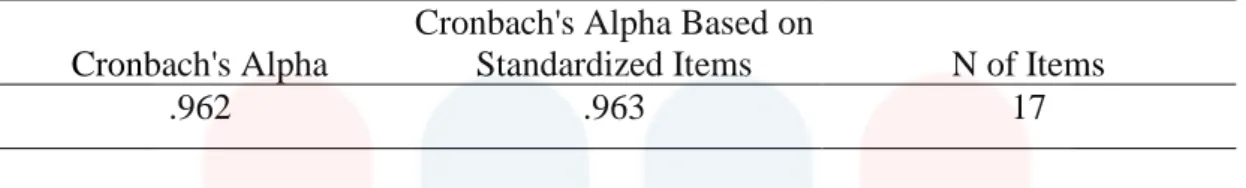
Table 4. 1: Reliability Statistics
Cronbach's Alpha
Cronbach's Alpha Based on
Standardized Items N of Items
.962 .963 17
The table depicts that the Cronbach alpha value is 0.962 which is above 0.7 (out of 17 questions in the questionnaire). Cronbach alpha that is more than 0.7 is considered reliable.
This shows that the pilot testing has a reliable result.
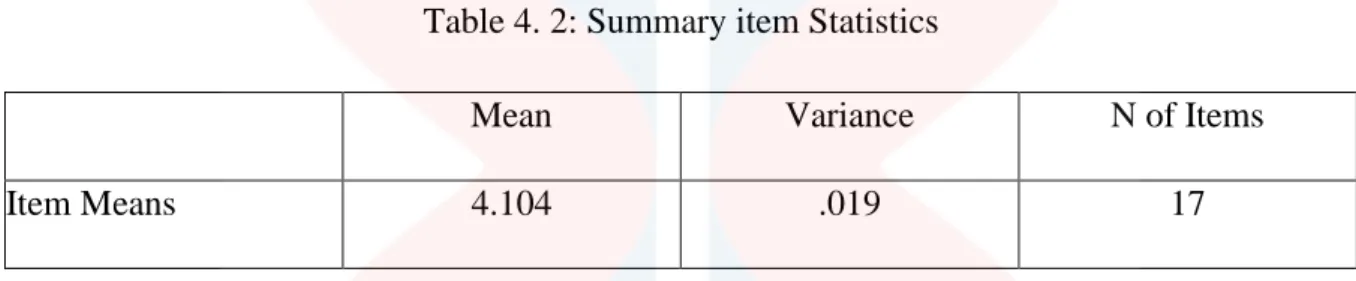
Table 4. 2: Summary item Statistics
Mean Variance N of Items
Item Means 4.104 .019 17
The mean above shows 4.104 which is considered good when it is above 3.50 which shows that the pilot test for the questionnaire is reliable.
FKP
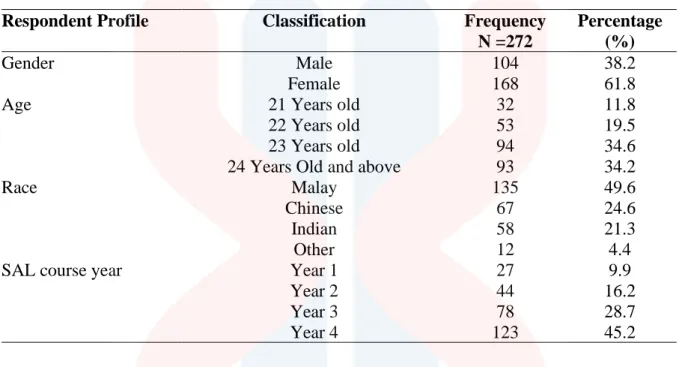
25 4.3 Demographic Profile of Respondents
Table 4. 3: Respondents demographic profile Respondent Profile Classification Frequency
N =272
Percentage (%)
Gender Male 104 38.2
Female 168 61.8
Age 21 Years old 32 11.8
22 Years old 53 19.5
23 Years old 94 34.6
24 Years Old and above 93 34.2
Race Malay 135 49.6
Chinese 67 24.6
Indian 58 21.3
Other 12 4.4
SAL course year Year 1 27 9.9
Year 2 44 16.2
Year 3 78 28.7
Year 4 123 45.2
The contextual profile of 272 respondents had been collected in this research. The table of 4.1 consisted of gender, age, race, and students SAL course year. In this research it showed that 38.2% which was 104 respondents were male while 61.8% which was 168 respondents were female who had participated in this questionnaire. For the age of the respondents, the majority was 23 years old which was 94 respondents (34.6%) while for the age of 24 years old and above there was only one difference which was 93 respondents (34.2%). Respondents from 21 years old were 32 which was 11.8% who participated in the lowest questionnaire and the rest were 22 years old which was 53 respondents which was 19.5%.
From 272 respondents that had been collected, Malays had collected the highest data which was 46.9% (N=135) while 24.6% (N=67) were Chinese respondents. For Indian respondents, 21.3% (N=58) and the rest of 4.4% (N=12) were from other races of respondents.
The highest significant percentage of students of SAL course year was from fourth year students which was 45.2% (N=123). The second place was third year students which was
FKP
26
28.7% (N=78) meanwhile 16.2% (N=44) were from second year students and the rest of 9.9%
(N=27) were from first year students.
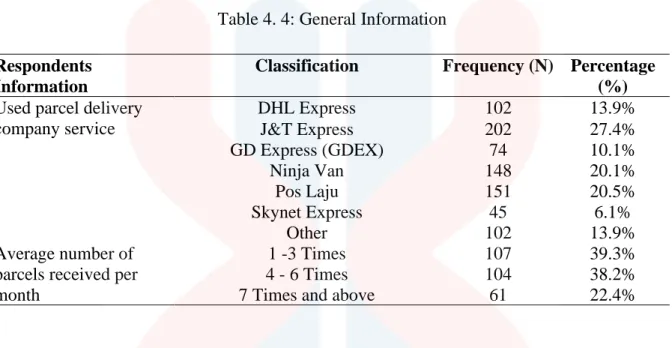
Table 4. 4: General Information Respondents
Information
Classification Frequency (N) Percentage (%) Used parcel delivery
company service
DHL Express 102 13.9%
J&T Express 202 27.4%
GD Express (GDEX) 74 10.1%
Ninja Van 148 20.1%
Pos Laju 151 20.5%
Skynet Express 45 6.1%
Other 102 13.9%
Average number of parcels received per month
1 -3 Times 107 39.3%
4 - 6 Times 104 38.2%
7 Times and above 61 22.4%
Table 4.4 depicted the respondent’s general information about the used parcel delivery company and the average number of parcels received per month. The most used parcel delivery company was J&T Express with 202 of the respondents having used the said company delivery services. Pos Laju and Ninja Van had 151 and 148 respectively; the number of respondents using their services was over 272 respondents. 102 of the respondents had used DHL Express and other parcel delivery services such as Shopee Express and MyLorry while GD Express and Skynet Express had 74 and 45 number of respondents used their service.
Table 4.4 also shows 39.3% of the respondents had 1 – 3 average number of parcels received per month. 38.2% or 104 of the respondents had 4 – 6 average number of parcels per month and 61 of the respondents had received an average 7 times and more parcels per month.
FKP
27 4.4 Descriptive Analysis
One dependent variable (consumer satisfaction) and three independent factors made up the four variables in this study (tangible, reliability, and responsiveness). Analysing each variable's mean was the purpose of this section of the study.
4.4.1 Overall mean score for variables
A 5-point Likert scale was used to calculate the overall mean score, as well as the standard deviation of the variables and sub variables (1=strongly disagree to 5=strongly agree).
Table 4. 5 The overall Mean Score on Each Variable and Dimension Part Dimension Mean Std. Deviation (SD) N
Independent Variable 4.1793 0.53372 272
C Tangible 4.1425 0.59686 272
D Reliability 4.1976 0.60155 272
E Responsiveness 4.1978 0.65165 272
Dependent Variable 4.2482 0.63963 272
F Customer Satisfaction 4.2482 0.63963 272
The dependent variable has a high mean score of 4.2482 and a standard deviation of 0.63963, as seen in table 4.5 above. The mean score for all independent factors is similarly very high, 4.1793, with a standard deviation of 0.53372. Each independent variable has a mean score that was extremely high, which satisfied the criteria. The tangible independent variable mean score of 4.1425 and standard deviation of 0.59686. The reliability mean score is 4.1976 and the standard deviation is 0.60155. The responsiveness mean score is 4.1978 and the standard deviation is 0.65165.
FKP
28 4.4.2 Descriptive analysis for Independent Variables
Table 4. 6: Descriptive Analysis of Tangible Dimension.
No. Tangible Mean SD N
1. The parcel delivery company has up-to- date equipment and technology.
4.06 0.778 272
2. The parcel delivery company physical facilities are visually appealing.
4.15 0.769 272
3. The parcel delivery company uniform is well dressed and appear neat.
4.15 0.744 272
4. The appearance of the physical facilities of the parcel delivery company is keeping with the type of services provided.
4.22 0.751 272
The descriptive analysis for the tangible independent variable in table 4.6 above consisted of four questions. According to a five-point Likert scale with a range of 4.22 to 4.06, the average mean for the tangible independent variable was shown in table 4.6 to be 4.145. To put it into perspective, the question 1 where the parcel delivery company had up to date equipment and technology, had the lowest mean score of 4.06 (SD 0.778). The question 2 where the parcel delivery company physical facilities are visually appealing, had a mean score of 4.15 (SD 0.769). The question 3 where the parcel delivery company uniform is well dressed and appear neat, had a mean score of 4.15 (SD 0.744). Finally, the last question 4 with the highest mean where the appearance of the physical facilities of the parcel delivery company is keeping with the type of services provided, had a mean score of 4.22 (SD 0.751).
FKP
29
Table 4. 7: Descriptive Analysis of Reliability Dimension.
No. Reliability Mean SD N
1. When the parcel delivery company promises to do something by a certain time, it does so.
4.17 0.875 272
2. When you have a problem, the parcel delivery company is sympathetic and reassuring.
4.12 0.799 272
3. The parcel delivery company is dependable.
4.20 0.849 272
4. The parcel delivery company provides its services at the time it promises to do so.
4.24 0.746 272
5. The parcel delivery company keeps its records accurately.
4.27 0.777 272
The descriptive analysis for the reliability independent variable in table 4.7 above consisted of five questions. According to a five-point Likert scale with a range of 4.27 to 4.12, the average mean for the reliability independent variable was shown in table 4.7 to be 4.2. To put it into perspective, the question 1 that when the parcel delivery company promises to do something by a certain time, it does so had a mean score of 4.17 (SD 0.875). The question 2 that when you have a problem, the parcel delivery company is sympathetic, and reassuring, had the lowest mean score of 4.12 (SD 0.799). The question 3 where the parcel delivery company is dependable, had a mean score of 4.20 (SD 0.849). The question 4 where the parcel delivery company provides its services at the time it promises to do so, had a mean score of 4.24 (SD 0.746). Finally, the last question 5 with the highest mean where the parcel delivery company keeps its records accurately, had a mean score of 4.27 (SD 0.777).
FKP
30
Table 4. 8: Descriptive Analysis of Responsiveness Dimension.
No. Responsiveness Mean SD N
1. The parcel delivery company does tell customer exactly when services will be performed.
4.22 0.774 272
2. You receive prompt service from the parcel delivery company employees.
4.20 0.767 272
3. Employees of the parcel delivery company are always willing to help customer.
4.18 0.780 272
4. Employees of the parcel delivery company are available to respond to customer requests promptly.
4.19 0.729 272
The descriptive analysis for the tangible independent variable in table 4.8 above consisted of four questions. According to a five-point Likert scale with a range of 4.22 to 4.18, the average mean for the responsiveness independent variable was shown in table 4.8 to be 4.1975. To put it into perspective, the question 1 where the parcel delivery company does tell customer exactly when services will be performed, had the highest mean score of 4.22 (SD 0.774). The question 2 where you receive prompt service from the parcel delivery company employees, had a mean score of 4.20 (SD 0.767). The question 3, the employees of the parcel delivery company are always willing to help customer, had the lowest mean score of 4.18 (SD 0.780). Finally, the last question 4 where the employees of the parcel delivery company are available to respond to customer requests promptly, had a mean score of 4.19 (SD 0.729).
FKP
31 4.4.3 Descriptive Analysis for Dependent Variable
Table 4. 9: Descriptive Analysis of Customer Satisfaction.
No. Customer Satisfaction Mean SD N
1. I am satisfied with the safety and condition of my parcel.
4.26 0.815 272
2. I am satisfied with the postman of the parcel delivery company.
4.23 0.750 272
3. I am satisfied with the service provided by customer service of the parcel delivery company.
4.22 0.752 272
4. Overall, I am satisfied with the parcel delivery company.
4.28 0.741 272
The table 4.9 above showed the descriptive analysis of customer satisfaction that consist of four questions. The table showed the mean of the respondent for customer satisfaction. Using the Likert scale to get the mean for the dependent variable. The average mean of the dependent variable which was customer satisfaction was 4.2475 according to the table 4.9 above. To put it in deeper perspective, the mean for question 1 where I am satisfied with the safety and condition of my parcel was 4.26 (SD 0.815). For the second question, I am satisfied with the postman of the parcel delivery company, had a mean of 4.23 (SD 0.750). The third question where I am satisfied with the service provided by customer service of the parcel delivery company, had a mean of 4.22 (SD 0.752). Finally, the mean question for number 4 where overall, I am satisfied with the parcel delivery company was 4.28 (SD 0.741).
FKP
32 4.5 Cronbach’s Alpha Reliability Analysis
The reliability coefficient was the amount that inconsistency true to the total of the experiment has been obtained variability. The data was tested using Cronbach’s Alpha analysis to ensure the reliability and interior reliability of the information. The table showed the Rules of thumb of Cronbach’s Alpha Coefficient Range by Hoque and Awang (2016).
Table 4.10 below showed the alpha which was according to Hoque and Awang (2016), it stated that the alpha coefficient value of 0.5 and above can identified as the measure is acceptable to prove the reliability of all variables. Table 4.10 showed the Cronbach’s Alpha Coefficient Range and its internal consistency. The Cronbach’s Alpha which was exceeded 0.7 was considered acceptable; more than 0.8 was good and the rest 0.9 above indicated as excellent. The closer value to 1 influenced the higher the internal consistency reliability of the item.
Table 4. 10: Rules of Thumb of Cronbach’s Alpha Coefficient Range Cronbach’s Alpha Range Level of Reliability
α > 0.9 Excellent
α > 0.8 Good
α > 0.7 Acceptable
α > 0.6 Questionable
α > 0.5 Poor
α > 0.4 Unacceptable
4.5.1 Actual Reliability Test
Table 4. 11: Reliability Coefficient for each Section of Questionnaire.
Dimension No. of Item Alpha Value (α)
Tangible 4 0.792
Reliability 5 0.863
Responsiveness 4 0.792
No. of respondent (N) = 272
FKP
33
Table 4.11 above presented the reliability analysis of the data collected on all independent variables in this research. Referring to the table, Cronbach’s Alpha for each variable in the study included independent and dependent. The range of all variables was situated between 0.792 to 0.863. These high reliability values proved that the whole alpha coefficient values for each variable was acceptable and good condition. As referred to in the table above, the Cronbach’s Alpha values for tangible and responsiveness already got the same which is (α=0.792) and reliability (α=0.863).
FKP
34 4.6 Normality Test
In this study, normality testing was used to determine whether a sample was normally distributed. If the data was normally distributed, Pearson's Correlation would be used to identify the hypotheses; if the data was not normally distributed, Spearman's Correlation will be used to compute the hypotheses.
Table 4. 12: Result of normality Test
Variable Skewness Kurtosis Result
Tangible -1.265 4.131 Normal distributed
Reliability -1.370 3.073 Normal distributed
Responsiveness -1.018 1.982 Normal distributed
Customer Satisfaction -1.310 3.448 Normal distributed
According to what Byrne (2010) had stated, a set of data is considered to have a normal distribution if the skewness value falls within the range of -2 to +2 and the kurtosis value falls within the range of -7 to +7. It was demonstrated that the data had a normal distribution by the fact that the skewness value of each variable was between -2 and 2, and the kurtosis value of each variable was between -7 and +7. These values were found in the table 4.12 that was presented earlier. Since the data followed a normal distribution, the Pearson's Correlation Coefficient would be used in this investigation to investigate the hypotheses regarding the relationships between tangible, reliability responsiveness, and customer satisfaction.
FKP
35 4.7 Hypothesis Testing
4.7.1 Pearson Correlation
Pearson correlation is one of the test statistics used to determine the strength of two variable linear connections. The researchers applied Pearson Correlation Coefficients to discover the significant relationship between the dependent variable (Customer satisfaction on parcel delivery company) and independent variables (Tangibles, reliability, responsiveness).
Table 4.13 had shown the magnitude relationship of Pearson Correlation value, whereas table 4.14 displayed the result of Pearson's Correlation Coefficient, which was utilised to identify hypotheses.
Table 4. 13: The magnitude Relationship of Pearson Correlation Value Pearson Correlation Value, r Magnitude Relationship
1.01 – 0.09 Negligible
0.10 – 0.29 Low
0.30 – 0.49 Moderate
0.50 – 0.69 Substantial
0.70 – 0.90 High
1.0 Perfect
FKP
36
Table 4. 14: The Pearson Correlation Result Customer
Satisfaction
Tangible Reliability Responsiveness Customer
Satisfaction
Pearson Correlation
1 .516** .675** .697**
Sig. (2-tailed) .000 .000 .000
N 272 272 272 272
Tangible Pearson Correlation
.516** 1 .604** .504**
Sig. (2-tailed) .000 .000 .000
N 272 272 272 272
Reliability Pearson Correlation
.675** .604** 1 .752**
Sig. (2-tailed) .000 .000 .000
N 272 272 272 272
Responsiveness Pearson Correlation
.697** .504** .752** 1
Sig. (2-tailed) .000 .000 .000
N 272 272 272 272
**. Correlation is significant at the 0.01 level (2-tailed).
Based on table 4.14, there was a strong positive correlation between customer satisfaction and tangible with an r value of 0.516. The r value between customer satisfaction and reliability was 0.675. This indicated a strong positive correlation between the variables.
There was a very strong positive correlation between customer satisfaction and responsiveness with an r value of 0.697. There was a strong positive correlation between tangible and reliability with an r value of 0.604. There was a strong positive correlation between tangible and responsiveness with an r value of 0.504. There was a very strong positive correlation between reliability and responsiveness with an r value of 0.752.
FKP
37 4.7.2 Multiple Linear Regression
In this analysis, multiple linear regression was adopted to predict the result of parcel delivery company customer satisfaction based on the independent variables which were tangible, reliability, and responsiveness.
Table 4. 15: Model Summary
Model R R Square Adjusted R
Square
Std. Error of the Estimate
1 .742a .550 .545 .43134
a. Predictors: (Constant), Mean_E, Mean_C, Mean_D
This table 4.15 explained the strength of the model’s correlation with the customer satisfaction on parcel delivery company. R, the multiple correlation coefficient indicated 0.742 where a large value indicated a strong relationship between variables. The R-square coefficient of determination implied that 55% of the variation in customer satisfaction could be explained by changes in tangible, reliability, and responsiveness. The remaining 45% indicated that there was no explanation between the customer satisfaction on parcel delivery company and tangible, reliability, and responsiveness.
Table 4. 16: ANOVA
Model Sum of
Square
df Mean
Square
F Sig.
1 Regression 61.012 3 20.337 109.311 .000b
Residual 49.862 268 .186
Total 110.874 271
a. Dependent Variable: Mean_F
b. Predictors: (Constant), Mean_E, Mean_C, Mean_D
According to table 4.16 ANOVA, the value of F was 109.311, with a p-value of 0.000 indicating significance which was less than the 0.05 alpha level. This meaned that three variables were a statistically significant difference between dependent variable and independent variables. Therefore, tangible, reliability, and responsiveness done predicted the
FKP
38
percentage of customer satisfaction on parcel delivery company among SAL students of UMK Kota Campus.
Table 4. 17: Coefficient
Model Unstandardized Coefficients Standardized Coefficients
B Std. Error Beta t Sig.
1 (Constant) .625 .212 2.948 .003
Mean_C .147 .055 .137 2.659 .008
Mean_D .273 .066 .278 4.106 .000
Mean_E .445 .066 .419 6.713 .000
a. Dependent Variable: Mean_F
Based on this table 4.17, an increase of 1 percent of tangible would result in a 14.7 percent increase in customer satisfaction on parcel delivery company while reliability and responsiveness remained unchanged. An increase of 1 percent of reliability would result in a 27.3 percent increase in customer satisfaction on parcel delivery company while tangible and responsiveness remain unchanged. An increase of 1 percent of responsiveness would result in a 44.5 percent increase in customer satisfaction on parcel delivery company while tangible and reliability remain unchanged. The result showed that the p-value of tangible (0.008), reliability (0.000), and responsiveness (0.000) were less than 0.05. It indicated that tangible, reliability, and responsiveness were influencing the customer satisfaction on parcel delivery company.
Thus, all three factors were significant predictors on parcel delivery company customer satisfaction.