Developing an Emergency Offshore Hazard Map and risk assessment indices using
Spatial Decision Support System (SDSS) by
Kelvin Wong Toh Kiak 19018
Dissertation submitted in partial fulfilment of the requirement for the
Bachelor of Engineering (Hons) (Civil & Environmental Engineering)
September 2017
Universiti Teknologi PETRONAS Bandar Seri Iskandar
31750 Tronoh Perak Darul Ridzuan
ii
CERTIFICATION OF APPROVAL
Developing an Emergency Offshore Hazard Map and risk assessment indices using
Spatial Decision Support System (SDSS) by
Kelvin Wong Toh Kiak 19018
A project dissertation submitted to the Civil Engineering Programme Universiti Teknologi PETRONAS in partial fulfilment of the requirements for the
BACHELOR OF ENGINEERING (Hons) (CIVIL ENGINEERING)
Approved by,
. (Dr. Abdul-Lateef Balogun)
UNIVERSITI TEKNOLOGI PETRONAS TRONOH, PERAK
September 2017
iii
CERTIFICATION OF ORIGINALITY
This is to certify that I am responsible for the work submitted in this project, that the original work is my own except as specified in the references and acknowledgement and that the original work contained herein have not been undertaken or done by unspecified sources or persons.
. KELVIN WONG TOH KIAK
iv
Abstract
Offshore emergencies such as oil spill present a serious threat to the coastal environment. Consequently, response teams need to act fast in order to minimize the damage done to the environment in the vent of accidental oil spills. This study proposes to use spatial decision support system (SDSS) in assisting decision makers and response teams in their plan to effectively handle offshore emergency and mitigate potential effects. A structured GIS-based multi criteria decision making (MCDM) model is implemented by combining the analytical hierarchy process (AHP) with GIS to develop an emergency offshore hazard map and risk indices. The coastal area of East Malaysia was used as the study area to test the SDSS. A sensitivity index of five categories (very high, high, medium, low, and very low) were produced for the coastline of East Malaysia. The produced map will be useful in offshore emergency such as oil spill to help response team develop and implementing a successful response plan.
v
ACKNOWLEDGEMENT
Upon completion of this research, I would like to express my gratitude to my FYP supervisor, Dr. Abdul-Lateef Balogun for your guidance and patience throughout my research. Thank you for sharing your knowledge and words of motivation which have been an encouragement and self-motivation to myself to finish the project. This project would not have been possible without your constant support.
Next I would like to thank to my fellow colleagues, Shanker A/L Chandrasegaran, Luqman Bin Mohd Noor, Nur Ilyana binti Zainal Arifin for your kind support always. Thank you for your willingness to spend time and help with my research even though each of you are having your own works too.
I would like to express my gratitude to my family and friends for their continuous support in giving me motivation, loves and financial support throughout my whole process in university. Last but not least, an acknowledgement to Universiti Teknologi PETRONAS for providing such a great platform for me to conduct my research and enhancing my skills in applying knowledge, becoming a problem solver and can confidently present my own finding in research.
vi
TABLE OF CONTENTS
CERTIFICATION OF APPROVAL………...Ⅱ CETTIFICATION OF ORIGINALITY………...Ⅲ ABSTRACT………...Ⅳ ACKNOWLEDGEMENT……….….Ⅴ TABLE OF CONTENTS………Ⅵ,Ⅶ LIST OF FIGURES………Ⅷ,Ⅸ LIST OF TABLES……….…….X
CHAPTER 1 INTRODUCTION………...1
1.1 Background of Study………..……...1
1.2 Problem Statement………..……...2
1.3 Objective………..…..2
1.4 Scope of Study………..….3
CHAPTER 2 LITERATURE REVIEW………..…4
2.1 Literature Review………...…4
2.2 Emergency Management………...….5
2.2.1 Mitigation……….5
2.2.2 Preparedness………...……..5
2.2.3 Response………...5
2.2.4 Recovery………...…5
2.3 Offshore Emergency Response……….…….6
2.4 Geographic Information System……….7-8 2.5 What Can We do with GIS?………...8
2.5.1 Visualize Locations………...….8
2.5.2 Visualize Quantities……….….…....…9
vii
2.5.3 The density of features in a given space……….…..……....9
2.5.4 Finding info within a specific area……….…….10
2.5.5 Changes that happen overtime……… ………...10-11 2.6 Analytic Hierarchy Process………..…...12
2.7 Implementation of AHP………..…...12-15 2.8 Hazard Mapping……….……...15
2.8.1 Significance of Hazard Mapping……….………..16
CHAPTER 3 METHODOLOGY………..….….17
3.1 Methodology……….….….…17
3.2 Research Methodology……….…..…17
3.3 Project Development Methodology……….…...18
3.3.1 Identifying Study Area……….…….18
3.3.2 Identifying data/factors……….….…....18
3.3.3 Develop/Ranking the factors……….………18
3.3.4 Test run & analysis result………..………18
3.4 Sensitivity Rank Weightage Using AHP method……….……...20-22 3.5 Implementing AHP ranking into map using GIS………….…....23-37 CHAPTER 4 RESULT & DISCUSSION………...38
4.1 AHP Analysis………...38-46 CHAPTER 5 CONCLUSION & RECOMMENDATION………..47 5.1 Conclusion & Recommendation………...…47,48 References………...49-51 Appendix……….52-56
viii
LIST OF FIGURES
Figure 1: Types of Land………...……..…..8
Figure 2: Cemetery map……….…..9
Figure 3: People Density Map……….….9
Figure 4: Buffer Map………..…....10
Figure 5: Forest change map……….…..…11
Figure 6: Sabah & Sarawak coastline ….………..…….19
Figure 7: Map projection ………...24
Figure 8: Buffer Setting...……….………...…...25
Figure 9: Buffer in Model Builder………..…………26
Figure 10: Buffer Zone 1………27
Figure 11: Buffer Zone 2………27
Figure 12: All 7 Buffer Layer presented in map………28
Figure 13: Merge in Model Builder………...29
Figure 14: Rasterization in Model Builder………....30
Figure 15: Rasterization Zone 1……….30
Figure 16: Rasterization Zone 2……….31
Figure 17: Map & Attribute table after rasterization……….31
Figure 18: Reclassify in Model Builder………...32
Figure 19: Reclassify 1 setting.………..32
Figure 20: Reclassify Zone 1………..32
Figure 21: Reclassify Zone 2………..33
Figure 22: Map & Attribute table after reclassification….………34
ix
Figure 23: Attribute Table Changes.……….…….34
Figure 24: Second reclassification in Model Builder……….35
Figure 25: Reclassify 2 Setting..………35
Figure 26: Final map Zone 1………..36
Figure 27: Final map Zone 2………..36
Figure 28: Map after reclassify to 5 rank…..……….………37
Figure 29: Sensitivity Index…..……….……37
Figure 30: Respondent 1 Zone 1………39
Figure 31: Respondent 1 Zone 2………40
Figure 32: Respondent 1 Map………40
Figure 33: Respondent 2 Zone 1………41
Figure 34: Respondent 2 Zone 2………41
Figure 35: Respondent 2 Map………41
Figure 36: Respondent 3 Zone 1………42
Figure 37: Respondent 3 Zone 2………42
Figure 38: Respondent 3 Map………42
Figure 39: Respondent 4 Zone 1………43
Figure 40: Respondent 4 Zone 2………....43
Figure 41: Respondent 4 Map………43
Figure 42: All Expert Zone 1……….45
Figure 43: All Expert Zone 2……….45
Figure 44: All Expert Map ………46
Figure 45: Sabah Tourism Map……….46
Figure 46: Main Component……….47
x
Figure 30: AHP Analysis 1………37
Figure 24: AHP Analysis 2..……….…….38
Figure 25: Respondent 1….……….……..39
Figure 26: Respondent 2……….……...39
Figure 27: Respondent 3……….……...40
Figure 28: Respondent 4………40
Figure 29: All Expert ………42
Figure 30: Sabah tourism map..……….42
Figure 31: Main Component………..43
LIST OF TABLES
Table 1: Pairwise comparison………...……….….14Table 2: Scale of Relative Importance………14
Table 3: Pairwise Matrix……….15
Table 4: RCI values for different n……….15
Table 5: Type of Factors……….20
Table 6: Pairwise Comparison…….………...21
Table 7: Normalized Principal Eigen………....…..22
Table 8: Converting Eigen Value to Rank (%)……….…..22
Table 9: Geometry Type of Feature Class………..24
Table 10: AHP Analysis 1…… .………....…39
Table 11: AHP Analysis 2………..40
Table 12: Average Calculation………...…45
Table 13: All Expert ranking………...45
1
CHAPTER 1 Introduction
1.1 Background of Study
Accidents occur because of human negligence or mistakes. Accident means an incident that occurs unexpectedly which normally result in injury or damage.
Accidents could happen at anywhere. The same thing could be happening in the open sea. The ocean is very vast and so does the variations of the accidents that could occurred. For example, offshore oil rig mishaps, over turn cruise ship, accident on oil crude tanks ship and etc. These incidents do not only affect humans but also the marine creatures and the marine environment (NOAA, 2017; Chiau, 2005; Singkran, 2003).
Offshore disaster regarding oil spill are labelled as the worst offshore disaster. Let us take the example of BP oil spill in 2010 in the Gulf Mexico. The US government estimate around 4.9 million barrels were spilt into the ocean (NOAA, 2017). This incident had done extensive damage to the marine environment (Laura, 2010).
When accidents such as oil spill occur offshore, the response team could not afford in to waste their time in planning their response plan. With so many complexities in info and factors to decide, it would take time to have an effective response planned (Erman & Dilek, 2011). One of the solution is implementing Spatial Decision Support System (SDSS) into part of the decision making in response team.
SDSS is a support system that provides computerized support for the decision making where there is a geographic or spatial component to the decision. In this case we are using SDSS to help the response team to decide which area of affected ocean are the most vulnerable and have the highest priority to be secured in order of significance.
SDSS would use GIS to help get accurate info on geographical data of the affected offshore area and then would rank it which the index/factors to determined which area are more critical. This is important in minimizing an offshore emergency effect on the marine environment and saving life.
2 1.2
Problem Statement
Determining an appropriate response plan during an offshore emergency such as oil spill is usually a challenging risk. For example, the response team may have no access to accurate information about the incidents. They may also have conflicting opinion from everyone involve in the response plan.
Determining priority areas in forms of sensitivity and exposure to oil spill during offshore disaster is essential in planning an appropriate response strategy. This is because delayed emergency response or lack of clarity on the level of priority of the various factors lead to more live lost and environmental damage. Being unable to come out with a priorities list fast enough often lead to delayed emergency response. This is a very deadly mistake as in offshore emergency which often involve big disaster such as oil spill, every seconds there could be hundreds or thousands of oil barrels leaking into the ocean causing massive damage to the environment (The International Tanker Owners Pollution Federation Limited, 2011). Therefore, it is necessary to develop a reliable offshore hazard map capable of guiding rescue teams during offshore emergency.
1.3
Objective
This study aims to develop an offshore hazard map through spatial decision support system (SDSS). The objectives of this research are as follows:
• To identify the important factors that are likely to be affected when an emergency situation occurs offshore such as oil spill.
• To Rank the factors in-order to identify their level of importance using the AHP MCDM model.
• Develop a risk-susceptibility map using SDSS
3 1.4 Scope of study
This project uses an offshore study area in order to provide timely information and guidance to offshore emergency response teams. The project will help them in making decision and planning out their response plan by ranking the affected area in order of importance and sensitivity. This is done by combining usage of geographic information system (GIS) along with a decision support system (DSS). GIS allows user to visualize, query, analyse and interpret data to understand relationship between spatial entities. This project focuses on entities within the ocean environment. While the DSS is a system which helps user in making decision. The core of DSS is multi- criteria decision analysis. This project will be focusing on the analytic hierarchy process (AHP) which is among the many ways of MCDA. AHP is used in the process of ranking the factors/index that should be taken into account in case of an offshore emergency. In an emergency response, there should be a few number of factors to be considered such as property damage, lives and environment. However, in this project we will focus on the environment effect of marine disaster.
4
Chapter 2
Literature review
2.1 Literature Review
When it comes to offshore disaster, it involves everything that unexpectedly happen at the open sea. These disasters range from heli-crash, shipwreck and platform failure. It is very often linked to oil spill as oil spill would have far more devastating impact to both human and environment (Gabrielle et al, 2017).
For example, let us look back at the Exxon Valdez oil spill incident. It occurred in Prince William Sound, Alaska in March 24, 1989. This incident involved an oil tanker owned by Exxon Shipping Company that struck the reef and spilled 10.8 million US gallons of crude oil to the sea over the next few days. While this catastrophic event might not be the biggest oil spilt spill in history, it is considered to be one of the most devastating oil spill incidence due to the severe environmental damage it caused. This incident underscored the significance and sensitivity of environmental factors to offshore oil spill. There were many factors that complicate the response team plan such as the volume of oil spill or the incident occur at a remote area where accessibility is limited. It is stated that in “The Exxon Valdez oil spill: A report to the President (1989)” that both Exxon company and Alyeska (federal government) are not ready for the seriousness of this oil spill. They didn’t have the enough resources to contain the oil spill at initial stage. This eventually cause the coastal environment at Prince William Sound had a serious damage. The oil slick spread over a total of 1990 km shoreline thus contaminating them. It was known that around 2000 sea otters, 302 harbor seals and about 250000 seabirds died in the next day following the oil spill.
This is only the immediate effects of oil spills (Sarah Graham, 2003). Twenty five years after the incident, there was only 13 out of 32 monitored wildlife population, habitats and resources services that were initially affected being categorized as
5
“recovered” and “very likely to recover” (Marybeth, 2014). The other species such as orcas are predicted to go extinct as they are not reproducing overs the years and there only left one female orcas. The focus of this incidents is that how a simple act of delayed or insufficient respond plan could bring a devastating effect on the environment. Therefore, it is very crucial to respond quickly and with the right response plan in an offshore emergency.
2.2 Emergency Management.
Emergency Management has been studied and categorized into four phases:
2.2.1) Mitigation
It is described as a process of preventing future emergencies that prevent an emergency, reduce percentage of an emergency occurring or even reducing the damage done by an emergency. For example having a better safety rules or a better response plan.
2.2.2) Preparedness
It is described as plans or preparation made to save lives and help response
& rescue operations. For example evacuation plans and stocking food are examples of preparedness. It takes place before an emergency.
2.2.3) Response
It is described as actions taken as soon as possible when an emergency occurs with goals to save lives and prevent further damage. It is putting the preparedness plan into action. It take place during an emergency.
2.2.4) Recovery
It is described as actions taken to return a normal/safer situation after an emergency. It often include financial support to rebuild the affected part. It takes place after an emergency (Baird, 2010; Restore Your Economy Organisation, 2017).
6 2.3. Offshore emergency response
If the offshore emergency response does not involve oil spill, the focus of the response team are narrow down to few factors only which are the property damage (ship, helicopter, etc.) and human lives. However, if an oil spill occurs offshore, it makes the whole situation much more complicated by having more factors to be considered to rescue. These factors might be the condition of the environment, sensitivity of the area to oil spill, and a lot more. A good response plan is a plan that takes into consideration of all these factors. However to have these information fast is an obstacle for the rescue team and might delay any response from the team. Besides, ranking the affected areas and factors in terms of their significance after getting info is also a very complicated process. Many people have their own opinion of importance to each element that are affected in an emergency offshore. For example, a CEO of company might prioritize his/her property damage while civilians may prioritize the pollution caused. All these are obstacles/confusion faced when it comes to decide a response plan which often lead to a delayed or a bad response plan being carried out causing tremendous damage to human and environment due to the waste of time in responding to the disaster. Therefore, a system which could gather all the data fast accurately and help prioritize the affected area fast and minimal or no bias is very much needed. A GIS based decision support system in emergency disaster situations offshore can help solve the problem quickly and guide response teams in planning their rescue plan accurately. It is important to highlight which areas are the more critical in order of sensitivity and significance. This would help the response team to mobilize their resources or equipment to the prioritized area. Having a good response plan and the right resources in handling an offshore disaster could greatly minimize the damage done (NOAA, 2017). Thus, this study focuses on decision making and developing a risk-assessment index map of the affected area so that the response team can rapidly decide how to optimize their limited resources from the most important to the least important risk factors within the affected areas.
7 2.4 Geographic Information System
A geographic information system (GIS) is described as a system to capture, store, manipulate, analyze, manage, and visualize all types of geographical data. Some portion of the data is spatial as the essence of this system is Geography. It means that these data would be related to real location on earth (University of Wisconsin-Madison Libraries, 2017).
Normally come with these spatial data is usually tabular data known as attribute data. Attribute data are data that’s further describe the spatial data such as color, size, population and etc. (ESRI, 2017). An example of this would be village. The actual location of the village is the spatial data.
Attribute data of this village would be the additional data that further describe about the village such as population of the village, how many houses in village, size of village and etc. GIS are able to be such an efficient problem solving tool in spatial analysis due to the combination of these two data types.
GIS is more than just software. People and methods are combined with geospatial software and tools, to enable spatial analysis, management large datasets, and the display of information in a map/graphical form.
The coastal zone systems consist of complex dynamic and spatial nature which made GIS particularly suitable for the job as GIS has the ability to handle and analyse voluminous data set (Fabbri, 1998; William and Alan, 2009; Jon and Qian, 2011). GIS also has the potential to help in coastal zone management such as handle much bigger databases, to integrate and analyze data, collection of data, and compare alternative management scenarios before a proposed plan is imposed on the real world (Barlett,2000; Zahir and Abdul, 2013). Kennan (1997) discuss the role of GIS as a DSS generator to create a spatial decision support system (SDSS).
8 A research done by Pincinato and his team in 2009 had proved that GIS stand a powerful resource to fulfill the limitations of traditional environmental sensitivity maps. The GIS software is used to assess the environmental sensitivity to oil spill in the northern of Saopaoloy province in Brazil (Pincinato et all., 2009).
2.5 What can we do with GIS?
GIS is a very useful tools to help in problem solving and decision making processes including visualize the data in s spatial environment. Geospatial data can be analyzed to
2.5.1. Visualize locations.
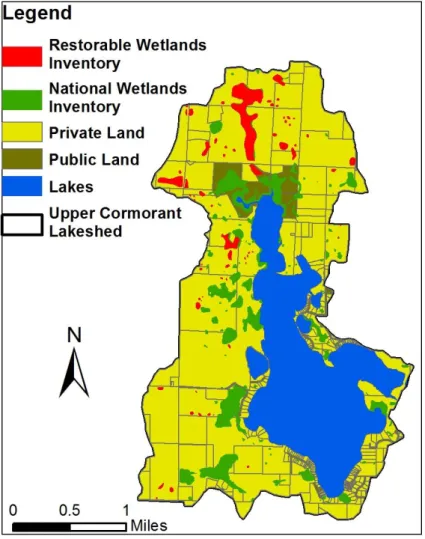
GIS allows visualizing the data location. The spatial location of real-world features can be mapped and visualize the spatial relationships among them. Example as below the map show the class of land. We can visualize the different type of land are divided to and where they are located on map.
9
Figure 1: Types of Land (RMB Environmental Laboratories, 2017).
2.5.2. Visualize quantities.
Data that represent quantities could be presented in map telling us which location has the most and the least amount of desired entities. This help user to find places that meet their criteria or to determine the relationship in between places.
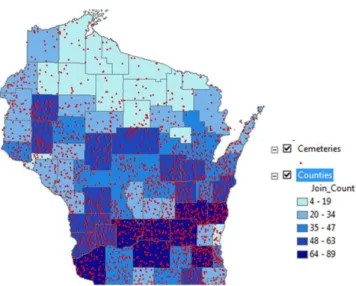
Example: Below is a map of cemetery in Wisconsin. The map contains dots which represent cemetery locations and each county is color coded to show where the most and least are. Darker blue represent higher number of cemeteries while the lighter blue represent the fewer cemeteries
10
Figure 2: Cemetery Map (University of Wisconsin-Madison Libraries, 2017).
2.5.3. The density of features in a given space.
GIS is able to visualize density, or a quantity normalized by area or total number in map. Example: Below is the map about the population density of Manhattan.
Figure 3: People Density Map (University of Wisconsin-Madison Libraries, 2017).
2.5.4. Finding info within a specific area.
Geoprocessing tools like BUFFER enable us to find out the information we needed within a specific area. Example: Figure below show the buffer zone within specified radii of a simulated explosion.
11
Figure 4: Buffer Map (University of Wisconsin-Madison Libraries, 2017).
2.5.5. Changes that happen over a period of time.
We can also map the changes that happen in an area over a period of time. This allows user to have their analysis and further predict the changes are coming. It is extremely useful for planning the resources and urban planning. Example: Below show how the forest in certain area changes from 2006 to 2011. Using the info, government can predict the urban development and maybe reserve the land to ensure not too much forest are destroy.
12 Figure 5: Forest Changes Map (Dunne, 2012).
13 2.6 Analytic Hierarchy Process
When handling multiple, conflicting factors such as in a coastal environment, it is necessary to have a system that can help response team in making their decision. This is where multi criteria decision analysis (MCDA) are helpful. MCDA is a collection of techniques that could take into consideration quite a number of factors and criteria in helping the user in making their decision (Johnson et al., 2005; Marco et al., 2005;
Aris and Panos, 2017). Analytic Hierarchy Process (AHP) is one of the method use for MCDM. It is introduced by Thomas Saaty (1980). It’s effectiveness in dealing with complex decision making and be able to aid decision makers to set priorities and make the best decision. AHP allow some inconsistency in judgment as human are known not to be always consistent
AHP works by generating a weight for each evaluation criterion based on the decision maker’s pairwise comparison of criteria. The higher the weight the more important the criterion. A score is assign to each option according to the decision maker’s pairwise comparisons of the options based on criterion. Lastly having combined both the criteria weights and options scores will be determining a global score for each option and a consequent ranking (Evangelos and Stuart, 1995; Nathasit and Dundar F., 2007; Jorge et al., 2015).
2.7 Implementation of AHP 2.7.1 Pairwise Comparison.
In order to compute weight for different criteria/ factors, AHP started by creating a pairwise comparison. For example, there are Factors A, Factors B, Factors C and we need to create a pair wise comparison. Each factor are required to compare with each other which would resulting to 3 pair wise comparison. For each pair, evaluators are needed to give values based on their preferences. Example of intensity of importance are given in Table 2.
14 TABLE 1: Pairwise comparison
Factor A Factor B Factor B Factor C Factor C Factor A
Table 2: Scale of Relative Importance (according to Saaty 1980)
15 After comparing and giving the each pairwise combination, a matrix could be formed as the following. For example, the criterion is to find which factor is more important.
TABLE 3: Pairwise Matrix
More important A B C
A 1 5 8
B 1/5 1 4
C 1/8 1/4 1
After having this matrix, the next step is by estimating the right principal eigenvector.
The corresponding maximum left eigenvector is approximated by using the geometric mean of each row. That is, the elements in each row are multiplied with each other and then the n-th root is taken (where n is the number of elements in the row). Next the numbers are normalized by dividing them with their sum. This is known as priority vectors. The AHP pairwise judgment are considered consistent if the consistency ratio (CR) is less than 10%. The consistency ratio is calculated by dividing
CI [CI = (λmax - n)/(n - 1)] with RCI (given in table 4) .
n 1 2 3 4 5 6 7 8 9
RCI 0 0 0.58 0.90 1.12 1.24 1.32 1.41 1.45 TABLE 4: RCI values for different n.
16 Last step is the synthesis step. Now the priority vectors become the column of the decision matrix. Using the same pairwise comparison, the weight of each criteria is decided. For example, if a problem has M alternatives and N criteria, then there is a need to construct a judgment matrices of N of order MxM (one for each criterion) and of order NxN (for N criteria). Finally, given a decision matrix the final priorities, denoted by , of the alternatives in terms of all the criteria combined are determined according to the following formula.
2.8 Hazard mapping.
The process of visualizing the information of a study area of varying coverage, detail and scale is called hazard mapping. This is defined by the World Health Organization in the Glossary of Humanitarian Term. The map could contain of a single hazard information such as flood and firestorm, or having more than one hazard information by combining multiple type of hazard information into one map. The benefits of having a hazard map is that it visualized the information in map form and are easy to be understand by the decision makers and planners. The limitation of hazard mapping is the volume of information required for natural hazards management, often exceeds the capacity of manual methods. This drives the usage of computer assisted system into the mapping process (Defined Term, 2008).
17 2.8.1 Significance of hazard mapping
Over the years, it is obvious that when it comes to effective disaster prevention and mitigation, it entails two important aspect. First would be the accessibility of accurate, readily, understandable and timely warnings. The second aspects would be the response of people when there is a disaster warnings given. Both aspect require a reliable hazard maps that depict the hazards in the community. It is important that these hazard maps are up to date and accurate because even if all plans are well executed, will fail if they were based on the wrong information (Alfedo, 2016).
Let’s take the example of 2012 Baragay Andap disaster in New Bataan to learn the significance of hazard mapping. The area was hit by Typhoon Pablo (International name, Bopha) which causes a massive landslide that took away a total of 612 lives.
From the 612 lives, more than 500 were perished in the evacuation center which located in the landslide path (NOAH, 2012). This only tells us that if there was a hazard map used in the evacuation center planning, the map is probably very inaccurate. Otherwise, the evacuation center would not be placed there or the authorities would not have the refugees take shelter there. This prove that hazard map are very important either in planning or in respond plan for a disaster. The same lesson could be applied on coastline for oil spill disaster. The only difference is the type of information to be consider for an oil spill disaster in order to produce a hazard map.
18
Chapter 3
Methodology
3.1. Methodology
This project is given a duration of 7 months to be completed. The methodologies for this project are divided into two parts, which are research methodology and development methodology.
3.2. Research methodology
This part of methodology involved the gathering and collection of relevant data to the project. Following are the platform used:
3.2.1 Academic research materials.
By referring to the previous academic materials which are related to my projects managed give author a basic guideline on author projects through online reference.
3.2.1.1 Advise/ Feedback from experts
The ranking and judgment done in the criteria used in AHP are all done by experts which are related to the field. This were done by sending the experts a form with a list of pairwise comparison of factors and they are required to give their judgment based on their preferences.
19 3.3 Project development methodology
3.3.1 Identifying study area
First step is to identify on which area we should study. This is done by looking at the amount of information we can get on. The chosen area should have all the data needed to carry out this project.
3.3.2 Identifying data/ factors
This is the next phase of a project development phase. Start identifying the important data based on the study area chosen. This paper aims at identify the type of factors/element that are prone to damage or destruction when there is an oil spill occur offshore.
3.3.3 Develop/ Ranking the factors
After identifying the risk factors through experts’ feedbacks and recommendation, each factor would be ranked based on their relative level of importance using AHP model.
3.3.4 Test run and analysis the result
Test run the project develop by using the data from the chosen study area. Analysis the results.
20 Our mapping system basically are made up of three main part. First is the input data.
This included our base map (Sabah & Sarawak) and all the different layers of the data we could had. From all those data/shape file, I then chose only those relevant to my project (which are the environmental factors). Below shows my study area and the factors that I sorted out based on my study area.
Figure 6: Sabah & Sarawak coastline
Table 5: Type of Factors
Symbol Type of Environmental factor
A1 Aquaculture Fish A2 Turtle nesting
A3 Coral reefs
A4 Crab fishing
A5 Crocodiles
A6 Dolphins
A7 Mangrove
A8 Prawns
A9 Shorebirds
21 Pair wise inputs
3.4 Sensitivity Rank Weightage Using AHP method.
Four respondent were given each an AHP survey questionnaire on the case study of coastal area of East Malaysia. They were required to rank the factors identify from the study area using AHP method. The respondent are chosen based on their field of expertise which are related to offshore or coastal field. With their expertise and experience in the field, it really helps in giving accurate ranking to the factors. Using Microsoft Excel, I have created a template in which will analyze their ranking and ultimately have the mean average of each factor weightage in the sensitivity risk index.
Table 6: Pairwise Comparison
Normalization
This step is done by totaling the numbers in each column. Each entry is then divided by the column sum to yield its normalized score. Noted that the sum of each vertical column should be 1.
22 Table 7: Normalized Principal Eigen
From above steps we should get our normalized principal eigen which is also our priority vectors. Then we get the percentage by converting this values into percentage.
Table 8: Converting Eigen values to Rank(%)
Eigen 0.27 0.03 0.02 0.17 0.03 0.02 0.09 0.18 0.18 Rank(%) 26.90% 2.98% 2.44% 17% 2.97% 2.04% 9.11% 18.20% 18.25%
Normalization for A2 0.11/3.65 = 0.03
Normalize Principal Eigen
= Average of the horizontal column.
23 Then using this formula to get the consistency ratio.
Consistency ratio are calculated by dividing consistency ratio with Random Index (in our case it is n, 9= 1.46). Noted that if the consistency ratio is more than 0.10, the evaluation has to redo as it is deem not accurate and it is advisable to ask the respondent to reevaluate the questionnaire.
24 3.5 Implementing the AHP ranking into the map using GIS.
GIS is best suited for this task as coastal area. GIS are able to relate the non-spatial data to a spatial data. In this case, I am adapting the suitability analysis into ranking the sensitivity of the coastal area. For a most sensitive area, the rank would be given as 1 while the least sensitive area would be given as 9. The following steps were used to generate a risk sensitivity map:
3.5.1 Identification of data type.
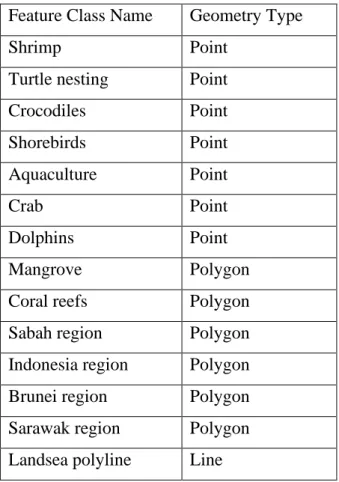
From the data file which I acquired from UTP-Petronas collaboration, I identify there is a total of 14 layers of shapefile which is related to my work. Seven out of the fourteen layers are regarding the environmental factors while the rest are to represent the map of Sabah and Sarawak. The geometry type of layers for each shapefile are shown in the table below:
Table 9: Geometry Type of Feature Class Feature Class Name Geometry Type
Shrimp Point
Turtle nesting Point
Crocodiles Point
Shorebirds Point
Aquaculture Point
Crab Point
Dolphins Point
Mangrove Polygon
Coral reefs Polygon
Sabah region Polygon Indonesia region Polygon Brunei region Polygon Sarawak region Polygon Landsea polyline Line
25 Note that these data files came without any determined projection and had no coordinate system known. In order to identify the original coordinate system used, I implemented the “brute force method” as described by one of the GIS user in Geographic Information System forum. (Polygeo, 2017) This is done by taking a layer of known coordinate system from MapCruzing which is supposed to overlay with the original data layer. Now an educated guesses is made on what the possible coordinate system layer should be and a projection for each guess is done until the two data layers match. The data are located at Borneo Island and this give hint that the projection system options should be as listed below:
-Timbalai 1948 RSO Borneo (Meters) -Timbalai UTM Zone 49
-WGS 1984 UTM Zone 49N
Figure 7: Map Projection
As shown in figure 8 above, the map overlay correctly with the layer of known coordinate system which is using the Timbalai 1984 RSO Borneo (Meters) coordinate system. From these, it was correctly deduced that the data layers are in Timbalai 1984 RSO Borneo (Meters).
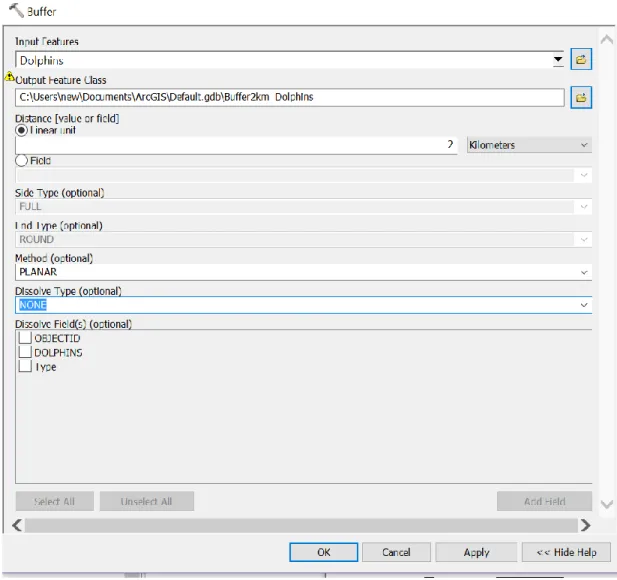
26 3.5.2 Buffer zone
This is done because of two reasons, to give the point a quarantine area and to convert the point geometry file to polygon geometry file. This is required for the next step as merge function only works on the same type of geometry type. A 2km of buffer zone is chosen so that it is easier for user when viewing the entire map. As identified earlier, there are seven layers of feature class in point form.
The buffer function is only applied on these seven layers. Buffer function is dragged into the model builder from Arctoolbox > Analysis Tools > Proximity >
Buffer. Figures below show the setting I used for buffer tool and the results of this step.
Figure 8: Buffer Setting
27 INPUT PROCESS OUTPUT
Figure 9: Buffer in Model Builder
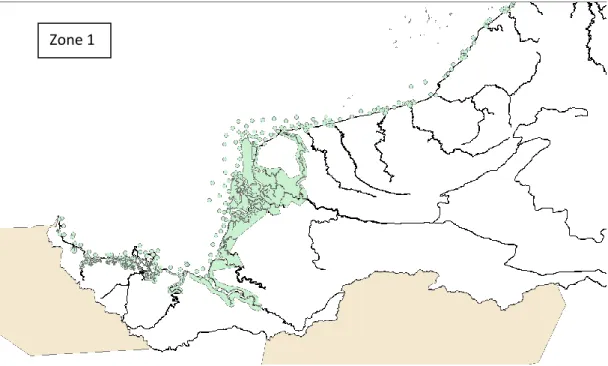
28 Figure 10: Buffer Zone 1
Figure 11: Buffer Zone 2 Zone 1
Zone 2
29 Figure 12: All 7 buffer layer presented in map
3.5.2 Merge
The seven different buffer layer created will then be merge together with coral and mangroves layer to create one new layer in Arcmap. This step is done to ease the management of layers for the process after this. Merge function is drag from Arctoolbox > Data Management Tools > General > Merge into the model builder.
30 Inputs
Output
Figure 10: Merge 1
Figure 13: Merge in model builder.
31 3.5.3 Rasterization of vector layers.
The output from merging process (Merge9Layers) is then converted from vector to raster layer. This is done because the reclassify function only works on raster format layer. The raster function is dragged from Arctoolbox >
Conversion Tools > To Raster > Feature to Raster into the model builder.
INPUT PROCESS OUTPUT Figure 14: Rasterization in model builder
Figure 15: Rasterization Zone 1 Zone 1
32 Figure 16: Rasterization Zone 2
Figure 17: Map & Attribute table after rasterization.
Zone 2
Zone 1
Zone 2
33 3.5.4 Reclassification.
The output values rasterization (Merge9Layers_raster) are then reclassified based on the AHP ranking data using ARCGIS reclassify function. This is done by dragging the reclassify function from Arctoolbox > Spatial Analyst Tools >
Reclass > Reclassify. This step will order the different environmental factors using ranking obtained from AHP process.
INPUT PROCESS OUTPUT Figure 18: Reclassify in model builder
Figure 19: Reclassify 1 setting
34 Figure 20: Reclassify Zone 1
Figure 21: Reclassify Zone 2 Zone 1
Zone 2
35 Figure 22: Map & Attribute table after reclassification
Before reclassification After reclassification Figure 23: Attribute Table Changes
Noted from figure above, the value for each type of environmental factors have changed. The values from one to nine after reclassification represent the importance of each factors in a descending order i.e coral reefs(1) is considered most sensitive by the experts while crocodile(9) is ranked the least sensitive in the list. Then do another reclassify step. This is done to cluster the nine ranking into five cluster of rank to produce the sensitivity index.
Zone 1
Zone 2
36 INPUT PROCESS OUTPUT
Figure 24: Second reclassification in model builder
Choose 5 to group into 5 cluster
Figure 25: Reclassify 2 setting
37 Figure 26: Final map Zone 1
Figure 27: Final map Zone 2 Zone 1
Zone 2
38 Figure 28: Map after reclassify to 5 rank.
Figure 29: Sensitivity Index
New field named Sensitivity_Index is add to the attribute table. This is to ease future reference to know what the values are representing. Note that there is four respondents approached using the AHP questionnaire. Therefore all the steps mention above are repeated for each respondents thus producing four hazard maps. Lastly it is repeated once again for the average of all respondents AHP ranking.
Zone 1
Zone 2
39
Chapter 4
Result and Discussion
4.1 AHP analysis
Below are the result got of using excel template I made to get the weightage from the survey questionnaire:
Table 10: AHP Analysis 1
Based on diagram above Respondent 1 are very much in concern about turtle by giving it 28.27% importance. Compared to Respondent 2, turtle has less significance concern from his/her point of view by giving only 2.97% of importance. This mean that for both respondent there is a difference of 6 ranking places in between their preferences of turtle importance. However for both respondent the factor of aquaculture fish are quite high up in the ranking. The factor fish score a top 3 rank from both point of view.
40 Table 11: AHP Analysis 2
Based on above figure, Respondent 3 are more favorable in factor prawn by 30.35%.
Comparing to respondent 4, prawns are deem to be second least importance by giving 4.11% only. From respondent 3 point of view, he/she thinks that invertebrates are very sensitive to water parameters so any oil spill or disaster would easily wipe out the entire generation. Therefore in Respondent 3 ranking, it priotize the invertebrate like crab and prawn first. However for Respondent 4 he/she just didn’t think that a damage to prawns population would affect the ecosystem greatly. Noted for all respondent the consistency ratio are below 0.10. Only result with less than 0.10 consistency ratio could be accepted as it is deem to be accurate enough to further analyze. Very often one pairwise comparison could result in higher consistency ratio are due to lack of knowledge in the field or the pairwise comparison factors are too confusing to respondents. From the AHP analysis above, the sensitivity index map are produced accordingly to each respondent ranking.
Figure 30: Respondent 1 Zone 1 Zone 1
41 Figure 31: Respondent 1 Zone 2
Figure 32: Respondent 1 map Risk Sensitivity Index
Zone 2
Zone 1
Zone 2
42 Figure 33: Respondent 2 Zone 1
Figure 34: Respondent 2 Zone 2
Figure 35: Respondent 2 Map Risk Sensitivity Index
Zone 1
Zone 1 Zone 2
Zone 2
43 Figure 36: Respondent 3 Zone 1
Figure 37: Respondent 3 Zone 2
Figure 38: Respondent 3 Map Risk Sensitivity Index
Zone 1
Zone 2 Zone 1
Zone 2
44 Figure 39: Respondent 4 Zone 1
Figure 40: Respondent 4 Zone 2
Figure 42: Respondent 4 Risk Sensitivity Index
Zone 1
Zone 2 Zone 1
Zone 2
45 The map above represent the visualization of each respondent point of view in their own ranking regarding the 9 factors. As you can see, each map are different from each other. This is because the different opinion on the importance of each factors by the respondent. In order to produce an overall map which are useable to response team, the average of each factors are taken.
Table 12: Average Calculation
Table 13: All Experts Ranking
The table shown above are the ranking of all experts. The ranking is calculated by taking the percentage average for each factors and then rank the factors again using the new percentage value. From the result coral are prioritizes first then follow by fish, turtle, prawns, crab, mangrove, shorebird, dolphins and crocodile.
46 Figure 42: All expert zone 1
Figure 43: All expert Zone 2 Zone 1
Zone 2
47 Figure 44: All expert
The overall experts ranking are presented in the map shown above. As the legends tell, the red zone would represent a very high sensitivity area, while yellow represent the medium sensitivity area and dark green represent very low sensitivity area. It is shown that the Sabah coastline are much more sensitive to oil spill compared to Sarawak coastline. This is expected result as Sabah coastline is a well-known for its natural beauty of the coral reefs and is among the popular tourism places for divers in Malaysia (Wonderful Malaysia, 2017). This overall map are the final map and this is the map that the response team should base on in making their response plan as it contain all the experts opinions.
Figure 45: Sabah Tourism map (Wonderful Malaysia, 2017) Risk Sensitivity Index
Zone 1
Zone 2
48
Chapter 5
Conclusion & Recommendation
5.1 Conclusion
This project focuses on helping the emergency response team to develop and implement a successful response plan during offshore disaster such as oil spill. By using SDSS, we manage to create an emergency offshore hazard map. This map would provide the necessary information needed for response team to have a good plan which normally would took longer time to get these information. The aim is to create a system that could help quickly identify the affected areas and also give a reliable ranking of the areas and environmental factors to the emergency response team. This would greatly reduce the time in responding and ultimately reducing the damage done by any human offshore mistake. This study has successfully combined MCDA method with GIS to produce an efficient way to analyze and mitigate coastal risks due to offshore activities.
5.2 Recommendation
This project mainly has three main component which are the input, AHP ranking and GIS software. Their relationship are explained below:
Figure 46: Main Component INPUT DATA:
Geographic Data of study area Attribute Data of
the factors
AHP analysis:
Expert ranking using questionnaire
Geographic Information System (GIS)
Sensitivity Index Map
49 GIS analyzes and visualizes the data and AHP analysis into map form. Therefore the accuracy of the map produced depends largely on the accuracy of the input data and AHP analysis from the experts.
In future, hazard maps could be by increasing the type of factors analyzed such as topography, wave movement, type of shoreline, current resources response team have and etc. Another way to improve the map would be consulting a wide range of specialists with diverse expertise in the offshore field regarding the criteria chosen such as a bio ecologist for environment factors, a geotechnical engineering for topography etc. This could also be done by giving another weightage list for the experts based on their background studies. For example, experts with more years of experience, his ranking of AHP factors would be given higher weightage values than the experts that have lesser years of experience.
50
References
Alfredo Mahar Lagmay. (2016). “The Importance of Hazard Maps in Averting Disasters” Retrieved September, 19 from http://center.noah.up.edu.ph/the- importance-of-hazard-maps-in-averting-disasters/
Aris Angelis and Panos Kanavos. (2017). Multi Criteria Decision Analysis for evaluating new medicine in Health Technology Assessment and beyond: The Advanced Value Framework.
Baird, M. E. (January 2010). The "Phases" of Emergency Management.
Barlett, D.J. (2000), “Working on the frontiers of science: Applying GIS to the coastal zone.” In Wright, D.J. And Barlett, D.J. (Eds), Marine and Coastal Geological Information Systems. Pp. 11-24
Chiau, W. Y. (2005). Changes in the marine pollution management system in response to the Amorgos oil spill in Taiwan. Mar Pollut Bull, 51(8-12), 1041-1047.
doi:10.1016/j.marpolbul.2005.02.048
Coskun, E., & Ozceylan, D. (2011). Complexity in Emergency Management and Disaster.
Environment Systems Research Institute. (2017) Retrieved from November, 13 https://support.esri.com/en/other-resources/gis-dictionary/term/attribute%20data Fabri, K.P. (1998), “A methodology for supporting decision making in intergrated coastal zone management, Journal of Ocean & Coastal Management, Vol. 39, pp. 51- 62.
Gabrielle Gordon, Ilan Stari, Uri Sharit, & Ravid Rosenzweig. (2017). Oil spill effects on soil hydrophobicity and related properties in a hyper-arid region.
Gerdsri, N., & Kocaoglu, D. F. (2007). Applying the Analytic Hierarchy Process (AHP) to build a strategic framework for technology roadmapping. Mathematical and Computer Modelling, 46(7-8), 1071-1080. doi:10.1016/j.mcm.2007.03.015
I.L. Mohamed Zahir and M.I.M. Abdul Hameed, (2013). An Integrated GIS for Shoreline Monitoring and Management.
Jarlath O’Neil-Dunne, (2012). “Mapping tree canopy change in the District of Columbia” Retrieved from http://letters-sal.blogspot.my/2012/11/mapping-tree- canopy-change-in-district.html
Johnson, G., K.Scholes and R. Whittington, 2005. Exploring Corporate Strategy: text and cases ( 7th ed). London:Prentice Hall.
Jon Moore and Qian Cui, (2011). GIS Analysis of U.S. Patent Data: Examining Local Innovation Patterns .
51 Jorge Cancela, Giuseppe Fico and Maria T Arredondo Waldmeyer, (2015). Using the Analytic Hierarchy Process (AHP) to understand the most important factors to design and evaluate a telehealth system for Parkinson’s disease.
Keenan, P. (1994). “Oil Spill Sentivity Mapping using a geographical information system,” Departmnet of Geography, University of Edinburgh, Edinburgh.
Laura (2010). "Bird Habitats Threatened by Oil Spill". National Wildlife. National Wildlife Federation.
Wikipedia. 10 List of Maritime disaster. (2017) Retrieved October, 14 from https://en.wikipedia.org/wiki/List_of_maritime_disasters
Wonderful Malaysia. (2017) “10 best dive locations in Malaysia” Retrieved October, 15 from http://www.wonderfulmalaysia.com/faq/10-best-dive-locations-in- malaysia.htm
Marco Cinelli, Stuart R.Coles, Kerry Kirwan. (2014). “Analysis of the potential of multicriteria decision analysis methods to conduct sustainability assestment.”
Marybeth Holleman. (2014, March 25). “After 25 years, Exxon Valdez Oil Spill hasn’t ended” Retrieved from http://edition.cnn.com/2014/03/23/opinion/holleman-exxon- valdez-anniversary/index.html
MapCruzing,(2017) “Download Free Malaysia Country, Citites and Places ArcGis Shapefile Map Layers.” Retrieved from http://www.mapcruzin.com/free-malaysia- country-city-place-gis-shapefiles.htm
National Oceanic and Atmospheric Administration. (2017). “How oil harms Animals and Plants in Marine Environment,” Retrieved from
https://response.restoration.noaa.gov/oil-and-chemical-spills/oil-spills/how-oil- harms-animals-and-plants.html
Nationwide Operational Assessment of Hazards. (2012). “Pablo (2012) Landslide in Barangay Andap, New Bataan, Compostela Valley,” Retrieved from http://center.noah.up.edu.ph/pablo-landslide-barangay-andap-new-bataan/
Restore Your Economy Organisation. “ The Four Phases of Emergency Management,”
(2017) Retrieved from http://restoreyoureconomy.org/disaster-overview/phases-of- disaster/
RMB Environment Laboratories, (2017). “Types of Land.” Retrieved June, 18 from https://www.rmbel.info/consulting/gis-mapping/
Sarah Graham. (2003). Environmental Effects of Exxon Valdez Spills still being felt.
Retrieved from https://www.scientificamerican.com/article/environmental-effects-of/
StackExchange, (2017). “Identifying Coordinates System of shapefile when Unknown?”
52 Retrieved from https://gis.stackexchange.com/questions/7839/identifying-coordinate- system-of-shapefile-when-unknown
Singkran, N. (2013). Classifying risk zones by the impacts of oil spills in the coastal waters of Thailand. Marine Pollution Bulletin, 70(1), 34-43. doi:
http://dx.doi.org/10.1016/j.marpolbul.2013.02.004
The Four Phases of Emergency Management, (2017). Retrieved May,17 from http://www.stlouisco.com/LawandPublicSafety/EmergencyManagement/TheFivePha sesofEmergencyManagement
The International Tanker Owners Pollution Federation Limited.(2011). “Effects of Oil Pollution on the Marine Environment,” Retrieved from http://www.itopf.com/knowledge-resources/documents-guides/technical-
information-papers/
University Of Wisconsin-Madison Libraries. (2017) “Mapping and Geographic Information System (GIS): What is GIS?” Retrieved May, 15 from https://researchguides.library.wisc.edu/GIS
53
Appendix
Survey Questionnaire
Developing an offshore emergency risk sensitivity index using SDSS A case study of the coastal area of East Malaysia.
Introduction
This questionnaire seeks to rank the risk sensitivity of environmental factors that will likely be affected in the event of an oil spill within the study area. Our ongoing research to develop a spatial decision support system (SDSS) that is capable of assisting the users to determine the most critical factors that will be affected by oil spill thus helping them in making a better response plan which is effective and reliable. Two models, the Geographic Information System (GIS) and a suitable Multicriteria Decision Making (MCDM) technique, were combined to develop the SDSS. The proposed SDSS would give a ranking of the factors and area from most critical/sensitive to the least critical area on the risk sensitivity map. This would further help optimize the response plan and prevent any misinformation during the planning phase due to different opinions. Having a risk sensitivity map is crucial to oil spill management because, any delay in response would likely cause severe damage to the coastal environment.
In this questionnaire, various environmental factors are arranged in a comparison matrix as shown in Figure 1 below. You are required to compare the factors in the rows with factors in the column. After careful comparison, you will fill in the appropriate value from the AHP scale of judgement, inside the cross cell of the matrix. See Table 1 below for the AHP scale judgement.
For example, comparing factors A (row) and B (column) in Figure 1, if A is more extremely important (9) than B, please fill in value “9” in the appropriate cross cell (row 2; column 3). The reciprocal value (1/9) should be placed in the reverse
statement position i.e. row 3; column 2. Similarly, comparing factors B (row) and D (column), if B is more strongly important (5) than D, please fill in the value “5” in the appropriate cross cell (row 3; column 5). The reciprocal value (1/5) should be placed in the reverse statement position i.e. row 5; column 3. All other cells should be filled accordingly by comparing one factor (row) against another (column) i.e. A and C, A and D, B and C, C and A, C and B, C and D, D and A, D and C.
54 Please note that the value of comparing C and A (row 4; column 2) will be the
reciprocal value form the comparison of A and C (row 2; column 4). The value from comparison of C and B (row4; column3) will be the reciprocal value from the
comparison of B and C (row3; column4). The value from the comparison of D and A (row5; column2) will be the reciprocal value from the comparison of A and D (row2;
column5). The value from the comparison of D and C (row 5; column 4) will be reciprocal value from the comparison of C and D (row 4; column 5).
A B C D
A 1 9
B 1/9 1 5
C 1
D 1/5 1
Figure 1: Example of comparison matrix.
Table 1: Analytic Hierarchy Process Scale of judgement by Saaty 1990 Intensity of
Importance
Definition Explanation
1 Equal Importance Two elements are of equal importance in the decision making process
2 Weak or Slightly more important 3 Moderate importance of
one over another
Experience and judgement slightly favour one element over another.
4 Moderate plus
5 Strong importance Experience and judgement moderately strongly favour one element over another.
6 Strong plus
7 Very strong importance An element is strongly favourable and its dominance is demonstrated in practice.
8 Very, very strong
9 Extreme importance The evidence of favouring one element over another is of the highest possible order of affirmation.
55
Factors comparison using AHP.
Below are the environmental factors likely to be affected when there is an oil spill occur in the study area.
A1. Fish Aquaculture : This region of area house consumable fresh water fish. With oil spill, this aquaculture would not be functioning.
A2. Turtle nesting : This area is used by turtle for their nesting.
with their population declining, it is important to protect their nesting ground.
A3. Coral reefs : Coral reef are known to be sensitive to oil spill and take a long time to recover.
A4. Crab Fishing : Crabs are sensitive to chemical pollution and it is preferable to save them.
A5. Crocodiles : Crocodiles are also prone to be affected by the oil spill especially those near the mangrove area.
A6. Dolphins : Dolphins are prone to get disease due to contamination from the oil spill.
A7. Mangrove : Oil spill that manage to get to these area most likely to get trap as these are low energy environment. The oil that cover the roots will slowly suffocate the mangrove trees.
56 A8. Prawns : Prawns are invertebrates of the sea and are very
sensitive to toxic from oil spill.
A9. Shorebirds : Past experience showed that shore birds are to be affected also as when they hunt for fish they tend to get cover by black oil.
Using the table below, please rank the factors listed and fill the score in the appropriate cross cell.
A1 A2 A3 A4 A5 A6 A7 A8 A9
A1 1
A2 1
A3 1
A4 1
A5 1
A6 1
A7 1
A8 1
A9 1
To be fill with reciprocal value
57
Respondent Profile
Name :
Organisation/Institution/Company :
Phone :
Profession :
Years of professional experience : <2 / 3-5 / 5-10 / 10-15 / >15 years *
Position :
Degree : Bachelor / Master / Doctorate / Other
………*
Date :
*Choose the appropriate option
General Questions
What is your opinion regarding the integration of spatial decision support system in a response planning of an oil spill?
………
………
………