Submitted project report in partial fulfillment of the requirements for obtaining a bachelor's degree in engineering. The dynamic behavior of the trains was included in the simulation model to improve the accuracy of the study.
General Introduction
Several studies have been carried out to investigate the factors affecting the recovery of regenerative braking energy. Thus, a solution that optimizes the highest amount of regenerative braking back to the system is investigated.
Importance of the Study
The third alternative is to store the energy generated by regenerative braking in an energy storage system (ESS). This project focuses on the effects of the distance to the train station, the maximum speed of the track, the height of the track and the weight of the train under different loading conditions on the efficiency of regenerative braking energy recovery.
Problem Statement
Aim and Objectives
Scopes and Limitations of the Study
Contribution of the Study
Therefore, the research can help the energy storage or inverter sizing activities as it assesses different resulting scenarios such as peak voltage in different system setups and tests. In addition, it can also help with the system placement activities as it examines the effect of distance on the recovery process.
Outline of the Report
Introduction
Train Kinematic in the Railway System
Train Kinematic Formula Modelling
Lomonossoff's equation, the vehicle mass can be obtained by adding the tare and payload masses, as shown in equation 2.2. The train's effective mass Me, on the other hand, should include the train's rotational inertia, 𝜆w, to the tare mass as shown in equation 2.3.
Train Tractive Effort
Engine power often refers to rated power, a power that the engine can sustain based on a specific test technique. These are the fatigue limits of a locomotive to prevent disasters such as engine overheating and damage to the system (Grassie and Elkins, 2005).
Rolling Resistance and Track Grade Resistance
In addition to the rolling resistance, the train also experiences slope resistance which acts as gravity resistance when the rolling stock is traveling uphill or downhill (Grassie and Elkins, 2005). The slope resistance force, shown in Equation 2.5, will be positive when going uphill and negative when going downhill. The tractive force curve, including running resistance and hilling resistance, is shown in Figure 2.2.
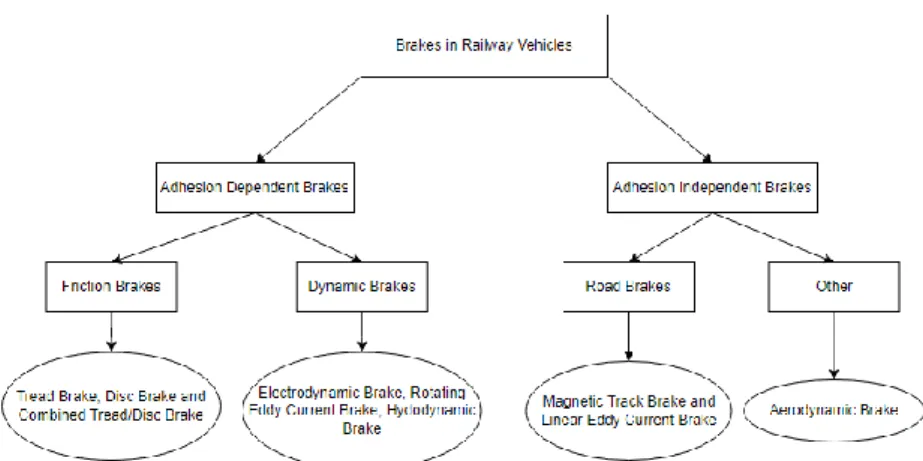
Braking System in Railway
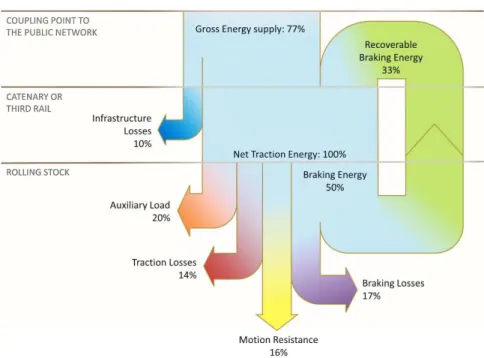
Regenerative Braking
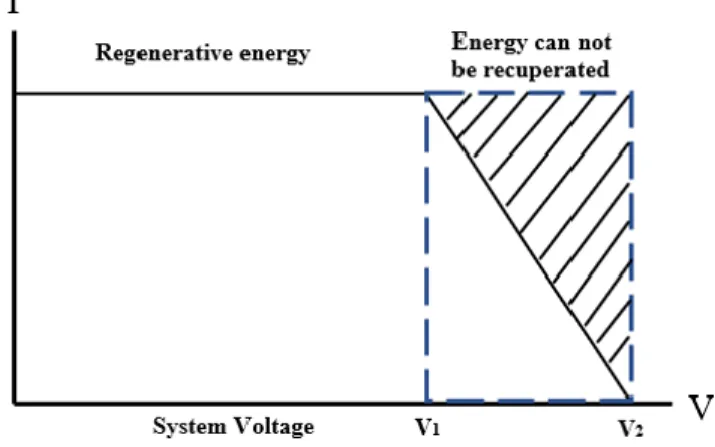
When mechanical brakes are used in normal mode, the kinetic energy is wasted in the form of heat due to frictional force. However, the regenerative braking method has its downside in that the braking systems can occasionally fail due to complex circuits. If so, it raises the tension in the catenary wire, resulting in an unstable system.
When this happens, regenerative braking operations will cease entirely and braking power can alternatively be provided by a mechanical brake. Therefore, well-planned utilization schemes should be assembled when regenerative braking is utilized in the system.
The Effort to Improve the Recuperation of Energy
Selection of Recuperation Methods
Due to reduced transformation losses, braking energy recovery via reversible substations can be considered a somewhat more efficient solution. Other notable advantages of reversible substations over ESS include that they require less space, have less safety constraints, and maintenance does not disrupt the operation of the rail system. However, if fine-tuned analysis is not performed to identify excellent locations, the resistive losses can be relatively significant.
Optimal Siting and Sizing
Through proper optimization of location and size, financial savings of up to 5.84% can be realized and energy consumption savings can reach up to 9% (Wu et al., 2020). In addition to ESS, studies also found that a significant amount of energy can be recovered by choosing an appropriate location for inverters and achieving energy savings (Hosseinipour and Zolghadri et al., 2019).
Summary
Introduction
System Description of MRT Line 2 Malaysia .1 Power supply and distribution system
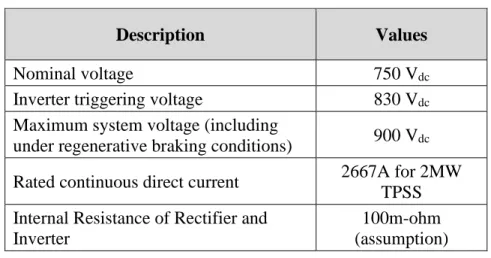
- Traction power system parameters
- Cable Resistance
- Rolling Stock Characteristic
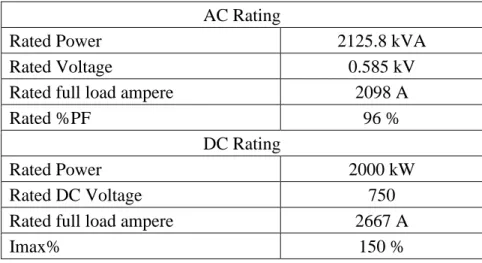
- Inverter Rating
In MRT line 2, there are twenty-eight substations, each with two rectifying transformers and two auxiliary transformers. The resistance increase due to the temperature factor will be disregarded for the case study. The number of axles of the rolling stock is two power cars at the front and rear.
The maximum traction force for rolling stock is 248 kN when the speed is between 0 km/h and 29 km/h. The maximum braking force for rail vehicles is 182 kN at speeds between 6 km/h and 60 km/h.
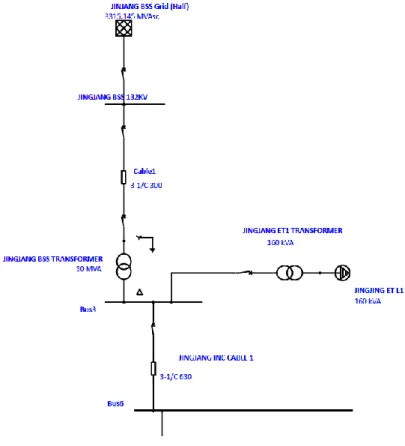
ETAP Modelling of MRT Line 2 Power System .1 Bulk system substation
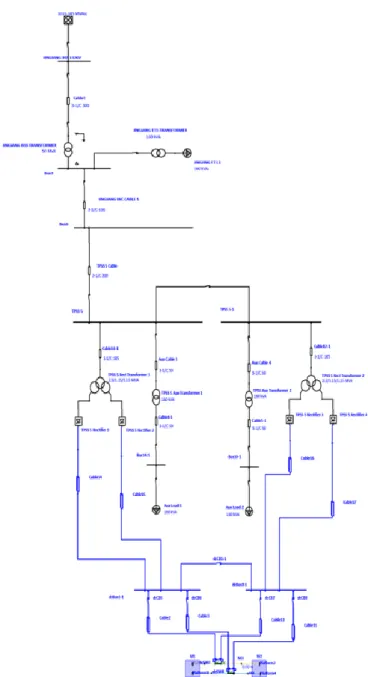
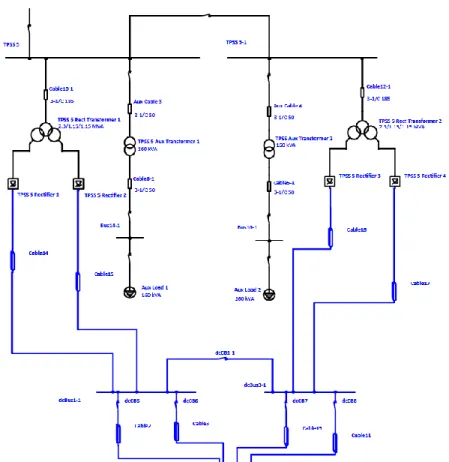
Traction Power Substation in MRT Line 2 DC Rail System Figure 3.5 then shows the schematic of MRT Line 2’s DC electric rail transit
The electric rail transit system is powered by a single traction transformer station (TPSS) located along the railway line. The TPSS consists of 2 rectifier transformers rated at 2.3 MVA for the primary side and 1.15 MVA for the secondary and tertiary sides, which step down and rectify the AC voltage to 750 V DC. The system consists of a north and a south direction, which will receive power from a rectifier transformer to power the trains.
MRT Line 2 Section Modelling
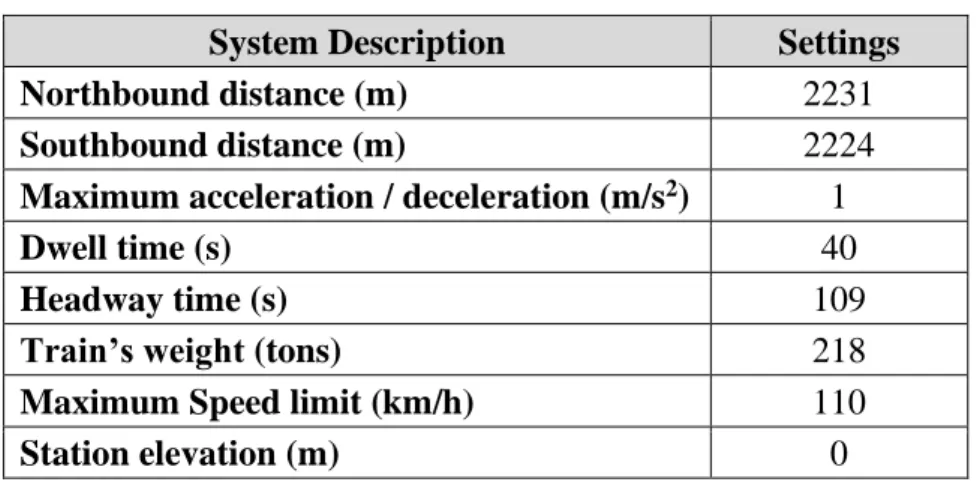
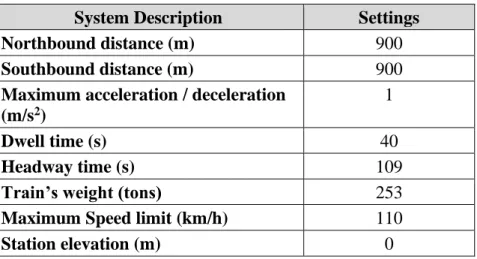
Case studies with the EtraX Simulation Model .1 Initial Condition and Study Cases
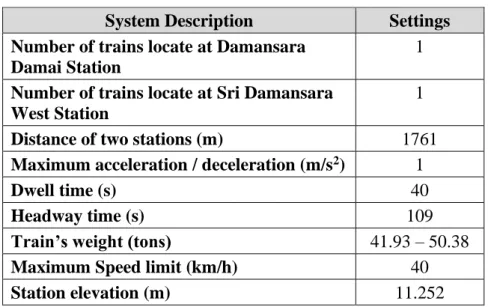
- Case study 1: Effect of Different Stations Distance
- Case study 2: Effect of Different Speed Limits
- Case study 3: Effect of Different Station Elevation
- Case study 4: Effect of Different Train Weight
- Simulation Procedure
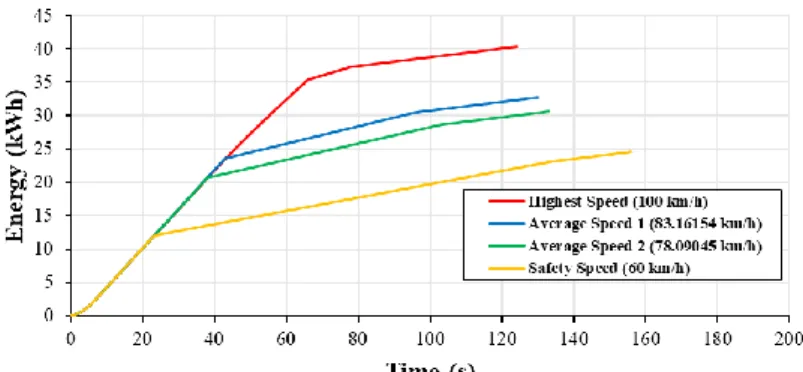
The speed of 100 km/h is the maximum train operating speed, while the 82 km/h and 78 km/h are the two average speeds of the MRT Line 2. In case study 3, the distance is fixed at 2.2 km, and different stations and speeds are reset to 110 km/h with elevations. In case study 4, the train's weight is set to 152 tonnes, 218 tonnes and 253 tonnes according to the loading data provided by the developer with the designation of AW0, AW3P and AW5, respectively.
Move the train from the station until it reaches the adjacent station and brake as shown in figure 3.9. After the completion of the test, the state in which the energy recovery rate is at its peak will be used to create a new model that can be compared with the original state and observe the rate of increase in energy savings.
Practical Testing Data
- Interface Test Procedure and Report for Load Test at Mainline Phase 1
- Interface Test Scenario
- Interface Test Procedure
- Outcome of the Interface Test Procedure
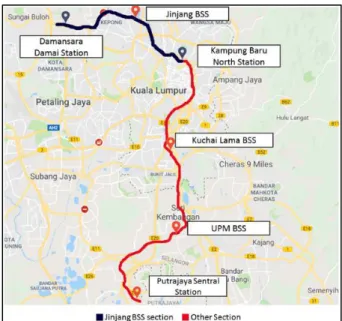
The first test scenario includes the test between the station of Damansara Damai Station and Sri Damansara West Station of MRT Line 2. The second test scenario is located at Kepong Baru Station and Jingjang Station of MRT Line 2. The first test scenario has a geographical condition consisting of longer station distance and higher height between stations.
The second test scenario has a geographic condition with short station spacing with low height between stations. Based on the results from the regenerative braking system in MRT Line 2, by calculating the area under the two power graphs, the energy recovered from the second test scenario is higher than the energy recovered from the first test scenario.
Summary
The recovered energy for the first scenario is about 9.23 kWh, and the second scenario is about 11.3 kWh. However, the results can only be used to formulate a general hypothesis due to limited information.
Introduction
Calculation Method for the Efficiency of the Regenerative Braking System
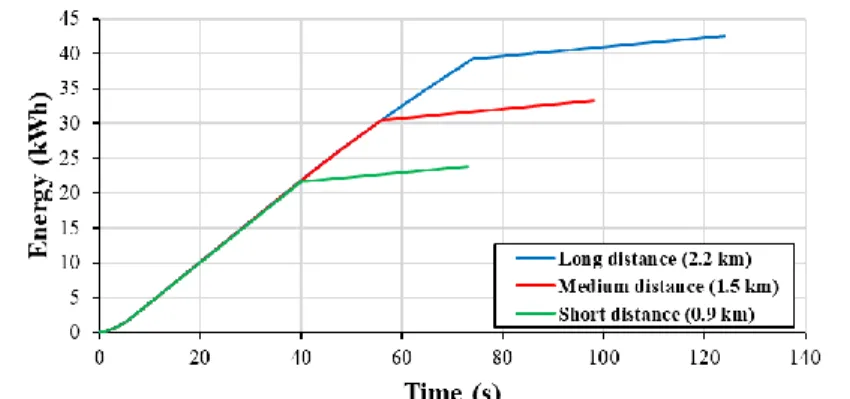
Effect of Different Stations Distance
The middle distance, which is the average distance of all station distances for MRT Line 2, consumes 33.3 kWh. Using regenerative braking, energy consumption is reduced by 60.12% in the longest, middle and shortest distances. Therefore, for the same dwell time and advance time, the higher the station distance, the higher the energy consumption, regardless of whether the system is with or without regenerative braking.
However, shorter distances can cause a significantly higher regenerative braking energy recovered during the braking phase.
Effect of Different Speed Limits
Figure 4.3 shows that when the train is traveling at the maximum speed of 100 km/h, the train consumes 40.4 kWh of energy, and the accumulated energy consumption decreases as the maximum speed decreases. When the target operating speed is reduced, the total power required for operation gradually decreases, reducing overall energy consumption. However, Figure 4.4 shows that when regenerative braking is used, the differences in energy consumption at different speed limits are minimized considerably, with the highest speed consuming only 19.5 kWh at 100 km/h.
When using regenerative braking, the operating speed does not contribute significantly to the total energy consumption. Therefore, as shown in Figure 4.4, the accumulated energy consumption for all speed limits is approximately the same as that of the regenerative braking system.
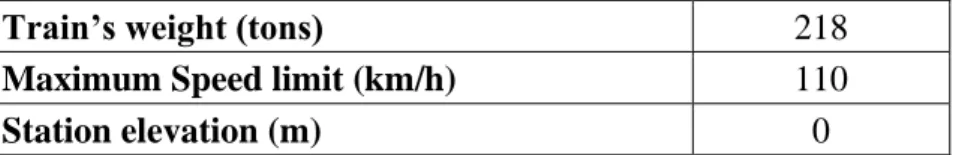
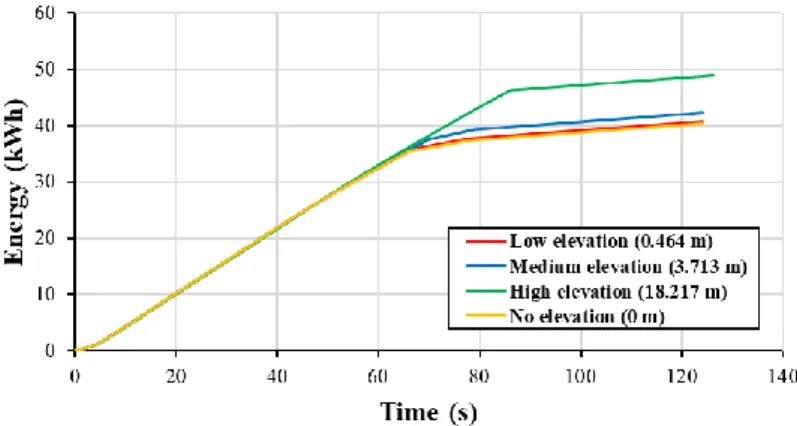
Effect of Different Station Elevation
Table 4.2 shows that when the speed limit is reduced to 60 km/h, the recovery rate decreases significantly. Therefore, at a higher speed limit, the recovery rate of regenerative braking energy will be higher. When the maximum operating speed increases from 60 km/h to 100 km/h, the difference in peak energy is 38.2%.
When there is low altitude, the regenerative braking system can recover up to 50.87% of the energy. However, when the height is 18.2 m, the energy recovery is only up to 37.56%, which shows that the increase in height can cause a decrease in regenerative braking energy recovery.
Effect of Different Train Weight
The test results show that by increasing the weight from 152 tons to 253 tons, the increase in the total accumulated energy consumption can be up to 32% when no regenerative braking is applied and 23.4% when there is a regenerative braking system. Therefore, it shows that the energy recovery in the regenerative braking system increases when more weight is added to the vehicles.
Comparison between worst-case and optimum case
After running the test with the two best and worst cases, the results are shown in Figures 4.9 and 4.10. The energy consumption for the worst case scenario is an energy consumption of 28.02 kWh and an energy consumption of 23.07 kWh with regenerative braking applied. Conversely, the energy consumption for the optimal scenario has an energy consumption of 24.94 kWh and an energy consumption of 9.52 kWh with regenerative braking applied.
As a result, maintaining the optimal scenario of low track lengths, high speed limit, lowest height and highest weight can significantly increase the overall effectiveness of the regenerative braking system.
Summary
The comparisons between the worst case and the best scenario are also examined and discussed. The difference in efficiency between the best and worst cases can be as much as 44.16%.
Conclusions
Recommendations for future work
Research on the influence of braking conditions on regenerative braking energy recovery for electric vehicles International Symposium on Electric Vehicles Research on the influence of braking conditions on regenerative braking energy recovery for electric vehicles. Energy-efficient placement of reversible DC traction power stations in urban rail transport through regenerative energy recovery. Energy storage based smart electrical infrastructure and regenerative braking energy management in AC-Fed railways with neutral zones.
Effectiveness and optimal placement of bi-directional substations for regenerative braking energy recovery in the electrical network of the metro system.