Prepared by:
Department of Electricity Supply Regulation Energy Commission
FOREWORD
In the year 2007, the maximum demand for the grid system in Peninsular Malaysia increased by 4.8% from 12,990 MW attained in 2006 to 13,620 MW which was recorded on 8 August 2007. The total installed capacity increased by 1,400 MW with the commissioning of two coal-fired generating units of capacity 700 MW each in Tanjung Bin Power Station, Johor in February 2007 and August 2007. With these additional capacities, the total installed generation capacity at the end of 2007 stood at 19,723 MW, which was a 7.6% increased from 18,323 MW in 2006. Of the total installed generation capacity in 2007, 32.2% or 6,346 MW are owned by TNB and 13,377 MW from the IPP’s generation plants {including Janamanjung power station and Kapar Energy Ventures Sdn. Bhd. (KEV)}. In Peninsular Malaysia, under such supply-demand scenario, the system reserve margin in 2007 stood at a comfortable level of 45%.
The electricity demand growth in Peninsular Malaysia for the next five years is forecasted to increase at an annual average of 4.4% from 14,281 MW in year 2008 to 16,927 MW in year 2012. In line with the forecasted growth, the demand for electricity also is expected increase to 112,740 GWh in year 2012 from 95,106 GWh in year 2008.
In Peninsular Malaysia, a coal-fired power generation project by Jimah Energy Venture Sdn. Bhd. at Mukim Jimah, Port Dickson, Negeri Sembilan is still in progress. The project comprises of 2 units of 700 MW each, where the first unit is scheduled to be completed and commissioned by 1st January 2009 and the second unit by 1st July 2009. The power from this generating station is expected to enhance the supply capacity in the central area of Peninsular Malaysia.
Besides the IPP’s generation projects above, several new or rehabilitation projects by TNB at the existing power stations are carried out such as :
I. The second phase rehabilitation project at Tuanku Jaafar Power Station with a capacity of 750 MW. The project was at 90% progress stage and scheduled to be completed by December 2008;
II. The life extension and rehabilitation project at Cameron Highlands and Batang Padang Hydroelectric Stations i.e. the stations of Jor (100 MW), Woh (150 MW), Odak (4.2 MW) and Habu (5.5 MW) with the total capacity was 259.7 MW.
The progress of the project was 90% and scheduled to be completed by December 2008.
Meanwhile, in Sabah the forecasted growth of electricity demand for the next five years is at an average of 8.16%. The maximum demand is expected to increase from 710 MW in year 2008 to 971 MW in year 2012. In line with the forecasted growth, the electricity energy demand is expected increase from 3,205 GWh in year 2008 to 4,411 GWh in year 2012.
In Sabah, the east west interconnection grid was completed and commissioned on 28th July 2007. This project has enable the surplus electricity supply from West Coast of Sabah to be transmitted to the East Coast of Sabah to alleviate to a certain extent
2008 2009 2010 2011 2012
Maximum Demand (MW) 14,281 14,940 15,602 16,259 16,927
% Growth 4.8 4.6 4.4 4.2 4.2
Energy Demand (GWh) 95,106 99,516 103,911 108,295 112,740
% Growth 4.8 4.6 4.4 4.2 4.1
2008 2009 2010 2011 2012
Maximum Demand (MW) 710 767 830 898 971
% Growth 8.23 8.03 8.21 8.19 8.13
Energy Demand (GWh) 3,205 3,467 3,755 4,071 4,411
% Growth 8.13 8.17 8.31 8.42 8.35
Electricity Demand Forecast in Peninsular Malaysia
Electricity Demand Forecast in Sabah
Source : Tenaga Nasional Berhad
Source : Sabah Electricity Sdn. Bhd.
the inadequacy of generation capacity in the East Coast. Nevertheless, the power flow from the West Coast to the East Coast is still limited to a certain capacity due to constraint in the system. The new proposed coal-fired power plant in the East Coast is expected to overcome the constraint and provide for a more secure overall system.
Basing on the forecasted electricity demand into the next five years, the issues of fuel resources, supply security and escalating fuel costs will be major challenges to the industry. In Peninsular Malaysia, almost 70% of the electricity generation are from natural gas supplied by the Petronas. The implementation of Bakun hydroelectric project is expected to increase the hydro contribution to the generation mix. The use of coal for power generation has also increased significantly with most coal supply imported from the country such as Indonesia, Australia and South Africa. Nevertheless, supply of coal and increasing cost will be major issues into the future.
In year 2007, a wide area supply interruption had occured on 20th November 2007, interrupting the electricity supply to about 80% of the area in Pulau Pinang and South of Kedah, causing a load loss of about 430 MW. The interruptions was restored by TNB in stages and lasted for about 10 minutes to half an hour.
The incident was triggered by the tripping of a bus coupler in Juru Main Intake Substation, which subsequently caused a cascading trippings of four other Main Intake Substations, namely Farlim, Sungai Pinang, Bayan Lepas and Air Terjun.
In line with the aspiration of Government to increase efficiency in industry, several early initiatives are implemented by the Energy Commisssion to assess the efficieny level of operation
of the IPPs and the utility. Several factors of performance for generation, transmission, distribution and productivity are monitored and reported quarterly. For generaton, two aspects of performance assessed are thermal efficiency and unplanned outage rate, whereas for transmission system, the performance measure is on the aspect of system reliability. For distribution system, the reliability of system such as the number and duration of interruptions are the aspect of performance which are monitored, assessed and benchmarked from the time to time.
The reliability of electricity supply is still a main concern. The performance level of electricity supply in Malaysia in year 2007 declined with the number and duration of interruptions increasing from the previous year. Efforts and steps need to be taken by the TNB and Sarawak Energy Berhad to reduce the number and duration of interruptions. Analysis on the causes of interruptions indicated that more emphasize should be accorded to planning of maintenance programmes and management of asset by the utilities in Malaysia. In addition, power quality incidents such as voltage dip still requires continuous monitoring as well as coordinated effort from the utilities and the industrial consumers.
COUNTRY PROFILE
Area 329,733 sq.km
Climate - Tropical Type
- Average temperature between 20° C to 32° C - Average rainfall of about 3540 mm per annum Population 27.2
pmillion with a multi racial
community comprising Malays, Chinese, Indians, Kadazans, Bajaus, Muruts, Kelabits, Dayaks, Ibans and others Labour Force 11.8 million
pReal GDP RM504.4 billion
p(+6.3%
p) Per Capita Income RM 23,103
pReal GNI RM 486.7 billion
p(+7.3%
p) Nominal GNI RM 627.8 billion
p(+13.1%
p) Current Account Balance 99.3 billion
p(+15.8%
pof GNI)*
Foreign Reserves RM 335.7 billion
p(8.4 months of retained imports)*
Gross National Savings 37.8
p(as % of GNI)*
Total Electricity Generation 108,539 GWh Total Electricity Consumption 97,113 GWh Per Capita Electricity 3,570 kWh Consumption
Average Price of Electricity:
The restructuring of the electricity tariff on 1st June 2006 stipulated for the need to prepare a Client Charter for TNB which shall prescribe the levels of minimum services and supply guaranteed. The Energy Commission formulated the Standard for Supply Services of TNB, taking into account services which are constantly causing greviances to consumers. The proposed standards set the minimum services (MSL) levels and the guaranteed service levels (GSLs), where only GSLs are attached with penalty for non-compliance. However, as of end of 2007, the approval for the implementation of the standard is still pending.
The data and information contain in this report are extracted from the monthly and yearly reports submitted by the licensee, namely Tenaga Nasional Berhad (TNB), Sabah Electricity Sdn. Bhd. (SESB), and mini-utility Nur Distribution Sdn. Bhd.
Whereas the information on the performance and statistics of utility in the state of Sarawak are submitted on request, by Sarawak Energy Berhad. In addition, information and data are compiled based on reports received from the grid system operator, independent generators, public complaints etc.
Prepared by :
Electricity Supply Regulatory Department Energy Commission
MAP OF MALAYSIA PERFORMANCE HIGHLIGHTS
Electricity Supply and Demand Sales of Electricity
Performance of Generation System Performance of Transmission System Performance of Distribution System Causes of Electricity Supply Interruptions Voltage Quality
Quality of Service
Average Selling Prices of Electricity
ELECTRICITY SUPPLY AND DEMAND
INSTALLED GENERATION CAPACITY AND MAXIMUM DEMAND
The installed generation capacity in Peninsular Malaysia increased by 7.6% from 18,323 MW in the year 2006 to 19,723 MW. The additional generation capacities of 1,400 MW, were due to the commissioning of Unit 2 and Unit 3 coal-fired plant of (2X700 MW) at Tanjung Bin Power Station in Johor in February 2007 and August 2007 respectively. The maximum demand also increased by 4.8% from 12,990 MW in the year 2006 to 13,620 MW recorded on 8 August 2007.
For year 2007, there was no new additional capacity reported in Sarawak. However, the maximum demand increased to 834 MW, that is a 7.9% from 773 MW in 2006.
Notes :
Installed capacity of IPPs including of Janamanjung Power Station and Kapar Energy Ventures Sdn.
Bhd. (KEV)
* - 1) Addition of one block of combined cycle unit of 715 MW at Tuanku Jaafar Power Station, Port Dickson in June 2005.
2) Retirement of 3 thermal generation units totaling 360 MW in Prai Power Station in July 2005.
** -Commissioning of Unit 1 coal generation plant of 700 MW at Tanjung Bin Power Station, Johor in September 2006.
#- Commissioning of Unit 2 and Unit 3 coal generation plant of 700 MW each at Tanjung Bin Power Station, Johor in February and August 2007.
Source : Tenaga Nasional Berhad
Notes :
* -Retirement of several SESB diesel generation stations (isolated and grid connected) in Sabah in early year 2005.
** -Commissioning of First Phase of open cycle (66 MW) at Sepangar Bay, Sabah by Sepanggar Bay Power Corporation Sdn. Bhd. in November 2006.
Figure 1 : Installed Generation Capacity and Maximum Demands in
Peninsular Malaysia in the Year 2007 Figure 3: Installed Generation Capacity and Maximum Demands in
Sarawak in the Year 2007
Grid System in Peninsular Malaysia - TNB Grid System in Sarawak – SARAWAK ENERGY BERHAD
Figure 2 : Installed Generation Capacity and Maximum Demands in Sabah in the Year 2007
Grid System in Sabah – SESB
Figure 4 : Monthly Maximum Demands in Kulim Hi-Tech Park (KHTP) Reported by NUR Distribution Sdn. Bhd.
Distribution System of Nur Distribution Sdn. Bhd.
Notes :
* - Additional of 102 MW coal-fired thermal plant at Sejingkat Power Corporation (SPC) Power Station, Kuching
** - Additional capacity of coal-fired thermal plant at PPLS Power Generation Power Station.
In 2007, the sales of electricity of TNB increased by 5.7% to 81,360 GWh from 77,008 GWh sold in 2006. The industrial sector was the major consumer of electricity with consumption of 47.9% or 39,046 GWh from the total electricity energy sold in 2007.
This was followed by sales in the commercial and domestic sector at 31.76% and 18.87% respectively.
In 2007, Sarawak Energy Berhad recorded a total sales of electricity of 4,272 GWh, which was a 5.6% increment from 4,045 GWh sold in 2006. The industrial sector recorded the highest percentage of energy sold with 39.6% from the total energy sold in 2007.
In 2007, the recorded sales of electricity of SESB in Sabah increased by 11.6% to 3,312 GWh from 2,968 GWh sold in 2006. The commercial sector was still the major user which consumed 37.4% of the total electricity, followed by the domestic sector at 31.26%.
The sales of electricity of NUR Distribution Sdn. Bhd. was 618 GWh, that is a 11.4% increment from 555 GWh sold in 2006. The industrial sector was the major consumer of electricity with consumption of 591 GWh or 95.7% from the total electricity sold in 2007.
Notes :
Total energy sales of TNB from year 2003 to 2007 :
64,292 GWh (Year 2003)
68,974 GWh (Year 2004) 73,102 GWh (Year 2005) 77,008 GWh (Year 2006)
Notes :
Total energy sales of SESB from year 2003 to 2006 :
2,333 GWh (Year 2003)
2,556 GWh (Year 2004) 2,770 GWh (Year 2005) 2,968 GWh (Year 2006)
Figure 5 : Sales of Electricity (GWh) by TNB in 2007 Figure 7 : Sales of Electricity (GWh) by Sarawak Energy Berhad
in 2007
Figure 6 : Sales of Electricity (GWh) by SESB in 2007 Figure 8 : Sales of Electricity (GWh) of NUR Distribution Sdn. Bhd.
in 2007
Notes :
Total energy sales of Sarawak Energy Berhad from year 2003 to 2006 : 3,471 GWh (Year 2003)
3,679 GWh (Year 2004) 3,942 GWh (Year 2005) 4,045 GWh (Year 2006)
Notes :
Total energy sales of NUR from year 2003 to 2006 :
395 GWh (Year 2003)
408 GWh (Year 2004) 427 GWh (Year 2005) 555 GWh (Year 2006)
SALES OF ELECTRICITY OF
TNB, SESB, SARAWAK ENERGY BERHAD AND NUR
PERFORMANCE OF GENERATION SYSTEM
The thermal efficiency of generating plants are affected by the various factors such as thermal combustion or generation technology, operating and site conditions, type and quality of fuel, degradation and etc. As such, it is not possible to set a fixed targets for thermal efficiency and the reported figures is based on the average value. For IPP’s generation plants, the targets of performance are assessed based on the contracted efficiency level as stipulated in their respective power purchase agreements.
In the year 2007, the average thermal efficiency for IPP’s generating plants was 28.7% for open cycle and 45.2% for combined cycle plants. The average thermal efficiency for TNB gas-based plants stood around 25.8% for the oldest open cycle plant and 48.6% for the new combined cycle plant. For TNB thermal plants, the average thermal efficiency stood around 30.1% for oil- based generating plants and 33.7% for coal-based generating plants.
Most IPP’s and TNB’s generating plants achieved higher efficiency than the contracted and target efficiency.
The average Equivalent Availability Factor (EAF) for the IPP’s generating plants in 2007 was 87.0% for combined cycle plants and 99.2% for open cycle. For TNB thermal plants, the average EAF was 88.8% for coal-fired generating plants and 99.2% for oil-based generating plants.
Meanwhile, the average Unplanned Outage Rate (UOR) for TNB’s generating plants had improved compared with UOR in 2006. In 2007, for TNB’s generating plants, the UOR were 2.7% (combined cycle plants), 1.0%
(open cycle plants), 3.1% (coal plants) and 0.2% (oil plants).
Overall performance of TNB’s generating plants in 2007 were better than the targeted UOR of 4% for open cycle and combined
Notes :
Effective from July 2004, Kapar Energy Ventures (KEV) had assumed ownership and the operation and maintenance of Sultan Salahuddin Abdul Aziz Shah Power Station at Kapar, Klang from TNB.
* In this report, TNB Janamanjung and KEV are classified as IPPs.
Note :
TNB Janamanjung and KEV are classified as IPPs.
Figure 9 : Average Thermal Efficiency of IPP’s and TNB’s Plants for
Year 2006 and 2007 Figure 10 : Equivalent Availability Factor of IPP’s and TNB’s Plants for
Year 2006 and 2007
Figure 11 : Equivalent Unplanned Outage Factor of TNB’s Plants Performance of Generation System - TNB
Overall, the average UOR for IPP’s generating plants in 2007 were better than the targeted UOR of 4% for combined cycle and open cycle plants.
In 2007, the average UOR for IPP’s generating plants was 3.35% for combined cycle plants and 0.69% for open cycle plants
The total number of trippings in the transmission network in Peninsular Malaysia with a load loss of above 50 MW in 2007 increased by 42.9% from 7 incidents in 2006 to 10 incidents. From the total incidents, the number of major trippings also increased to 9 incidents compared to 6 incidents in the previous year. However, there was no increase in load shedding incident reported in the year 2007.
The total unsupplied energy also increased to 1,246.8 MWh from 215.4 MWh in 2006, due to the wide area tripping incident on 20 November 2007 in Seberang Prai that affected the supply to area of Pulau Pinang and South of Kedah.
In 2007, the average Unplanned Outage Rate of IPP’s generating plants was 7.2%
whereas for SESB’s generating plants was 14.3%.
Overall, most IPP’s and SESB’s diesel generating plants in Sabah recorded high outage rates. The high outage rates were due to several factors such as ageing, maintenance regime, operating conditions and etc, and contributed to lower reliability of the whole supply system in Sabah.
Figure 12 : Unplanned Outage Rate (UOR) of IPP’s Plants for Year
2004 to 2007 Table 1 : Transmission System Trippings with a Load Loss of 50 MW
and above for Year 2005 to 2007 in Peninsular Malaysia
Table 2 : Monthly Transmission System Trippings with a Load Loss of 50 MW and Above for Year 2007 in Peninsular Malaysia
Figure 13 : Unplanned Outage Rate (UOR) for Sabah in 2007 PERFORMANCE OF GENERATION SYSTEM - SESB
PERFORMANCE OF TRANSMISSION SYSTEM
Indicators 2005 2006 2007
No. of Tripping without Load Shedding
11 6 9
Unsupplied Energy due to Tripping (MWh)
20,122.7* 215.4 1,246.8**
No. of Tripping with Load Shedding
2 1 1
Unsupplied Energy during Load Shedding (MWh)
19,347.6* 179.1 103.5
Indicators Jan Feb Mar Apr May Jun Jul Aug Sept Oct Nov Dec
No. of Tripping without Load Shedding
1 0 1 1 1 0 0 1 1 1 1 1
Unsupplied Energy due to Tripping (MWh)
263.4 0 192.4 71.7 87.8 0 0 71.73 233.8 5 183.1 138
Average Unsupplied Energy per Trip (MWh)
263.4 0 192.4 71.7 87.8 0 0 71.73 233.8 5 183.1 138
Average Duration per Trip (Hour)
1:28 0:26 3:00 0:43 1:21 0 0 0:56 1:45 0:05 0:26 1:55
No. of Tripping with Load Shedding
0 1 0 0 0 0 0 0 0 0 0 0
Unsupplied Energy during Load Shedding (MWh)
0 103.5 0 0 0 0 0 0 0 0 0 0
Note : * Including tripping incident on 13th January 2005
** Including tripping incident on 20 November 2007 in Pulau Pinang
Transmission System of TNB
Figure 14 : Number of Transmission System Tripping with a Load Loss of 50 MW and Above for Year 2003 to 2007 in Peninsular Malaysia
Figure 16 : System Average Restoration Index (SARI)
In the year 2007, the delivery point unreliability index (DePUI) or system minutes of TNB’s increased slightly to 9.3 minutes from 7.3 minutes in 2006 and exceeded the yearly threshold of 9 minutes for 2007.
In the year 2007, the number of line and cable trippings in the 132 kV network is the highest at 142 incidents compared to 94 incidents in 275 kV network and 2 incidents in the 500 kV network.
In the year 2007, the average duration in minutes taken to restore any occurrence
Figure 17 : No. of Combined Line and Cable Trippings Per 100 cct-km
Profile for Year 2007
Line Voltage Total Length
(cct-km) Total Tripping Tripping per 100 cct-km
132 kV 10,214 142 1.14
275 kV 7,103 94 0.89
500 kV 609 2 0.16
Total 17,926 238 -
Source : Tenaga Nasional Berhad
Transmission System of SESB
Table 3 : Transmission System Trippings of West Coast Grid in Sabah with a Load Loss of 50 MW and Above in the Year 2007 (Up to 27th July 2007)
Indicators Sept Oct Nov Dec Jan Feb Mar Apr May Jun Jul Aug
No. of Tripping without Load
Shedding 1 0 2 0 0 0 0 0 0 0 0 0
Unsupplied Energy due to Tripping (MWh)
5349 5394
Average Unsupplied Energy
per Trip (MWh) 5349 2697
Average Duration per Trip (Hour)
2:54 1:14
Figure 15 : System Minutes TNB
Source : Tenaga Nasional Berhad
Delivery Point Unreliability Index (DePUI) – System Minutes
Source : Sabah Electricity Sdn. Bhd.
Source : Sabah Electricity Sdn. Bhd.
Table 4 : Transmission System Trippings of East Coast Grid in Sabah with a Load Loss of 50 MW and Above in the Year 2007 (Up to 27th July 2007)
Table 5 : Transmission System Trippings of Sabah Grid with a Load Loss of 50 MW and Above in the Year 2007 (From 28th July – 31st Aug 2007)
Indicators Sept Oct Nov Dec Jan Feb Mar Apr May Jun Jul Aug
No. of Tripping without Load
Shedding 2 1 3 1 0 0 2 0 3 3 0 0
Unsupplied Energy due to Tripping (MWh)
451.84 267.52 454.77 90.51 237.99 334.63 206.42
Average Unsupplied Energy
per Trip (MWh) 225.92 267.52 151.59 90.51 118.99 111.54 68.81
Average Duration per Trip (Hour)
4:52 4:20 2:23 1:54 2:21 2:16 5:55
No. of Tripping with Load Shedding
0 0 0 0 0 0 0 0 0 0 0 0
Unsupplied Energy during Load Shedding (MWh)
Indicators Sept Oct Nov Dec Jan Feb Mar Apr May Jun Jul Aug
No. of Tripping without Load Shedding
0 0 0 0 0 0 0 0 0 0 1 1
Unsupplied Energy due to Tripping (MWh)
14.76 3.76
Average Unsupplied Energy per Trip (MWh)
14.76 3.76
Average Duration per Trip (Hour)
2:27 1:11
No. of Tripping with Load Shedding
0 0 0 0 0 0 0 0 0 0 0 0
Unsupplied Energy during Load Shedding (MWh)
Meanwhile the number of transmission trippings in the East Coast Grid with a load loss of above 50 MW increased to 15 incidents compared with 8 incidents in the year 2006.
However, after the commissioning of the East West interconnection grid in late July 2007, the number of transmission system trippings of Sabah grid in the year 2007 (from 28th July to 31st August 2007) decreased to 2 incidents.
In the year 2007 (up to 27th July 2007), system minutes of West Coast Grid decreased to 21 minutes from 73 minutes in the year 2006. However system minutes of East Coast Grid increased by 38.3% to 68.6 minutes from 49.6 minutes in the year 2006. This indicated a lower reliability in the East Coast of Sabah in the overall system.
The commissioning of the East West interconnection grid in Sabah in late July 2007 showed a slight improvement in the overall system minutes of the Sabah grid.
Figure 18 : System Minutes SESB
Delivery Point Unreliability Index (DePUI) – West Coast Grid
Delivery Point Unreliability Index (DePUI) – East Coast Grid
Delivery Point Unreliability Index (DePUI) – Sabah Grid
Note :
# - West coast interconnection grid commissioning on 28th July 2007
Delivery Point Unreliability Index-DePUI
= Total unsupplied energy (MW-min)
System peak load (MW) Source : Sabah Electricity Sdn. Bhd.
In the year 2007 (up to 27th July 2007), SARI of West Coast Grid in Sabah decreased by 10.1% from 89 minutes in the year 2006 to 80 minutes. The SARI of East Coast Grid also decreased significantly from 1,889 minutes in the year 2006 to 213 minutes.
With the commissioning of East West interconnection grid in Sabah in late July 2007, SARI of the grid system in Sabah for year 2007 (from 28th July to 31st August 2007) decreased to 28.5 minutes.
In the year 2007 (up to 27th July 2007) the number of line and cable trippings for every 100 cct-km in the West Coast Grid with a load loss decreased significantly in the 66 kV network. However, the trippings in the 132 kV network increased slightly compared to the previous year. Meanwhile, for the East Coast Grid, the number of trippings for every 100 cct-km on 132 kV network also increased to 1.06 from 0.46 in the year 2006.
Figure 20 : No. of Combined Line and Cable Tripping per 100 cct-km
(With load loss) for West Coast Grid, East Coast Grid and Sabah Grid Figure 19 : System Average Restoration Index (SARI)
West Coast Grid
West Coast Grid
East Coast Grid
East Coast Grid
Sabah Grid
Sabah Grid
Transmission System of Sarawak Energy Berhad
Table 6 : Monthly Transmision System of Sarawak Energy Berhad in Sarawak for Year 2007
Indicators Jan Feb Mar Apr May Jun Jul Aug Sept Oct Nov Dec
No. of Tripping without Load
Shedding 0 0 1 0 0 0 0 0 0 0 0 0
Unsupplied Energy due to Tripping (MWh)
10
Average Unsupplied Energy
per Trip (MWh) 10
Average Duration per Trip (Hour)
8
No. of Tripping with Load Shedding
0 0 0 0 0 0 0 0 0 0 0 0
Unsupplied Energy during Load Shedding (MWh)
0
In Sarawak, the number of transmission trippings in Sarawak Energy Berhad’s system decreased significantly from 15 incidents in 2006 to only 1 incident in 2007.
Starting from the month of September 2007, TNB has embarked on new monitoring and reporting system on the performance of supply system using new software namely TOMS (Total Outage Managemant System).
With the changes, the number of electricity supply interruptions per 1,000 customers reported in the supply system of TNB for the year 2007 increased by 30.3% to 11.3 interruptions compared to 8.67 interruptions in year 2006.
The numbers reported also include the interruptions of supply to a single customer that experienced interruptions for more than 1 minute. Unscheduled interruptions recorded 96.9% of the total number in 2007 compared with scheduled interruptions at 3.1%.
Figure 21 : Number of Electricity Interruptions per 1,000 Customers of TNB for Year 2003 to 2007
Statistics of Supply Interruptions of TNB
PERFORMANCE OF DISTRIBUTION SYSTEM
Notes :
a) Numbers of Customers :
5.8 Million (Year 2003) 6.0 Million (Year 2004)
6.23 Million (Year 2005)
6.53 Million (Year 2006) 6.76 Million (Year 2007)
b) From 1 September 2004, the reported figures of supply interruption include supply interruption to a single customer for more than 1 minute which was omitted in the past statistics.
c) From September 2007, application of new monitoring and reporting system on performance of supply system using the new software, i.e. Total Outage Management System (TOMS) by TNB.
Unscheduled Interruptions of TNB
Scheduled Interruptions of TNB
Total Interruptions of TNB
The monthly average number of supply interruptions in Peninsular Malaysia in 2007 increased significantly to 6,367 from 4,718 in 2006. The highest number of interruptions was recorded in the month of September with a total of 10,249 interruptions.
Selangor and WP Kuala Lumpur, which have bigger size networks compared to other states recorded the highest number of supply interruptions at 16,313 and 11,097 respectively. However, in term of interruptions per 1,000 customers, the state of Kelantan still recorded the highest number at 21.3 interruptions per 1,000 customers.
Further analysis showed that interruptions in the high voltage networks accounted for only 0.04% to the total interruptions.
Most interruptions were in the low voltage networks which accounted almost 86% of the total interruptions.
Figure 22 : Monthly Supply Interruptions of TNB in 2007
Figures 23 : Number of interruptions and SAIDI based on supply networks voltages
Table 7 : Total Number of Supply Interruptions and Number of Interruptions per 1000 Customers in Various States in Peninsular Malaysia for Year 2005 to 2007
State Total No. of Interruption No. of Interruption per 1000 Customers
2005 2006 2007 2005 2006 2007
Perlis 283 329 773 4.50 3.85 11.79
Kedah 9,382 3,181 3,695 18.45 4.90 6.89
P.Pinang 1,893 1,317 9,872 3.49 1.69 19.16
Perak 8,688 5,695 5,157 12.64 6.15 7.14
Selangor 10,188 9,735 16,313 8.02 4.87 11.76
WP Kuala Lumpur
7,725 6,766 11,097 8.84 5.62 11.86
WP Putrajaya 18 32 30 1.29 0.93 1.53
N.Sembilan 5,949 4,252 4,406 14.65 9.48 12.68
Interruptions
SAIDI
Total Interruptions of SESB Scheduled Interruptions of SESB
The number of electricity supply interruptions per 1,000 customers of SESB’s system in Sabah in 2007 decreased by 12.5% to 61.48 interruptions from 70.30 interruptions in 2006. The unscheduled interruptions recorded the highest percentage at 84.8% as compared to scheduled interruptions at 15.2% of the total supply interruptions in 2007.
In Sabah, the monthly average number of supply interruptions decreased to 1,966 from 2,146 in 2006. The highest number of interruptions was recorded in July with 2,350 interruptions.
Figure 24 : Number of Electricity Supply Interruptions per 1,000 Customers of SESB in Sabah for Year 2003 to 2007
Figure 25 : Monthly Supply Interruptions of SESB in Sabah in 2007
Figure 27 : Monthly Average of Supply Interruptions of Sarawak Energy Berhad in 2007
Statistics of Supply Interruptions of SESB
In 2007, the number of electricity supply interruptions per 1,000 customers in Sarawak increased slightly by 3.4% to 17.68 interruptions from 17.10 interruptions in 2006. The unscheduled interruptions still recorded the highest percentage at 82.0%
compared to scheduled interruptions at 18.0% of the total supply interruptions in 2007.
In Sarawak, the monthly average number of supply interruptions increased by 7.0%
from 617 in 2006 to 660.
Figure 26 : Number of Electricity Supply Interruptions per 1,000 Customers of Sarawak Energy Berhad for Year 2003 to 2007
Statistics of Supply Interruptions of Sarawak Energy Berhad
Notes :
Number of Customers : 385,003 (Year 2003) 400,348 (Year 2004) 414,767 (Year 2005) 433,401 (Year 2006) 447,750 (Year 2007) Notes :
a) Number of Customers : 322,830 (Year 2003) 335,800 (Year 2004) 349,757 (Year 2005) 366,380 (Year 2006) 383,716 (Year 2007)
b) Starting from 1 September 2004, SESB implemented changes in monitoring and recording of supply interruption whereby all the complaints of electricity supply interruption will be recorded in the new application, namely LGBNet.
Unscheduled Interruptions of SESB
Unscheduled Interruptions of Sarawak Energy Berhad
Scheduled Interruptions of Sarawak Energy Berhad
Total Interruptions of Sarawak Energy Berhad
Figure 31 : SAIDI (Minutes/Customer/Year) for the Various States in Peninsular for Year 2005 to 2007
The highest SAIDI was recorded in state of Pahang with 108.4 minutes/customer/
year, although it showed an improved performance from the previous year SAIDI of 191.6 minutes/customer/year.
Figure 30 : SAIDI (Minutes/Customer/Year) in Peninsular Malaysia from the Year 2002 to 2007
System Average Interruption Duration Index (SAIDI) DISTRIBUTION SYSTEM OF TNB
Figure 29 : Monthly Supply Interruptions of NUR Distribution Sdn. Bhd. in 2007
In the year 2007, the number of electricity supply interruptions per 1,000 customers in Kulim Hi-Tech Park (KHTP) reported by NUR Distribution Sdn. Bhd. was 51.60 interruptions, i.e. an increase of 19.9% from 43.05 interruptions in 2006. Of the total interruptions in 2007, scheduled interruptions recorded the highest percentage at 61.9% compared to unscheduled interruptions at 38.1%.
In KHTP, the monthly average number of supply interruptions also increased to 9 from 7 in the year 2006. The month of February, August and October recorded the highest number of interruptions at 12 in each of the month.
Statistics of Supply Interruptions of NUR
Notes :
Number of Customers : 1,250 (Year 2003) 1,501 (Year 2004) 1,698 (Year 2005) 1,928 (Year 2006) 2,035 (Year 2007)
The SAIDI of TNB dropped by 27% from 104 minutes/customer/year in 2006 to 76 minutes/customer/year, which was well below the targeted level of 99 minutes/customer/year.
Unscheduled Interruptions of NUR Distribution Sdn. Bhd.
Scheduled Interruptions of NUR Distribution Sdn. Bhd.
Total Interruptions of NUR Distribution Sdn. Bhd.
Figure 28 : Number of Electricity Supply Interruptions per 1,000 Customers in Kulim Hi-Tech Park Reported by NUR Distribution Sdn. Bhd. For Year 2003 to 2007
Figure 34 : SAIFI and Interruptions based on supply networks voltages for Year 2007
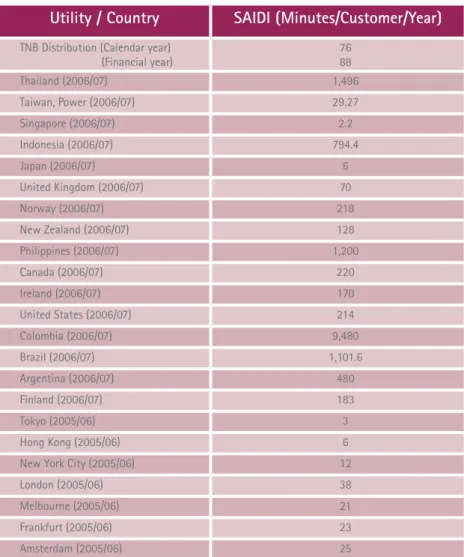
Table 8 : SAIDI of TNB and Several Utilities in Other Countries Utility / Country SAIDI (Minutes/Customer/Year)
TNB Distribution (Calendar year)
(Financial year) 76
88
Thailand (2006/07) 1,496
Taiwan, Power (2006/07) 29.27
Singapore (2006/07) 2.2
Indonesia (2006/07) 794.4
Japan (2006/07) 6
United Kingdom (2006/07) 70
Norway (2006/07) 218
New Zealand (2006/07) 128
Philippines (2006/07) 1,200
Canada (2006/07) 220
Ireland (2006/07) 170
United States (2006/07) 214
Colombia (2006/07) 9,480
Brazil (2006/07) 1,101.6
Argentina (2006/07) 480
Finland (2006/07) 183
Tokyo (2005/06) 3
Hong Kong (2005/06) 6
New York City (2005/06) 12
London (2005/06) 38
Melbourne (2005/06) 21
Frankfurt (2005/06) 23
Amsterdam (2005/06) 25
The SAIDI of TNB had improved over the years and is showing better performance than some international utilities from countries such as Canada, United States, Norway, New Zealand and Ireland. Nevertheless, the SAIDI of each utilities also are dependent on the size and type of networks, maintenance regime, geographical conditions etc.
At the end of December 2007, the SAIFI in Peninsular Malaysia improved to 0.83 from 1.17 in 2006.
SAIFI represents the average number or frequency of interruptions experienced by a customer in a year.
Figure 32 : SAIFI (No’s of Interruption/Customer/Year) in Peninsular Malaysia from the Year 2003 to 2007
System Average Interruption Frequency Index (SAIFI)
The highest SAIFI in 2007 was recorded in Pulau Pinang at 1.26.
Again, the highest SAIFI was recorded in the low voltage supply networks (87%) compared to the high voltage networks (2.48%).
Figure 33 : SAIFI (No’s of Interruption/Customer/Year) for the Various States in Peninsular Malaysia for Year 2005 to 2007
SAIFI
At the end of December 2007, the CAIDI in Peninsular Malaysia was 91.0 minutes, i.e.
a slight increase compared to 88.8 minutes in 2006.
In 2007, most states in Peninsular Malaysia showed an increase in CAIDI with the exception of Perak, WP Putrajaya/Cyberjaya, Melaka, Pahang and Terengganu. The highest CAIDI was recorded in Pahang at 125.9 minutes. The lower CAIDI indicates a shorter duration of interruption and represents the average time taken by the utility to restore the electricity supply.
The time taken to restore a fault in the high voltage networks consumed the most, which accounted for 40.5% of the total CAIDI.
Figure 35 : CAIDI (Minutes/Interrupted Customer/Year) in Peninsular Malaysia from the Year 2003 to 2007
Figure 37 : CAIDI based on supply networks voltages for Year 2007 Figure 36 : CAIDI (Minutes/Interrupted Customer/Year) for the Various
States in Peninsular Malaysia for Year 2005 to 2007
Customer Average Interruption Duration Index (CAIDI) Interruptions
CAIDI
The SAIFI of SESB for year 2007 was 23.87, i.e. a slight improvement from the previous year of 31.37. The highest SAIFI was recorded in the month of January 2007.
The CAIDI of SESB in Sabah improved by 34.8% from 88.6 minutes in 2006 to 57.8 minutes in 2007. The month of January recorded the highest CAIDI in 2007.
The SAIDI of SEB in Sarawak reduced by 17%
from 365 minutes/customer/year in 2006 to 303 minutes/customer/year in 2007, reflecting a slightly better performance than the previous year.
Figure 38 : Monthly SAIDI (Minutes/Customer/Year) for the State of
Sabah for Year 2005 to 2007 Figure 40 : Monthly CAIDI (Minutes/Interrupted Customer/Year) in Sabah
for Year 2005 to 2007
Figure 39 : Monthly SAIFI (No’s of Interruption/Customer/Year) in Sabah for Year 2005 to 2007
Figure 41 : SAIDI (Minutes/Customer/Year) of Sarawak Energy Berhad in Sarawak for Year 2003 to 2007
System Average Interruption Duration Index (SAIDI) Customer Average Interruption Duration Index (CAIDI)
System Average Interruption Frequency Index (SAIFI)
DISTRIBUTION SYSTEM OF SARAWAK ENERGY BERHAD System Average Interruption Duration Index (SAIDI) DISTRIBUTION SYSTEM OF SESB
In 2007, the SAIDI of SESB dropped by 50.4% from 2,778 minutes/customer/year in 2006 to 1,379 minutes/customer/year.
SAIDI in the month of January was the highest recorded in 2007.
As of December 2007, the overall SAIDI reported in KHTP improved by 61% to 49 minutes/customer/year from 125 minutes/
customer/year in the previous year.
Nevertheless, the industrial SAIDI (for high voltage customer only) increased from 1.091 minutes/customer/year in 2006 to 2.889 minutes/customer/year., due to faults on 11 kV cables in May and November 2007 in KHTP industrial area which affected the supply to large numbers of customers.
In 2007, the highest SAIDI at 28 minutes/
customer/year was recorded in the month of March.
Figure 42 : Total SAIDI (Minutes/Customer/Year) and Industrial SAIDI (for High Voltage Customers Only) in Kulim Hi-Tech Park Reported by NUR Distribution Sdn. Bhd. for Year 2003 to 2007
Figure 43 : Total SAIDI (Minutes/Customer/Year) in KHTP Reported by NUR Distribution Sdn. Bhd. for Year 2005 to 2007 System Average Interruption Duration Index (SAIDI) DISTRIBUTION SYSTEM OF NUR
Note : N/A – Not Available
In 2007, the total unscheduled interruptions increased significantly to 74,058 compared to 55,523 in 2006. Interruptions caused by natural disasters recorded the highest percentages at 50.5% in 2007 compared to others causes.
Over the 4 years average, interruptions due to natural disasters was the highest at 36.9% of the total unscheduled interruptions. However, causes due to fault in the network such as loose contacts, overload and equipment failures accounted for almost 30% of the total interruptions and should be given serious attention by the utilities.
Figure 44 : Causes of Unscheduled Electricity Supply Interruptions in Peninsular Malaysia
Causes of Interruptions - TNB
CAUSES OF ELECTRICITY SUPPLY INTERRUPTIONS
Notes :
Total unscheduled interruptions in Peninsular Malaysia from Year 2004 to 2006 :
Year 2004@ : 52,514
(@Prior to 1st September 2004, the figure did not include single customer experiencing supply interruption for a period of more than 1 minute)
Year 2005 : 71,101 Year 2006 : 55,523
Notes :
* (wind, storm, flood, land slides, etc.)
Year 2007
Year 2004 to 2007
Over the last 4 years, interruptions due to installation fault/damage recorded the highest percentage at 18.4% of the total unscheduled interruptions.
The causes of unscheduled electricity supply interruptions increased by 3.3%
to 6,489 compared to 6,279 in 2006. The interruptions due to transient faults still recorded the highest percentage, i.e. 40.2%
of the total unscheduled interruptions in 2007. This was followed by interruptions due to equipment failures at 24.8%.
The causes of electricity supply interruptions due to overhead line fault recorded the highest percentage, i.e. 70% of the total unscheduled electricity supply interruptions in Peninsular Malaysia in 2007.
In 2007, the total unscheduled interruptions in Sabah decreased to 20,006 from 22,436 in 2006. Almost 24% of the total interruptions were reported due to unknown causes, 19.3% due to installations faults and 13.8%
due to work by third party causing damage to utility’s installations.
Figure 45 : Number of Unscheduled Electricity Supply Interruptions Due to Component of Network
Figure 47 : Causes of Unscheduled Electricity Supply Interruptions in Sarawak Energy Berhad
Figure 46 : Causes of Unscheduled Electricity Supply Interruptions in SESB’s System
Causes of Interruptions – Sarawak Energy Berhad Causes of Interruptions - SESB
Year 2007 Year 2007
Year 2004 to 2007
Notes :
Total unscheduled interruptions in Sabah from Year 2004 to 2006 :
Year 2004 : 13,335 Year 2005 : 19,379 Year 2006 : 22,436
Notes :
Total unscheduled interruptions in Sarawak from Year 2004 to 2006 :
Year 2004 : 3,283 Year 2005 : 3,023 Year 2006 : 6,279
Note : * (wind, storm,flood, land slides, etc.)
Over the last 4 years, it can be seen that interruptions due to transient faults and equipment failures accounted for a combined percentage of 68% of the total interruptions.
Most unscheduled interruptions reported by NUR Distribution Sdn. Bhd. were due to equipment failures, whereas in K.K.I.P the interruptions due to the works by third parties causing damage to the distribution system were the major causes reported in 2007.
Table 9 : Causes of Unscheduled Electricity Supply Interruptions Reported by Electricity Distribution Apart from TNB and SESB for Year 2005 to 2007
Causes of Interruptions – Other Electricity Distributors Year 2004 to 2007
Note : * (wind, storm, flood, land slides, etc.) Note : * (wind, storm, flood, land slides, etc.)
Unscheduled Causes of Interruptions
K.K.I.P Power Sdn.
Bhd. NUR Distribution Sdn. Bhd.
2005 2006 2007 2005 2006 2007 Natural Disasters
(wind, storm, flood, land slides, etc.)
0 0 0 1 1 2
Equipment Failures 5 2 5 11 14 14
Overload 0 0 0 5 4 8
Incorrect Operation / Settings
0 0 0 0 1 1
Inferior Workmanship 0 0 0 19 7 9
Over the last 3 years, the interruptions due to equipment failures and inferior workmanship accounted for almost 61% of the total interruptions.
In 2007, the number of overvoltage incidents increased significantly compared with the previous year, i.e. from 100 incidents in 2006 to 219 incidents. Major causes of overvoltage incidents were loose connections due to poor insulating piercing connector, missing earth copper connection due to theft, fouling trees on the lines etc.
Figure 48 : Causes of Unscheduled Electricity Supply Interruptions of NUR Distribution for Year 2005 to 2007
Figure 49 : Overvoltage Incidents Reported for Year 2003 to 2007 VOLTAGE QUALITY
Incidents of Overvoltage
The number of overvoltage incidents was highest in Pulau Pinang with 79 incidents followed by Perak and Kedah with 59 and 52 incidents respectively.
At the end of December 2007, the number of voltage dips incidents reported at major industrial areas in Peninsular Malaysia was 96 incidents, i.e. a drop of 9.4% from 106 incidents in 2006.
At the end of December 2007, the number of consumers affected by the incidents also dropped by 5.2% to 218 from 230 in 2006.
The number of voltage dip incidents in KHTP reported in 2007 increased slightly to 27 from 25 in 2006.
Figure 50 : Number of Incidents of Overvoltage Reported in Various States in Peninsular Malaysia and Sabah for Year 2005 to 2007
Figure 52 : Number of Customers in the Major Industrial Estates Affected by Voltage Dips for Year 2005 to 2007
Figure 51 : Number of Voltage Dip Incidents Reported in Major Industrial
Estates in Peninsular Malaysia for Year 2005 to 2007 Figure 53 : Number of Voltage Dip Incidents in Kulim Hi Tech Park
(KHTP) from the Year 2005 to 2007
Voltage Dips In TNB’s Supply System Voltage Dips In KHTP Supply System
The number of consumers affected by the voltage dip incidents increased to 75 from 42 in 2006.
The number of voltage dips incidents affecting customers increased to 16 compared to 11 in 2006.
Figure 54 : Number of Customers in KHTP Affected by Voltage Dips from
the Year 2005 to 2007 Figure 56 : Incidents of Voltage Dips Affecting Consumers in KHTP
Figure 55 : Number of Voltage Dips Incidents Affecting Customers and Not Affecting Customers from the Year 2003 to 2007
Annual Performance Report on Customer Services
Over the last 4 years, the number of voltage dip incidents affecting consumers in Kulim Hi-Tech Park and originating from TNB’s transmission system were higher compared with incidents originated from NUR’s distribution system itself. The number of voltage dip incidents originating from NUR’s distribution system decreased from 4 incidents in 2006 to 1 incident in 2007.
QUALITY OF SERVICE
Every year TNB, SESB and NUR are required to submit annual report on the performance of customer services which cover 15 types of services, as stipulated under their licence conditions. In order to meet the customer’s needs and strive for better performance, the standard of performance of electricity supply services of TNB are currently being reviewed.
SESB and NUR submitted annual report on the performance of customer services based on condition 42 (for SESB) and condition 34 (for NUR) using the new standard of performance of customer services are as shown in Appendix II and Appendix III. However, TNB’s report was based on the old standard of performance of customer services which cover 15 types of services as shown in Appendix I.
Figure 57 : Statistics of Complaints of Electricity Supply Services Received in 2007
In 2007, the number of complaints increased significantly from 294 complaints in 2006 to 372 complaints. The number of complaints pertaining to electricity supply services had decreased, but complaints of overvoltage incidents increased significantly from the previous year.
Of the total complaints of electricity supply services received in 2007, the complaints on safety of installations and supply interruptions were the highest at 22% and 21% respectively. This was followed by the complaints regarding public lighting, other matter on supply and customer services.
Table 10 : Number and Type of Complaints Received by the Energy Commission for Year 2004 to 2007
COMPLAINTS RECEIVED BY THE ENERGY COMMISSION
Electricity Supply Services
Issues No. of Complaints Received
2004 2005 2006 2007
Electricity supply interruptions 15 31 33 31
Application and connection of electricity supply
19 21 18 9
Tariff and charges 13 14 37 16
Electricity billing, metering, disconnection and reconnection of supply
10 12 39 16
Safety of installations 18 5 10 33
Rentice of transmission line or damage to TNB installations by third parties
10 16 19 19
Public lighting, other matter on supply and customer services
16 18 34 23
TOTAL 101 117 190 147
Quality of Supply
Overvoltage 94 57 100 219
Power quality (dips, surges etc.) 6 3 4 6
TOTAL 100 60 104 225
Services Supply
No. of Cases Resolved 125 205
No. of Cases not Resolved Yet 22 20
Total Cases 147 225
Figure 58 : Statistics of Complaints of Electricity Supply Services Reported in Various States in Peninsular Malaysia for Year 2005 to 2007
Table 11 : Status of Resolution of Complaints in December 2007
Some of the major complaints resolved in 2007 were :
i. Complaint on TNB for imposing surcharge of 1% on a compound basis on electricity bills;
ii. Dispute regarding back-billing to consumers suspected of using electricity dishonestly;
iii. Incidents of overvoltage resulting in damage to consumers electrical appliances;
iv. Delay on the part of TNB in giving the supply to consumers.
Of the overall complaints, Pulau Pinang recorded the highest number with 27 complaints in 2007.
A total of 330 complaints or 89% of the complaints reported in 2007 were resolved, where 125 complaints were on supply services and 205 complaints were on quality of supply issues. Various actions had been taken and carried out from time to times by the Energy Commission and utilities to resolve the complaints such as site investigations, conducting forum or dialogue, meetings with the relevant parties etc.
AVERAGE SELLING PRICES OF ELECTRICITY
Table 12 : Average Selling Prices of Electricity in Malaysia and Some Countries in Asia in 2007 Average Selling Prices of Utilities
Utility/
Country Domestic
(sen/kWh) Commercial
(sen/kWh) Industrial
(sen/kWh) Public Lighting (sen/kWh)
Agriculture
(sen/kWh) Overall (sen/kWh)
TNB 24.66 30.77 23.79 16.92 29.99 26.09
SESB 22.28 28.83 23.79 29.89 N/A 25.17
Sarawak Energy Berhad 31.19 32.06 23.00 47.08 N/A 28.47
Egat, Thailand 32.44 34.95 29.69 N/A 26.44 31.04
PLN, Indonesia 22.67 28.24 23.23 23.74 N/A 23.44
Meralco, Philippines 64.88 59.89 52.20 N/A N/A 60.19
Kepco, Korea 37.01 38.94 25.26 29.23 N/A 30.91
CLP, Hong Kong N/A N/A N/A N/A N/A 43.57
Taipower, Taiwan 26.42 27.26 18.76 10.83 N/A 21.64
Tepco, Japan 61.14 66.86 66.86 N/A N/A 61.83
With the average increase of 12% in electricity tariff which took effect on 1st June 2006, the average selling prices of TNB in 2007 was 26.1 sen/kWh.
Notes :
1. Average Selling Prices of TNB and SESB are for Financial Year Ended September 2006 to August 2007 2. Average Selling Prices for TEPCO, Japan are for Financial Year Ended April 2006 to March 2007 3. Average Selling Prices for Taipower, Taiwan and Kepco, Korea are from January 2007 to June 2007 4. Average Selling Prices for CLP, Hong Kong are from 3rd Quarter Report January 2007 to September 2007
N/A – Not Available
Source : Tenaga Nasional Berhad
Figure 59 : Comparison of Average Selling Prices of Electricity for Domestic Customers in 2007
Figure 60 : Comparison of Average Selling Prices of Electricity for Commercial Customers in 2007
Figure 61 : Comparison of Average Selling Prices of Electricity for Industrial Customers in 2007
APPENDIX I
REPORT ON THE PERFORMANCE OF CUSTOMER SERVICES OF TNB FOR YEARS 2003 TO 2007
The average selling price of TNB in 2007 did not increase significantly from the previous year. In nominal term, the average selling price of TNB is still the 4th lowest in the region.
Figure 62 : Comparison of Average Selling Prices of Electricity for Street Lighting in 2007
Figure 63 : Comparison of Average Selling Prices of Electricity in 2007
Details Performance
in 2003 Performance
in 2004 Performance
in 2005 Performance
in 2006 Performance in 2007
1. Connection of Electricity Supply A. Change Of Consumers No. of applications
Connection within 2 working days after an appointment for connection (%)
B. New Supply (Low Voltage) i. Individual Applications Under Normal Conditions
No. of applications
Connection within 2 working days after an appointment for connection (%)
ii. Individual Applications Under Abnormal Conditions No. of applications
Connection within 2 weeks after an appointment for connection (%)
iii. Bulk Supply Application And Housing Schemes No. of applications
Connection within 1 month after an appointment for connection (%)
127,648 99%
248,267 99%
8,929 98%
120,936 99%
131,723 97%
247,984 96%
12,174 100%
106,819 100%
175,887 98%
277,347 96%
15,786 95%
156,606 99%
109,159 98%
218,872 97%
4,275 99%
125,466 98%
87,870 99%
210,258 99%
2,585 97%
111,692 100%
2. Supply Restoration After Breakdowns i. Reports
No. of reports
Consumers being given report numbers (%) ii. Minor Breakdowns
No. of minor breakdowns
1,114,240 82%
66,321
1,156,186 84%
84,203
2,616,759 92%
115,226
1,367,415 87%
152,175
985,508 92%
206,533
Details Performance
in 2003
Performance
in 2004 Performance
in 2005 Performance
in 2006 Performance in 2007
3. Supply Reconnection After Disconnection No. of supply disconnections
Bills paid before 1:00 p.m. on disconnection day Supply reconnection on the same day
for bills paid before 1:00 p.m. (%)
983,017 555,666 99%
654,946 355,150 100%
864,208 556,397 98%
807,729 484,600 100%
983,033 572,163 95%
4. Supply Interruptions Which Are Planned / Scheduled No. of scheduled interruptions
Consumers given 24 hours notice (%) Consumers not given notice (%)
6,673 95%
2%
8,831 90%
2%
8,117 86%
6%
14,807 98%
2%
11,273 98%
2%
5. Meter Reading
No. of consumers with estimated readings exceeding 3 consecutive months
Notice given to customers with estimated readings exceeding 3 consecutive months (%)
360,160
97%
355,318
97%
353,369
98%
447,339
99%
599,834
100%
6. Enquiries / Written Complaints From Consumers i. Written enquiries including questions
regarding accounts/bills
No. of written complaints received Reply within 7 working days (%)
5,067 100%
7,009 98%
8,601 99%
9,210 99%
7,140 100%
7. Complaints Through Telephone
No. of complaints through telephone which could not be settled
Consumers recontacted within 24 hours (%)
35,694
99%
29,145
99%
22,555
97%
75,065
100%
53,918
100%
Details Performance
in 2003 Performance
in 2004 Performance
in 2005 Performance
in 2006 Performance in 2007
9. Meter Replacement No. of meters replacement
Meter replacement within 2 weeks (%)
275,353 100%
97,935 98%
122,472 99%
100,763 99%
104,587 98%
10. Appointment With Consumers
i. For Appointments Outside TNB Premises Arrival of TNB officers not more than 30 minutes from agreed time (%) ii. Postponement by TNB
Subsequent appointment made within 2 working days (%)
100%
99%
100%
97%
100%
93%
100%
100%
100%
99%
11. Deposits
No. of consumers found after 6 months that their deposits exceed average consumption of 2 months Consumers who have the excess deposits returned (%)
26,955
100%
28,239
94%
4,635
99%
1,343
100%
2,469
99%
12. Refund of Consumer Deposits No. of consumers who have
forwarded all required documents for refund of deposits
Consumers who have their deposits refunded within 2 months (%)
94,041
98%
87,330
97%
107,362
97%
96,043
98%
185,178
100%
13. Collection
Proof of payment sent to payment via mail within 7 working days (%)
97% 97% 100% 100% 98%
14. Supply Disconnection i. With 24 hours Notice
No. of disconnections due to dangerous consumer installations No. of disconnections due to suspicion
of theft of electricity
No. of disconnections due to electricity meter being damaged
6,077 3,854
317
1,906
1,714 1,103
609
2
32,598 29,455
3,105
38
15,709 1,103
14,089
517
65,520 62,977
79
2,464
Details Performance
in 2003 Performance
in 2004 Performance
in 2005 Performance
in 2006 Performance in 2007
ii. Without Any Notice
No. of disconnections due to failure to pay the bills within 15 days after issuance of bill
No. of disconnections due to failure to pay additional deposits within 7 days from the date of notice.
No. of disconnections of installations which are dangerous.
365,494 353,168
12,323
3
235,338 211,032
22,136
2,170
369,386 317,527
50,998
861
200,003 193,735
5,278
990
114,163 104,572
9,587
4
15. Special Consumers Who Face Problems In Paying Electric Bills No. of handicapped consumers who appealed to avoid disconnection.
No. of senior consumers who appealed to avoid disconnection.
No. of handicapped consumers who were assisted in payment of bills.
No. of senior consumers who were assisted in payment of bills.
448
40
56
164
188
599
65
77
195
262
782
95
227
203
257
522
44
248
126
104
354
19
111
98
126
Source : Tenaga Nasional Berhad
APPENDIX II
REPORT ON THE PERFORMANCE OF CUSTOMER SERVICES OF SESB FOR YEARS 2003 TO 2007
Details Performance
in 2003 Performance
in 2004 Performance
in 2005 Performance
in 2006 Performance in 2007
1. Connection of Electricity Supply A. Change of Consumers No. of applications
Connection within 1 working day after an appointment for connection (%)
B. New Supply (Low Voltage)
i. Individual Applications Under Normal Conditions No. of applications
Connection within 2 working days after an appointment for connection (%) ii. Bulk Supply Application And Housing Schemes No. of applications
Connection within 2 weeks after an appointment for connection (%)
6,401 85.9%
14,166 71.7%
525 80.0%
9,597 92.3%
7,513 60.2%
653 56.5%
7,600 92.0%
16,571 70.0%
5,342 69.9%
11,410 88.5%
17,130 96.3%
6,165 58.2%
13,213 90.3%
10,466 83.0%
5,712 77.6%
2. Supply Restoration After Breakdowns i. Reports
No. of reports
The information could not being given in that times was contacted again within 15 minutes (No. of Consumers) Consumers being given report numbers (%) The consumers where the information could not being given in that times was contacted again within 15 minutes (%) ii. Minor Breakdowns
No. of minor breakdowns
149,172 1,457
100%
0.98%
8,597
157,866 3,126
97.7%
1.98%
11,467
223,354 2,628
95.0%
1.18%
14,919
260,572 3,500
95.9%
1.34%
21,584
247,927 2,060
95.5%
0.83%
20,857
Details Performance
in 2003 Performance
in 2004 Performance
in 2005 Performance
in 2006 Performance in 2007
3. Supply Reconnection After Disconnection No. of supply disconnections
Bills paid before 1:00 p.m. on disconnection day
Supply reconnection on the same day for bills paid before 1:00 p.m. (%)
63,480 30,674
48.3%
52,126 26,793
98.2%
56,746 55,611
98.0%
74,474 70,510
94.7%
77,350 42,681
55.2%
4. Supply Interruptions Which Are Planned / Scheduled
i) Scheduled Interruptions No. of scheduled interruptions
Consumers being given notice within 7 days before interruptions
ii) Planning of Scheduled Interruptions No. of scheduled interruptions planning of yearly and monthly No. of large consumers which was expected affecting
No. of large consumers which was expected affecting informed about the planning of scheduled interruptions (%)
802 100%
67
1,286
100.0%
1,003 72.9%
70
9,393
90.7%
1,659 80.0%
231
30,052
90.0%
2,010 80.0%
154
120,099
82.5%
618 66.4%
320
164,790
100.0%
5. Meter Reading
No. of consumers with estimated readings exceeding 3 consecutive months
Notice given to customers with estimated readings exceeding 3 consecutive months (%)
8,389
25.5%
12,215
47.5%
13,251
49.5%
4,398
1.32%
5,525
50.0%
6. Enquiries / Written Complaints From Consumers
i. Written Enquiries
No. of written enquiries received Reply within 5 working days (%) ii. Enquiries Through Telephone No. of complaints through telephone which could not be settled
176 52.8%
1,246
364 49.7%
1,620
262 51.5%
7,017
228 58.3%
2,291
310 85.5%
1,682
Details Performance
in 2003 Performance
in 2004 Performance
in 2005 Performance