RESEARCH OVERVIEW
Introduction
Research Background ................................................................................ 1-3
- General Objective
- Specific Objective ............................................................................... 5-6
To determine the relationship between expected performance and Malaysian citizens' intention and adoption of a cashless system. To study the relationship between habit and Malaysian citizens' intention and adoption of a cashless system.
Significant of the Study ............................................................................. 7-8
The development of hypothesis and the detailed discussion and explanation of the hypothesis in this research are present in chapter 2 in 2.4 hypothesis development. Teoh et al (2013) said that from a practical perspective, which banking sector or financial institution will also benefit from this study because this research conducts critical information on how Malaysian citizens' behavior or attitudes affect the intention to use and adopt a cashless system.
Conclusion
According to Tee and Ong (2016), a cashless system is a behavioral change in which people exclude the use of physical cash as a medium for exchanging goods or services. The purpose of using both this model is to analyze the factors that influence Malaysia Citizen's intention and adoption of a cashless system.
Review of Literature Review
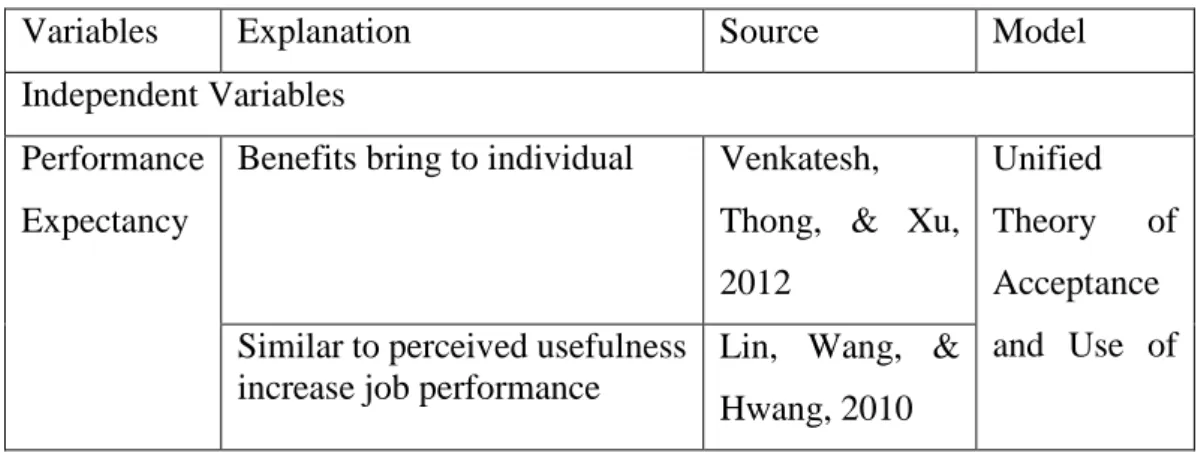
- Independent Variable: Performance Expectancy ............................ 13-15
- Independent Variable: Hedonic Motivation
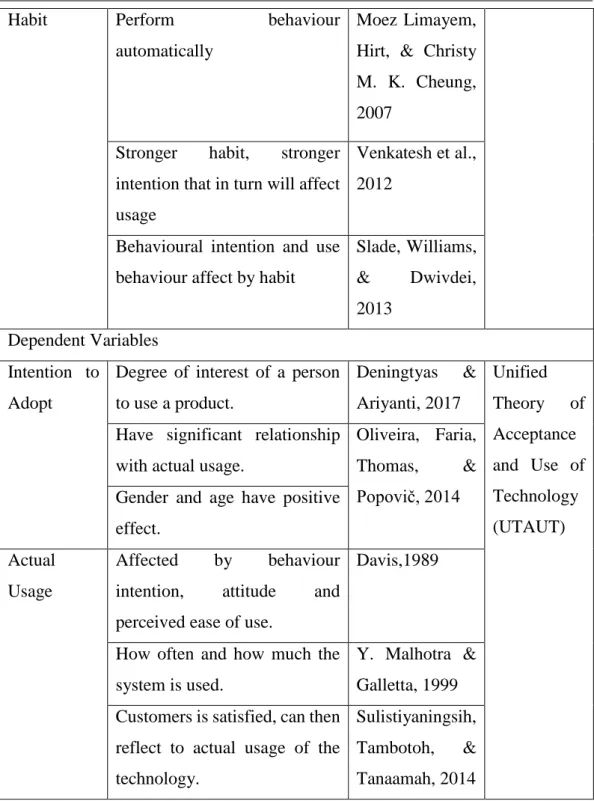
- Independent Variable: Habit
- Dependent Variable: Intention to Adopt ........................................ 19-20
- Summary of Independent and Dependent Variables ...................... 20-22
- Theory of Reasoned Action (TRA)
- Theory of Planned Behaviour (TPB)
- Technology Acceptance Model (TAM)
- The Unified Theory of Acceptance and Use of Technology (UTAUT)
Thus, according to the result of Oliveira et al (2014), the performance expectation will have a positive effect on the behavioral intention to use mobile banking. As claimed by Venkatesh et al. 2003), to explain the user's intention to use an information system (IS) and subsequent usage behavior is the purpose of the UTAUT model.
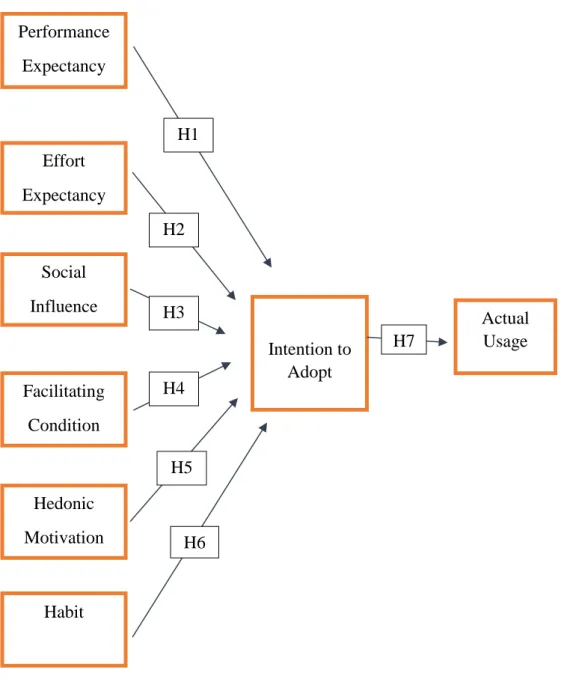
Proposed Theoretical Framework .......................................................... 26-27
There is a positive relationship between performance expectancy and Malaysian citizen's intention to adopt a cashless system. H2: There is a positive relationship between expected effort and Malaysian citizen's intention to adopt cashless system. There is a positive relationship between social influence and Malaysian citizen's intention to adopt a cashless system.
There is a positive relationship between Facilitating Conditions and Malaysian citizen's intention to adopt a cashless system. H5: There is a positive relationship between Hedonic Motivation and intention to adopt cashless system by Malaysian citizen. There is a positive relationship between habit and intention to adopt a cashless system by Malaysian citizen.
H7: There is a positive relationship between actual use and the intention of the Malaysian citizen to use a book-entry system.
Introduction
Research Design
- Secondary Data
Furthermore, in line with Babbie (2010), the purpose of quantitative research is to collect numerical data and information to answer a phenomenon. Quantitative research is therefore used in this research and questionnaire was distributed to 300 target respondents. As stated by Saunders, Lewis and Thornhill (2012), descriptive research is very common to use on research design to collect the information about the current existing conditions through the use of questionnaire, personal interviews and observations.
Descriptive research is chosen for use in this study because researcher can examine a representative sample to understand more about factors influencing Malaysia Citizen's intention and adoption of cashless system. According to Burns and Grove (2001), descriptive research is designed to provide a picture of a situation as it naturally occurs. Descriptive research is an essential research method that examines the situation, and it includes distinguishing the attributes of a particular circumstance based on the basis of observation or the exploration of the relationship between two or more phenomena.
As mentioned in Salaria (2012), descriptive research is used for gathering information about prevailing situations for the purpose of description and interpretation and it includes.
Sampling Design
- Target Population
- Sampling Frame and Sampling Location ........................................ 36-37
- Sampling Technique ....................................................................... 37-38
Non-probability is when all the individuals of the population are not given an equal opportunity to become part of the sample. As asserted by Etikan (2016), convenience sampling is a type of non-probability sampling where members of the target population have easy accessibility or geographic proximity and availability at a given time. One of the elements of research design is sample size that researchers must consider when designing their study.
According to Bn and Rn (2012), the reason to get the right sample size is to accurately calculate the required sample size and to ensure that research resources are used efficiently. In line with Fridah (2002), the sample size depends on the nature of the analysis to be performed and the number of variables to be examined simultaneously. According to Thompson (2004), it is advisable to sample more than 200 respondents to obtain stability in factor analysis. 2010) states that a sample size should be larger than 100 to proceed to factor analysis.
In this research, the sample size is 300 respondents who are required to participate in our questionnaire survey in order to assess the factors that influence Malaysian citizens' intention and adoption of cashless system.
Research Instrument............................................................................... 38-39
- Data Checking
- Data Editing
- Data Coding
- Data Transcribing
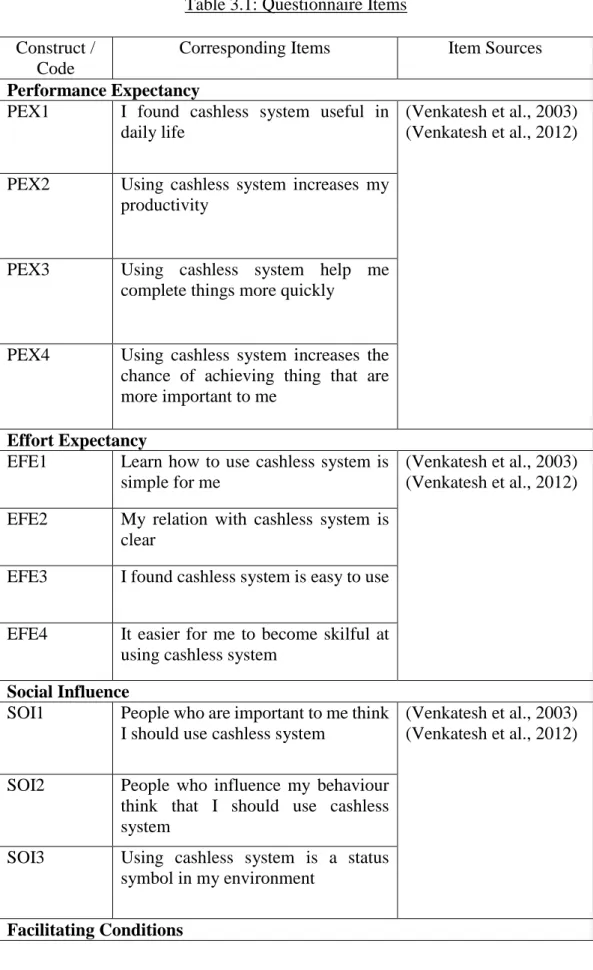
In this research, questionnaires are distributed through electronic communication channels such as WhatsApp, Facebook Messenger and LinkedIn. PEX4 Using the cashless system increases the opportunity to achieve things that are most important to me. EFE3 I found the cashless system easy to use EFE4 It's easier for me to become proficient.
HDM1 Using the cashless system is fun (Venkatesh et al., 2012) HDM2 Using the cashless system is enjoyable. The questionnaires in this study include three parts, which is part A is General Information on the cashless system, part B is the variable to be studied and part C is the demographic profile. A 5-point Likert scale was used in this research study, ranging from "Strongly Disagree" to "Strongly Agree".
In this research study, the data of 300 responses will be downloaded from Google Form and saved as an Excel file.
Data Analysis
- Descriptive Analysis
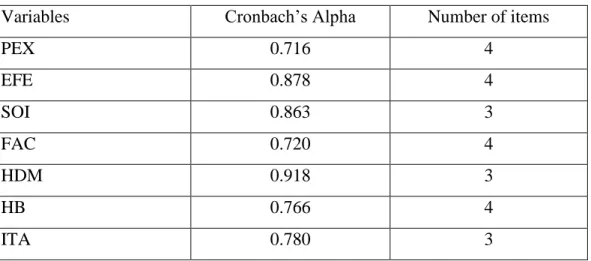
- Reliability Test
- Inferential Analysis
- Multiple Regression Analysis
- Pearson Correlation Coefficient
- Point-Biserial Correlation
As stated in Kern (2013), the goal of inferential analysis is to draw conclusions beyond the observed data. In this research study, SPSS Statistics 23 is applied in this study to perform the analysis using the obtained data. Higgins (2005), multiple regression analysis is used to examine how multiple independent variables are associated with one dependent variable and it was used to measure the correlation between the dependent and independent variables. In accordance with Hair et al. 2003), multiple regression analysis determined by estimating the coefficients for the equation.
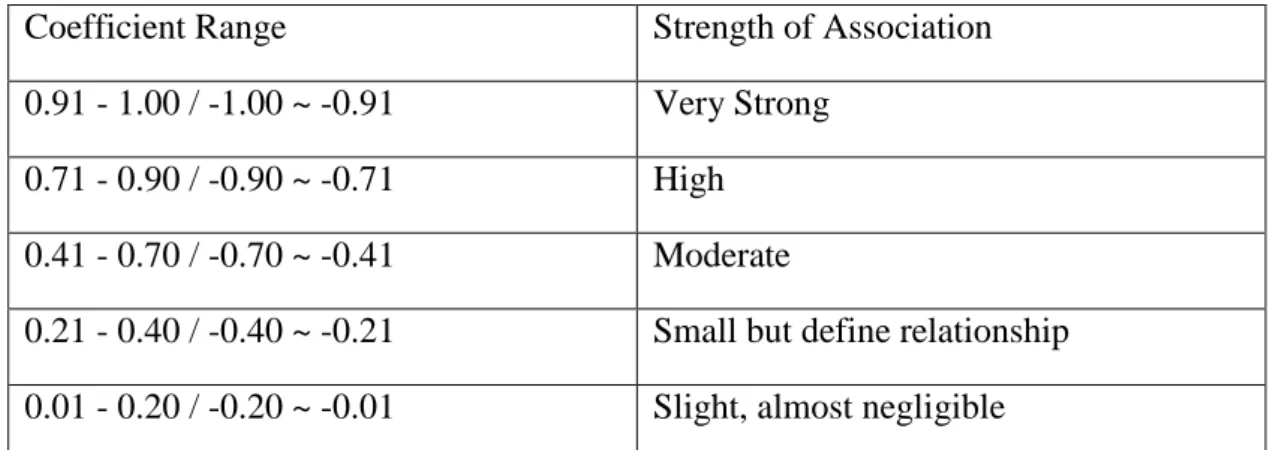
Multiple regression equation allows researchers to come up with an ideal prediction at which independent variables will have more effect on the dependent variable. Pearson correlation coefficient is mainly used to measure the correlation between two variables as claimed by Zikmund (2003). If the value is 0, it means that there is no significant relationship between two variables, while if the values are positive, then there is a positive relationship.
According to Ken (2014), a point biserial correlation will be used to investigate the correlation between a continuous variable and a dichotomous variable.
Conclusion
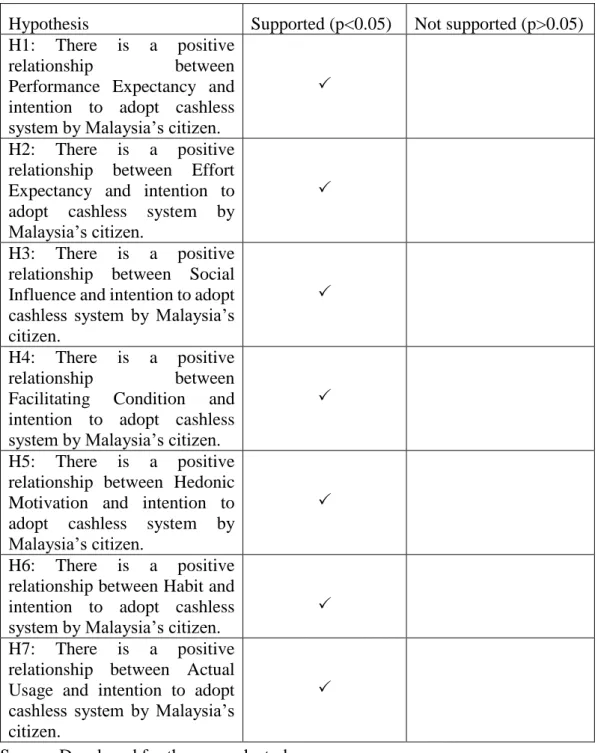
H1: There is a positive relationship between performance expectancy and intention to adopt cashless system by Malaysian citizen. H3: There is a positive relationship between social influence and intention to adopt cashless system by Malaysian citizen. H4: There is a positive relationship between the facilitating condition and the intention to adopt cashless system by Malaysian citizen.
H6: There is a positive relationship between habit and intention to adopt cashless system by Malaysian citizen. So, as the intention to adopt cashless system increases, the actual usage of cashless system will also increase. The P value is 0.000 and it less than 0.05 and therefore it has a positive relationship between performance expectation and intention to adopt cashless system by Malaysian citizen.
The value of the correlation coefficient is 0.220, which is a weak positive relationship between the actual use of the cashless system and the intention to implement the cashless system.
DATA ANALYSIS
Introduction
Descriptive Analysis
- Central Tendencies Measurement of Constructs
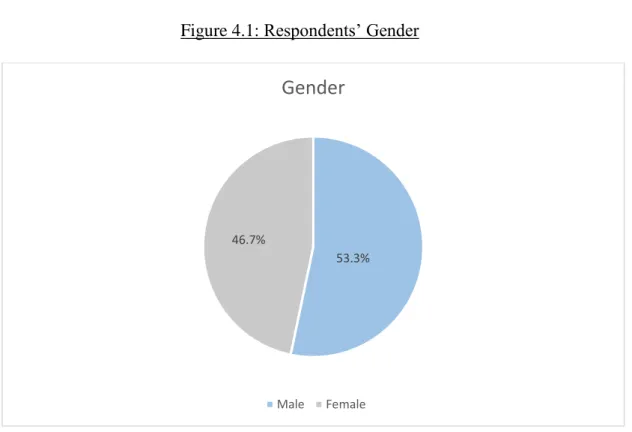
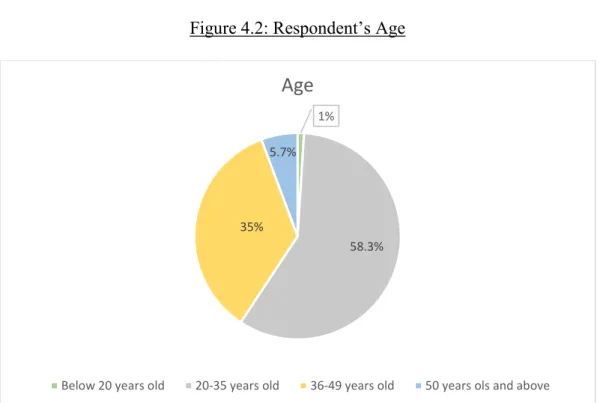
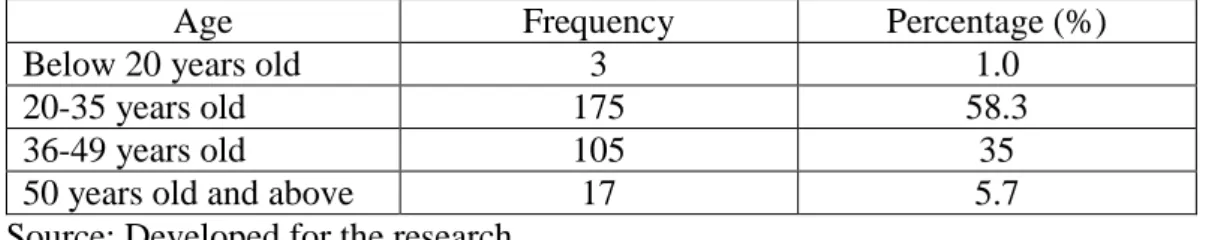
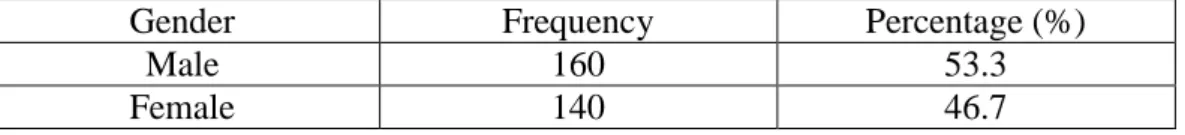
The above data Table 4.1 and Figure 4.1 were collected through questionnaire indicates that the majority of the respondents are male which consists of 53.3%. Also, the largest populations for cultural heritage (Table 4.3 and Figure 4.3) were Chinese, which is 143 respondents out of 300, and the percentage is 47.6. In this study, there are 185 respondents who are permanent employees and their percentage is 61.7 and it is the largest respondents. 20.7 percent of the respondents are represented by 62 people who are students.
The data collected from our respondents (Table 4.5 and Figure 4.5) shows that most of them have a bachelor's degree, namely 182 respondents and 60.7% of the 300 respondents. Finally, those who have a high school qualification and have only 7 respondents and 2.3% of the 300 respondents. Based on table 4.7 and figure 4.7, most respondents came from Selangor with 104 inhabitants, followed by Wilayah Persekutuan with 99 inhabitants.
The third largest number of respondents comes from Negeri Sembilan which has 32 people and 10.7% of 300 respondents and followed by 15 respondents from Pulau Pinang.
Scale Measurement ................................................................................ 58-60
- Multiple Regression Analysis ......................................................... 61-63
The value of the correlation coefficient is 0.220, which is a weak positive correlation between the actual use of a cashless system and the intention to use a cashless system. The P-value is 0.000 and is less than 0.05 and hence it has a positive relationship between the effort expectation and the intention to adopt a cashless system by the Malaysian citizen. Its P-value is 0.000 and is less than 0.05 and hence it has a positive relationship between social influence and the intention to adopt a cashless system by the Malaysian citizen.
The p-value is 0.000 and is less than 0.05, so it has a positive relationship between facilitating condition and Malaysian citizen's intention to adopt cashless system. The p-value is 0.000 and is less than 0.05, so it has a positive relationship between hedonic motivation and Malaysian citizen's intention to adopt cashless system. The p-value is 0.000 and it is less than 0.05, so it has a positive relationship between habit and intention of Malaysian citizen to adopt cashless system.
Its P-value is 0.000 and less than 0.05 and hence it has a positive relationship between the actual usage and the intention to adopt a cashless system by the Malaysian citizen.
DISCUSSION, CONCLUSION AND IMPLICANTIONS
Introduction
In addition, discussions of main findings, summary of statistical analyses, implications of the study, limitations of the study, and recommendations for future research will also be described.
Summary of Statistical Analyses
- Descriptive Analysis ....................................................................... 69-70
- Inferential Analysis
- Multiple Regression Analysis
- Pearson Correlation Coefficient
- Point-Biserial Correlation ............................................................ 71-72
This result is also supported by the results of Alalwan et al. 2017), where the intention to adopt a cashless system may be influenced by expected performance. This result is also supported by previous study conducted by Venkatesh et al. 2003), where there is a strong correlation between performance expectation and intention to adopt a cashless system. Based on the previous study conducted by Cheah, Teo, Ooi, and Wong (2013), it proved that there is a strong positive relationship between social influence and intention to adopt a cashless system.
This result is also supported by Oliveira et al. 2014) which facilitating condition can significantly influence the intention to adopt a cashless system. This result is significant with Susanto et al. 2017) that the intention to use a cashless system can influence the individual's habit. Based on the findings of Alalwan et al., (2017), the intention to adopt was supported as an important factor predicting the actual use of a cashless system.
This result is supported by the results made by Susanto et al. 2017) that there is a positive correlation between the intention to introduce a cashless system and the actual use of it. Our results show that all the variables have an influence on the dependent variable, which is the intention to introduce and use a cashless system. This study examines the factors influencing Malaysian citizens' intention and adoption of a cashless system.