FORMATION KINETIC OF MIXED HYDRATE OF CARBON DIOXIDE AND METHANE IN THE PRESENCE OF PROMOTER
NUR SYAKIRAH BINTI KAMARUZAMAN
CHEMICAL ENGINEERING UNIVERSITI TEKNOLOGI PETRONAS
SEPTEMBER 2012
Formation Kinetic Of Mixed Hydrate Of Carbon Dioxide And Methane In The Presence Of Promoter
by
Nur Syakirah Binti Kamaruzaman
Dissertation submitted in partial fulfilment of The requirements for the
Bachelor of Engineering (Hons) (Chemical Engineering)
SEPTEMBER 2012
Universiti Teknologi PETRONAS Bandar Seri Iskandar
31750 Tronoh Perak Darul Ridzuan
CERTIFICATION OF APPROVAL
Formation Kinetic Of Mixed Hydrate Of Carbon Dioxide And Methane In The Presence Of Promoter
by
Nur Syakirah Binti Kamaruzaman
A project dissertation submitted to the Chemical Engineering Programme Universiti Teknologi PETRONAS in partial fulfilment of the requirements for the
BACHELOR OF ENGINEERING (Hons) CHEMICAL ENGINEERING
Approve by,
_______________
(Mr. Azizul Buang)
UNIVERSITI TEKNOLOGI PETRONAS TRONOH, PERAK
September 2012
CERTIFICATION OF ORIGINALITY
This is to certify that I am responsible for the work submitted in this project, that the original work is my own except as specified in the references and acknowledgements, and that the original work contained herein have not been undertaken or done by unspecified sources or persons.
________________________
NUR SYAKIRAH BINTI KAMARUZAMAN
ABSTRACT
In this study, we will investigate the effect on the application of hydrate promoter which is Sodium Dodecyl Sulfate (SDS) Solution on separation of Carbon Dioxide from Methane gas. Thus, through this paper, we will find out the SDS’s kinetic measurement on hydrate formation which has been said theoretically; SDS Solution is capable to promote hydrate formation at the better condition by shifting the equilibrium phase for pressure and temperature. To prove that the hydrate promoter can promote the hydrate crystal formation at the better temperature and pressure condition, it needs to be done through the experimental work. Comparison of 70%CO2:30%CH4 with and without SDS Solution will be use in the experiment to see the trend of its kinetic measurement. Experiment will be divided into two part which are Part I Experiment; analyse the kinetic measurement data by using 70%CO2:30%CH without introducing the promoter while Part II Experiment;
analyse the kinetic measurement for 70%CO2:30%CH4 by using 0.03 mole%
concentration of SDS Solution. The data will be monitor and collected by using Data of Requisition System. Rapid increasing in pressure and decrease in temperature shows that the hydrate are form in the gas. The calculation to find the rate of constant for hydrate formation will be proceed based on the graph of “Pressure versus Time”.
The result from the sample product that contains SDS Solution will be determining the kinetic measurement of mixed CO2-CH4 gas hydrate.
ACKNOWLEDGEMENT
Alhamdu Lillah, throughout completing my Final Year Project (FYP), there were many people, individuals and parties that involved for these two semesters which has contributed immeasurable and invaluable amount of help, guidance, assistance, advice, supports, and also supervision. Thus, a very high gratitude and appreciation to all of them for the commitments and assistance in helping me to achieve the objectives and complete my final year project successfully. Special thanks to my parents for continuous support and motivation which give me the strength to move forward in completing my project even there are a lot of circumstances that I need to faced. Also thanks to my supervisors; Dr Khalik M Sabil for given me the opportunity to work under his project and guide me throughout the challenged and problem faces and as well as special thanks to Mr Azizul Buang for continuous encouragement and motivation. Besides that, I also would like to express my appreciation and utmost gratitude to:
Associate Professor Dr M Azmi Bustam
Associate Professor Dr. Khashayar Nasrifar
Dr. Nurhayati Mellon
Puan Asna M Zain
Siti Nurmala Abdul Malik
Technician In-Charge
Lab Technologies
Thank you.
Regards,
Nur Syakirah Binti Kamaruzaman
TABLE OF CONTENTS
CERTIFICATION ... iii ABSTRACK ... v ACKNOWLEDGEMENT ... vi CHAPTER 1 : 1.0 INTRODUCTION
1.1 Background...
1.2 Problem Statement...
1.3 Objectives...
1.4 Scope of Study...
1 4 5 5
CHAPTER 2 : 2.0 LITERATURE REVIEW AND THEORY
2.1 Effect of CO2 to the Pipeline and Equipment ...
2.2 Previous Study on Gas Hydrate...
2.3 Hydrate Promoter ...
2.4 Hydrate Mechanism ...
2.5 Induction Time ...
6 8 10 11 12
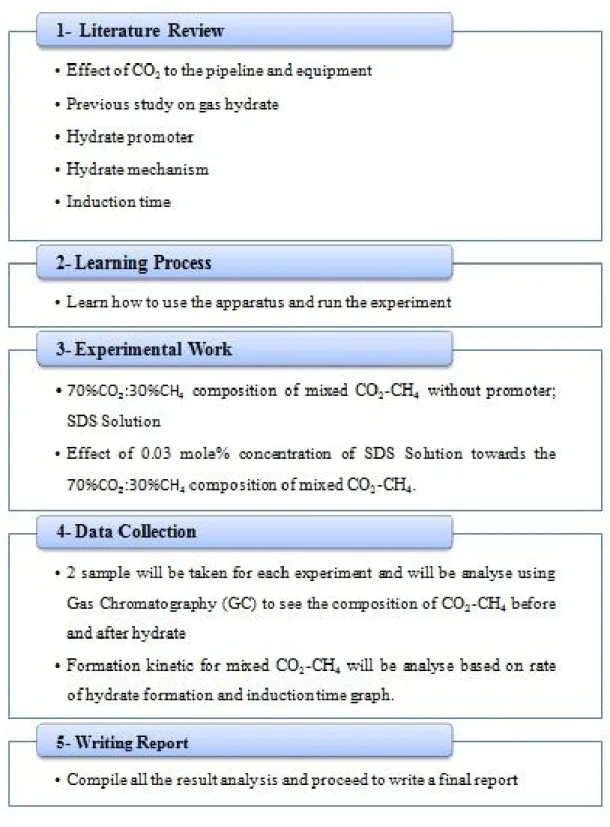
CHAPTER 3 : 3.0 METHODOLOGY
3.1 Project Activities...
3.2 Calculation Involve...
3.3 Experimental Work...
3.4 Key Milestone...
3.5 Gantt Chart...
15 16 17 22 24
CHAPTER 4 : 4.0 RESULT & ANALYSIS
4.1 CSMGem Software Predicted... 25
4.2 Part I Experiment...
4.3 Part II Experiment...
4.4 Comparison With And without Promoter... ...
26 30 33
CHAPTER 5 : 5.0 CONCLUSION AND RECOMMENDATION
5.1 Recommendation...
5.2 Conclusion...
34 34
REFERENCE ... 36
LIST OF TABLES
Table 2.1.1 :Mol % Dry Of Component In Natural Gas... 6
Table 2.1.2 :Failure Rates for Carbon Dioxide Pipelines... 8
Table 3.3.1 :List of Chemical Used... 17
Table 3.3.2 :Maximum Capacity Flow rate of Gas Mixing Equipment... 18
Table 3.3.1.1 :70%CO2:30%CH4 Without Promoter... 19
Table 3.3.2.1 :Concentration of SDS Solution... 21
Table 3.4.1 :Key Milestone... 22
Table 4.2.1.1 :Concentration Of CO2 & CH4 Before And After Hydrate (Without Promoter)... 27
Table 4.3.1.1 :Concentration Of CO2 & CH4 Before And After Hydrate (With Promoter)... 30
Table 4.3.1 :Comparison Of 70%CO2:30%CH4 With And Without Promoter... 33
LIST OF FIGURES
Figure 1.1.1 :Structure of Normal Ice and Gas Hydrate... 2Figure 1.1.2 :Typical Structure of gas hydrate with water molecules linked together to form a cage trapping a gas molecule such as Methane Gas... 2
Figure 1.1.3 :Illustration of the three different gas hydrate cage structure; within each cage one gas molecules can be held... 3
Figure 1.1.4 :Sodium Dodecyl Sulfate (SDS)... 4
Figure 2.1.1 :Percentage of CO2... 6
Figure 2.1.2 :Corrosion rates of carbon steel and 13Cr steel in CO2-saturated water with and without oxygen for 24 hours... 7
Figure 2.1.3 :SEM image and EDS spectra of the corroded surface of sample exposed in CO2-saturated water for 120 hours.
(a)without oxygen, (b)with oxygen... 7
Figure 2.5.1 :Schematic representation of the pressure changes with time during a typical kinetic hydrate formation experiment... 13
Figure 3.1.1 :Project Flow... 15
Figure 3.3.1 :The Equipment used for Part I and Part II Experiment... 18
Figure 4.1.1 :Hydrate Three-Phase (H-LW-V) Equilibria Lines Predicted by CSMGem... 25
Figure 4.2.1.1 :1) Sample collected in the tedlar sampling bag. 2) Gas Chromatography... 26
Figure 4.2.1.2 :Concentration Of CO2 (Without Promoter)... 27
Figure 4.2.1.3 :Concentration Of CH4 (Without Promoter)... 28
Figure 4.2.1.4 :Percentage Of CO2 And CH4 In Mixed CO2-CH4 (Without Promoter)... 28
Figure 4.2.2.1 :Sample A... 29
Figure 4.3.1.1 :Concentration Of CO2 (With Promoter)... 31
Figure 4.3.1.2 :Concentration Of CH4 (With Promoter)... 31
Figure 4.3.1.3 :Percentage Of CO2 And CH4 In Mixed CO2-CH4 (With Promoter)... 31
Figure 4.3.2.1 :Sample B... 32
Figure 5.2.1 :Gas Hydrate Of Mixed CO2-CH4... 35
CHAPTER 1 INTRODUCTION
1.1 Background
The natural gas which used by the consumers are mostly compose of methane gas.
However, the raw natural gas from the wellhead are not pure methane. It is because the raw natural gas are comes along with semi-liquids hydrocarbon condensate and also some impurities. To produce what is known as the ‘pipeline quality’ dry sales gas, the natural gas need to undergo some process to separate the hydrocarbons;
ethane, propane, butane and condensate and also to separate the impurities such as carbon dioxide (CO2), Hydrogen Sulphite (H2S), mercury (Hg), water and etc.
One of the impurities that need to be removed from the gas stream is the carbon dioxide gas (CO2). The presences of CO2 in the natural gas are very dangerous because when CO2 come contact with the water, it will form an acid. This gas usually known as acidic gas or sometimes known as sour gas can act as the poison in the catalytic process which has the potential to corrode the pipeline and equipment that lead to the gas leakage. Study about impact of the CO2 to the pipeline and equipment are done by some researcher and it is proven through the experimental work by them.
A variety of capture processes have been developed for removing or isolating carbon dioxide from a gaseous stream. These processes include absorption, adsorption, membrane separation, cryogenic fractionation. However, due to the high content of carbon dioxide present in the natural gas, those technologies need to repeat the process in order to remove all the carbon dioxide from the natural gas.
Repeating of those processes actually are very costly as there are a lot of important things need to be concern. For example, the design life of the packed bed and how many cycle they can up to, the life of those catalyst, the cost of catalyst itself and maintenance cost when the replacement of catalyst take place. And according to the Beatrice Castellani (2012); he said that one of the biggest issues is the high energy consumption for CO2 separation. It has been estimated that, the cost of separation
and disposal of CO2 from existing coal-fired, air-blown boilers would increase the cost of electricity by about 75%.The cost of CO2 separation may reduce the power generation efficiency from 38 to 26% . Nowadays, since energy is the major factor, it is clear to find a new technology which is more economic such as using the gas crystallization or gas hydrate to capture and remove the carbon dioxide.
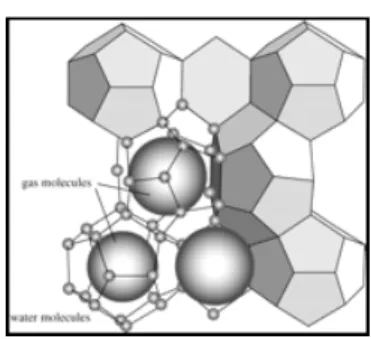
A gas hydrate is a crystalline solid compounds formed between the water molecules and gas molecules. Gas hydrate formation is like the ice form but it is more stable compare to ice as the structure of gas hydrate contains of water molecules and gas molecules. This hydrate sometimes is known as the clathrates or inclusion compound which means; a molecule of one substance is enclosed in structures that were built up from molecules of other substances. Usually, the water molecules will be the cage build up and is called as the host molecules while the gas molecules that were trapped inside the cage are known as the guest molecules. With the combination of water, many of the components found in the natural gas can form hydrate.
Figure 1.1.1: Structure of Normal Ice and Gas Hydrate [adapted from Reinhard Hesse (2002)]
Figure 1.1.2: Typical Structure of gas hydrate with water molecules linked together to form a cage trapping a gas molecule such as Methane Gas (adapted from Mark Maslin, Matthew Owen, Richard Betts, Simon Day, Tom Dunkley Jones and Andrew Ridgwell (2011)]
Hydrates are classified into two types which are; Type I, Type II and Type H.
Sometimes, these two types of hydrates are referred as Structure I, Structure II and Structure H. The classification of the hydrate are depends on their arrangement of the water molecules in the crystal. Type I is the simplest hydrate structure forms in the natural gas. While the Type II hydrate are more complex compared to the Type I and the structure for Type H is more complex compare to the Type I and Type II.
A given hydrate structure is typically determined by the size and shape of the guest molecule. Type I hydrate formers include methane, ethane, carbon dioxide and hydrogen sulfide. Among the common type II formers in the natural gas are nitrogen, propane and isobutene. Below is the figure showing the illustration of Type I, Type II and Type H gas hydrate.
Figure 1.1.3: Illustration of the three different gas hydrate cage structure; within each cage one gas molecules can be held [adapted from Beatrice Castellani (2012)]
However, studied and application by various gas industry has been reported that; by using only gas hydrate to capture and remove the carbon dioxide from the natural gas are less efficient. This is due to the conditions of gas hydrate that required high
pressure and low temperature condition which means; they need to use additional equipment to favor those conditions. Thus, regarding the problem face, an addictive to promote the hydrates are introduced which is Sodium Dodecyl Sulfate.
According to the literature data, there are several solutions that can be used to promote the gas hydrate which are; Tetra-n-Butyl Ammonium Bromide (TBAB), Tetrahydrofuran (THF), cyclo-pentane (CP) and Sodium Dodecyl Sulfate (SDS).
Among of these solutions, SDS is chosen for this project to test and proceed with the experimental work as SDS is proven by various researchers that SDS is capable to promote the hydrate formation by shifting the equilibrium phase of temperature and pressure.
Figure 1.1.4: Sodium Dodecyl Sulfate (SDS) [adapted from Beatrice Castellani (2012)]
1.2 Problem Statement
The effects of SDS solution on the kinetic measurement for gas hydrate are proven to be better than favoured condition. From the studied and experimental work done by the researcher, it shows that SDS has the potential to promote the hydrate formation in natural gases. SDS will reduce the equilibrium pressure and increase the equilibrium temperature.
However, there is only a limited number of this data available in the literature because the time-dependent for gas hydrate phenomena are difficult to measure.
Thus, through this project, the data of gas hydrate kinetic measurement for gas hydrate (with the presence of promoter; SDS) will be recorded.
1.3 Objectives
In order to complete the project of Formation Kinetic of Mixed Hydrate of Carbon Dioxide and Methane in the presence of promoter; SDS, it involves the experimental work to:
1. To collect and analysis the gas hydrate formation kinetic measurement data for composition of mixed CO2-CH4; 70%CO2:30%CH4.
2. To collect and analysis the gas hydrate formation kinetic measurement data using 0.03 mole% concentration of SDS Solution towards the composition of mixed CO2-CH4; 70%CO2:30%CH4.
1.4 Scope of Study
The case studies are concern on the kinetic measurement of mixed gas hydrate with the presence of the promoter which is Sodium Dodecyl Sulfate (SDS). By using the hydrate promoter, it is actually can promote the hydrate formation in the mixed gas through shift the equilibrium of lower temperature and high pressure condition. Thus, this formation kinetics of gas hydrates along with the hydrate promoter; SDS can be observed, measure and recorded through the experimental work in the laboratory.
Due to the time limit, the experimental will cover for the mixed 70%CO2:30%CH4
with and without 0.03 mole% of concentration of SDS Solution.
CHAPTER 2
LITERATURE REVIEW AND THEORY
2.1 Effect of CO
2to the Pipeline and Equipement
Natural gas from the well comes along with the other impurities which need to be removed. One of the impurities is the Carbon Dioxide Gas (CO2). The presence of CO2 in the natural gas can act as the poison in the catalytic process and it has the potential to corrode the pipeline and equipment which then lead to the gas leakage.
The percentages of CO2 in the natural gas are quite high. Below are the table and also bar chart that represent the percentage of CO2 in natural gas from non-associated gas, associated gas and boil-off gas.
Table 2.1.1: Mol % dry of component in natural gas [adapted from PETRONAS Technical Standards (PTS) 01.00.02.12-Gen; PETRONAS Gas Berhad (PGB)]
Component Mol % dry
Non-associated Gas Associated Gas Boil-Off Gas
Methane (C1) 87.1 76.6 26.0
Ethane (C2) 5.5 11.9 19.3
Propane (C3) 2.6 5.8 21.5
Butane (C4) 1.4 2.3 17.0
Pentane (C5+) 0.4 0.6 12.0
Carbon Dioxide
(CO2) 2.7 1.9 4.0
Figure 2.1.1 : Percentage of CO2
From Yoon-Seok Choi, Srdjan Nesic and David Young (2010) in Effect of Impurities on the Corrosion Behavior of CO2 Transmission Pipeline Steel in Supercritical CO2- Water Environment; they has been done the experiment about the corrosion property of carbon steel using an autoclave under CO2-saturated water phase and water saturated CO2 phase with impurities (O2 and SO2). The results showed that the corrosion rate of carbon steel in CO2-saturated water was very high and it increased with adding the O2 in the system.
Figure 2.1.2: Corrosion rates of carbon steel and 13Cr steel in CO2-saturated water with and without oxygen for 24 hours [adapted from Yoon-Seok Choi, Srdjan Nesic and David Young (2010)]
Figure 2.1.3: SEM image and EDS spectra of the corroded surface of sample exposed in CO2-saturated water for 120 hours. (a) without oxygen, (b) with oxygen. [adapted from Yoon-Seok Choi, Srdjan Nesic and David Young (2010)]
According to the U.S. Department of Energy-USDOE (2006) in Final Risk Assessment Report for the Future Gen Project Environmental Impact Statement; a carbon dioxide pipeline failure could result in loss of product containment, causing a release and in rare instances, a large-scale rupture. U.S. Department of Energy- USDOE (2006) stated that; the incident statistics for carbon dioxide pipeline has been compiled by Gale and Davison (2002); ten accidents occurred between the periods from 1990 to 2002, with property damage total about US$ 469,000.
According to the U.S. Department of Energy-USDOE (2006) in Final Risk Assessment Report for the Future Gen Project Environmental Impact Statement; the average failure rate was 0.000169 failures per mile of carbon dioxide pipeline per year. Below is the table that shows the failure rates of CO2 pipelines. The second most accident of failure rates for Carbon Dioxide is due to the corrosion which contributes about 20%.
Table 2.1.2: Failure Rates for Carbon Dioxide Pipelines [adapted from U.S. Department of Energy- USDOE (2006)]
Failure Mode Total Number of Accident Between 1986-2008
Percentage (%)
Equipment Failure 6 60
Corrosion 2 20
Operation Error 2 20
Total 10 100
2.2 Previous Study on Gas Hydrate
Yuri (1997); Davy et al (1811) said, most specialist believed that the gas hydrate were first obtained in 1810 in the laboratory of Sir Humphrey Davy, who cooled an aqueous solution saturated with chlorine gas below 9°C to yield a crystal ice like material.
However, analysis and studied made by the researcher obtain the evidence which the gas hydrate retrieval more than 30 years. Joseph Priestly (1778-1780) in Versuche
und Beobachtungen uber vershiedene Gattungen der Luft, three-volume work; has report the result of his experiments which he managed to obtain the hydrate of sulphur dioxide (SO2) both from its water solution and from the gaseous phase and ice. Nine new gases were discovered by Joseph Priestly that include the oxygen (O2), hydrogen (H2), carbon dioxide (CO2) and sulphur dioxide (SO2).
Studied and investigation from various scientist; D.B Robinson, E.D Sloan, G.D Holder, J.M Brooks, M.S Selim, P.R Bishnoi and many other on the molecular structure of hydrates has given us the theory on prediction of hydrate conditions.
Then followed by B.A Nikitin which then turn his attention to the structure of inert gas hydrate and for the first time, he started propositions on Chlarate cage structure crystal hydrate in between 1936-1940.
Yuri F. Makagon (1997) in Hydrate of Hydrocarbon; Davy (1811) had reported that Nikitin showed hydrates of individual gases and their mixture to be non- stoichiometric compounds representing a crystal lattice built up from hydrogen- bonded water molecules, with cages filled by gas molecules bonded with water by the weak Van der Waals forces. Sloan (1998); Taylot et al,. (2004) also reported that the natural gas chlarate owe their existence to the ability of water molecules to assemble via hydrogen bonding and form polyhedral cavities.
The gas hydrate properties are depend on the temperature, pressure and as well as to the presence of water and gas molecules. The gas hydrate will form at low temperature and high pressure with the present of gas molecules in between the water molecules. According to McCallum et al (2007); he describe about the pressure vessel size on gas hydrate formation. Repeated experiment made by him shows the result that hydrates are consistently forming at lower overpressure.
According to Sabil K.M (2009); hydrate technique which is used to capture and remove carbon dioxide offer some benefits. For example, one of the main condition to form the hydrate are with the presence of water which; cheap and green raw material. Moojier Van Den Heuvel (2004); Sabil K.M (2009); also state that reduction of energy requirement for hydrate formation can be obtained by include hydrate promoter in the hydrate promoter; an organic chemical with low
concentration. With the presence of the hydrate promoter, it will decrease the pressure requirement or increase the temperature at which the clathrate hydrate are stable.
Wong et al (2002) said that; Experimental research at the Los Alamos National Laboratory (LANL, US) proved that hydrates can be produced in a flow-through system. This demonstration is essential for the industrial implementation of gas hydrate technology. And according to the Spencer et al., (1998- 1999); since hydrate- based technology was first proposed to separate CO2, many studies have sought to mitigate the hydrate formation conditions and increase the hydrate formation rate and gas capacity.
2.3 Hydrate Promoter
Based on Mori et al., (2003); a key element for the successful development of hydrate-based CO2 capture technology is the improvement of gas/liquid contact, which can also improve hydrate growth. According to Belandria et al. (2012);
regarding the former, some additives can mitigate the hydrate equilibrium conditions, such as tetrahydrofuran (THF), tetrabutyl ammonium bromide (TBAB), tetrabutyl ammonium fluoride (TBAF), cyclopentane (CP), cyclobutanone, and dodecyl trimethyl ammonium chloride (DTAC).
Promoters are introduce to the hydrate system in order to achieve better temperature or pressure condition compared to the favored one; high pressure and low temperature. According to Sabil KM (2009); cyclic ethers have been generally known to form simple hydrates with water or mixed hydrates with low-molecular weight gases such as CO2, CH4 and N2. Sabil KM (2009); state that introduction of these promoter has been proven to lower the hydrate formation pressure up to about 30 – 80% at a specified temperature.
Lee HJ, Lee JD, Linga P, Englezos P, Kim YS, Lee MS, et al (2010); has done some research and reported that some of the promoter additives for the fuel gas mixture are cyclo-pentane (CP), tetra-hydrofuran (THF) and propane (CH ). However, in
addition to the relatively high operating pressure and the relatively low operating temperature, this process still has two hydrate stages, which means; it is a complicated process with enormous apparatus and operating costs.
According to Di Profio, P., Arca, S., Germani, R., Savelli, G., (2005); another promoter is Sodium dodecyl sulfate (SDS), which seems the best commercially available surfactant to be used for enhancement of hydrate formation and has already been investigated in various works. t was found that a small concentration of SDS added to the aqueous phase drastically increases the kinetics of hydrate formation.
However, the data for hydrate promoter especially SDS Solution are not complete yet and more experimental work need to be done.
2.4 Hydrate Mechanism
Vysniaskas and Bishnoi (1983); Englezos et al (1987); Skovborg et al (1993);
Natarajan et al (1994); Kashciev and Firoozabadi (2003); Sabil, K.M (2009); has stated that, the formation of hydrate is generally divided into two processes which is the nucleation process and stable growth process. Nucleation process is the process where the hydrate nuclei are form and grow to a critical size. The growth of the nuclei to a critical size is made up a stable nucleus which then leads to the formation of crystal hydrate.
According to Sabil K.M (2009); gas hydrate nucleation and growth have been investigated experimentally using different experimental techniques and expressions which have been develop to describe the acquired data. Due to stochastic and time- dependent nature of clathrate hydrate nucleation and growth, there is still a lot of on- going specific discussion pertaining to these issues. Nerheim et al (1992); Englezos et al (1987); has reported that, from the experimental and calculated, the results showed that a stable hydrate nucleus should have a radii between 25-170 Å.
Sabil K.M (2009); the formation of gas hydrate is a phase transformation which required a supersaturated environment in order for it to occur. At the point where the
gas molecules started to dissolve in the water molecules, the supersaturated environment is created and at the some point, the nuclei will appear. With the sufficient of gas molecules into the water molecules, the nuclei will keep growing until to its critical size.
Based on a series of measurements performed for natural gas and carbon dioxide hydrate, Long and Sloan (1996); suggested that the site of hydrate nucleation is located at the water-gas interface. Huo et al., 2001; Østergaard et al., (2001);
Kimuro et al., (1993); Fujioka et al., (1994); Hirai et al., (1995); Mori, (1998); also reported that, this suggestion is supported by a number of other researchers based on observations made on methane hydrate.
Sloan and Koh (2007); has explained the vapour-liquid interface is preferred for the hydrate formation not only due to the lowering of the Gibbs free energy of nucleation but also due to high concentration of water and guest molecules, which is required for hydrate nucleation. The theory about the nucleation process and growth then were focused on the vapour-liquid interface.
According to Sabil K.M (2009); there are two hypothetical theories that describe about the nucleation mechanism. The first one is about the cluster nucleation theory from Christiansen and Sloan (1994); which proposed that water molecules form labile clusters around the dissolved gas molecules and these clusters of dissolved species combine to form hydrate unit cells. Another theory is from Long and Sloan (1996); Kvamme (1996); stated that nucleation is taking place at the vapour side of the vapour-liquid interface.
2.5 Induction Time
According to Sabil K.M (2009); one of the important parameters used to characterize hydrate nucleation is the induction time. The induction time is the time elapsed during the nucleation processes which include formation of gas-water clusters and their growth to stable nuclei with a critical size. The induction time can be obtained
by observing the pressure-time relationship for a hydrate forming system such as presented Figure 2.5.1.
Figure 2.5.1: Schematic representation of the pressure changes with time during a typical kinetic hydrate formation experiment [adapted from Jensen et al., 2008]
Sabil K.M (2009); said that, according to the Figure 2.5.1, the dissolution of gas in the liquid aqueous phase causes the initial pressure drop from P0 to Psol. After a steady-state condition is reached, the pressure stabilizes until tind at which a sudden pressure drop is detected as hydrate starts to form. This point is also known as turbidity point. The pressure keeps decreasing as gas is consumed during the hydrate formation process until it reaches Plim where no more hydrate forms. The induction time is calculated as:
Induction time = tind − tsol
According to Jensen et al., (2008); the curve presented in Figure 2.4.1 is slightly idealized for illustration purposes. Deviation from the shape can appear for example when tind is lower than tsol or if the gas solubility in water is sufficiently low.
Moreover, if temperature of the systems is decreasing with increasing time, the line between tsol and tind is not straight due to gas contraction upon cooling. The induction time is also dependent on the super saturation of the guest component in the aqueous phase.
However, Mulin (2004); has stated that heterogeneous nucleation plays an important role in the formation of ice which then were supported by Kashchiev and Firoozabadi, (2002); thermodynamically favoured over homogeneous nucleation of gas hydrate. Sabil K.M (2009); also reported that, heterogeneous nucleation has causes the induction time to be very sensitive to any heterogeneities in solution, i.e., impurities can possibly cause significant deviation from the measured induction times.
CHAPTER 3 METHODOLOGY
3.1 Project Activities
Figure 3.1.1: Project Flow
3.2 Calculation Involved
I - Calculation of number of moles consumed
To calculate the moles of gas consumed we use the equation of real:
PV = nZRT (1)
In terms of moles:
n = PV/ZRT (2)
The compressibility factor, Z is calculated from Peng-Robinson Equation:
(3)
a(T) = (4)
b = (5)
β = 0.37464 + 1.5422ω – 0.26992ω2 (6)
Molar volume can be calculate based on Van Der Waals Equation : ν = B + (7)
B = ] (8)
II - Calculation of rate constant
In order to obtain apparent rate constant (k app), the mole of gas profile must be constructed. Since, the formation of gas hydrates can be assumed to be fixed; 1st order reaction, the mole of gas profile can be plotted by using the equation below:
= k (n - ns) (9) (10)
Where:
no = initial mole of the gas (mol/L)
n = mole of the gas at time t (mol/L)
ns = saturated mole of the gas at the stationary point (mol/L)
K = apparent rate constant (1/hr) T = time (hr)
3.3 Experimental Work
Experiment will be divided into two parts; Part I Experiment is to collect and investigate the data of gas hydrate formation kinetic measurement for 70%CO2:30%CH4 without the promoter; SDS Solution. Part II Experiment is to collect and investigate the effect for 0.03 mole% concentration of SDS solution towards 70%CO2:30%CH4 on its gas hydrate formation kinetic measurement. All the data will be analysing using the Gas Chromatography.
There will be no dangerous chemical involves in this experiment. Basically, we only need the gaseous of Carbon Dioxide, Methane as well as solution of Sodium Dodecyl Sulfate. However, the experiments need to be done carefully as; it is dealing with the high pressure for mixed CO2-CH4.
Thus, the Personal Protective Equipment (PPE) needs to be wears all the times when run the experiment. Below is the list of chemicals and suppliers for CO2, CH4 and SDS Solution.
Table 3.3.1: List of Chemical Used
Chemical Purity (%) Supplier Phase
De-ionized water 100 Own Liquid
Carbon dioxide (CO2) 99.995 Mox – Linde Gases Sdn. Bhd Gas Methane (CH4) 99.95 Mox – Linde Gases Sdn. Bhd Gas Sodium Dodecyl Sufate
(SDS) 99 Merck Sdn. Bhd. Liquid
The procedure and the flow rate calculation to mixed the gaseous between CO2 and CH4 are depends on the maximum flow rate of the Gas Mixing Equipment. Based on the table 3.3.2, it shows the Maximum Capacity Flow rate of Gas Mixing Equipment.
Thus, all the calculation for Part I Experiment and Part II Experiment are reduced by 1600 ratio to fit with the Gas Mixing Equipment Capacity Flow rate.
Table 3.3.2: Maximum Capacity Flow rate of Gas Mixing Equipment
Components Maximum Flow rate (mg/min)
Carbon Dioxide (CO2) 0-1980
Methane (CH4) 0-700
During the experiments, the reactor and supply vessel will immerse in a temperature- controlled water bath in which; the water was directly circulated from the bath for the fast temperature response. The composition of the gas mixture will be set according to the Table 3.3.2. The changes of pressure and temperature are recorded by data acquisition system.
For about 2-3 hours, if there is less changing in pressure drop and increase in temperature, the experiment is consider to be done. The data will be collected by the Data Acquisition system.
Figure 3.3.1: The Equipment used for Part I and Part II Experiment. 1:Gas Mixing Equipment, 2:Reactor that immersed in the water bath, 3:Circulation of water bath for rapid increase of temperature, 4:Programmable Temperature Controller
The hydrate formation kinetic measurement data for both; 70%CO2:30%CH4 composition of mixed CO2-CH4 with and without 0.03 mole % concentration of SDS solution can be observed through the induction time that which is defined as the time elapsed during the nucleation process. The induction time can be obtained by observing the pressure-time relationship. To measure the induction time, a high pressure reactor will be used. Rapid decrease of pressure and increase in temperature indicates that the hydrate formation is take place in the system.
3.3.1 Part I Experiment:
70%CO2:30%CH4without SDS Solution
To investigate and collect the data of hydrate formation kinetic measurement for mixed CO2-CH4, the composition 70%CO2:30%CH4 will be used. The composition is the highest composition of carbon dioxide which is 70%. Below are the data that are calculated and needed during Part I Experiment; for 70%CO2:30%CH4 composition of mixed CO2-CH4 and it isreduced by ratio 1600.
Calculations are made based on the Gas Mixing Equipment limits. This calculation was then used to set the flow rates of both the gases which is in mg/min.
Procedure for Part I Experiment Before the experiment:
1. Insert 100ml of de-ionized water and magnetic bar (stirrer) into the vessel
2. Lock the bolt of reactor
Table 3.3.1.1 : 70%CO2:30%CH4 without promoter
Sample Gas Mole MW
Gas Mixing Limit (g)
Actual Mass g1
(g)
Reduce/
increase by ratio
New Mass g2
(g)
A CO2 70 44 1980 3080 3080/1.6 1925
CH4 30 16 700 480 480/1.6 300
3. Submerge the reactor into the water bath
4. Vacuum the Gas Mixer Tank with the mixed CO2-CH4 gas 5. Set the flow rate for CO2 and CH4 (refer to the Table 3.3.1.2) 6. Set the pressure of gas mixture at 40 bar
7. Set temperature of Programmable Temperature Controller to 15oC
During the experiment:
1. Start the experiment by purge some gases from the reactor to remove excess air (at list 5 times) by using CO2-CH4 mixed gas
2. When the pressure reach up to 40 bar, take the 1st sample of mixed CO2-CH4 gas (before hydrate) and then analyse it with the Gas Chromatography
3. Wait until temperature and pressure have stabilize 4. Switch on stirrer at 500rpm
5. Notice a decrease in pressure, wait until the pressure stabilize, now slowly reduce the temperature to 10oC and leave the system for 2-3 hours
6. Sudden pressure drop will indicates that the formation of hydrate takes place
7. The change in pressure and temperature is recorded by data acquisition system
8. If the pressure unchanged for about 2 to 3 hours, the hydrate formation is completed
9. Take the 2nd sample (after hydrate) and then analyse it with the Gas Chromatography
10. End of experiment
After the experiment:
1. Switch off the stirrer
2. Set the temperature of Programmable Temperature Controller to 15oC and wait for 2-3 hours
3.3.2 Part II Experiment:
70%CO2:30%CH4with SDS Solution
Second part of the experiment will involved with the SDS Solution which; the main reasons is to see that; if SDS Solution are capable to promote hydrate for mixed CO2-CH4 at better condition (low pressure and high temperature compare to gas hydrate). Thus, during this experiment, 0.03 mole % concentration of SDS solution will be used. Table 3.3.2.1 provided the list of concentration of SDS solution in mole% that will be used.
Table 3.3.2.1: Concentration of SDS Solution
Sample
Composition (mole %)
Concentration of SDS solution in
mole %
Concentration of SDS solution in ppm CO2 CH4
B 70 30 0.03 mol % 5000
Procedure for Part II Experiment Before the experiment:
1. Dilute 1g of SDS with 24ml of distilled water
2. Insert 12mL of dilution of SDS Solution with the 87.5mL of de-ionized water
3. Lock the bolt of reactor
4. Submerge the reactor into the water bath
5. Vacuum the Gas Mixer Tank with the mixed CO2-CH4 gas 6. Set the flow rate for CO2 and CH4 (refer to the Table 3.3.1.2) 7. Set the pressure of gas mixture at 40 bar
8. Set temperature of Programmable Temperature Controller to 15oC
During the experiment:
1. Start the experiment by purge some gases from the reactor to remove excess air (at list 5 times) by using CO2-CH4 mixed gas
2. When the pressure reach up to 40 bar, take the 1st sample of mixed CO2-CH4 gas (before hydrate) and then analyse it with the Gas Chromatography
3. Wait until temperature and pressure have stabilize
4. Switch on stirrer at 500rpm
5. Notice a decrease in pressure, wait until the pressure stabilize, now slowly reduce the temperature to 10oC and leave the system for 2-3 hours
6. Sudden pressure drop will indicates that the formation of hydrate takes place
7. The change in pressure and temperature is recorded by data acquisition system
8. If the pressure unchanged for about 2 to 3 hours, the hydrate formation is completed
9. Take the 2nd sample (after hydrate) and then analyse it with the Gas Chromatography
10. End of experiment
After the experiment:
1. Switch off the stirrer
2. Set the temperature of Programmable Temperature Controller to 15oC and wait for 2-3 hours
3.4 Key Milestone
Table 3.4.1: Key Milestone Milestone
Planned Timescale
(week)
Commentary Progress
Semester June 2012 Information gathering:
Background study
Data gathering
literature review
1 - 5
Information gathering from the books such as ‘Natural gas Hydrate’, ‘Hydrate of Hydrocarbons’ and as well as from several journals.
Complete
Submission of Extended
Proposal 5 – 6
Extended proposal will be submitted to the supervisor/ co-supervisor before going on oral presentation for proposal defence.
Complete Proposal Defence 8 – 9 Student need to do the oral presentation to Complete
Presentation the supervisor and internal supervisor.
Tutorial for experiment and Learning of SDS
solution 8 – 11
There will be tutorial session by Miss Nurmala who one of the Master Student in UTP that also working on this project
Complete
Submission of Interim
Report 13 – 15
Interim Report will be submitted to the supervisor / co-supervisor. The Interim Report will be evaluating both by supervisor and internal examiner.
Complete
Semester September 2012 Experiment test
1 – 3
Before proceed with the experiment, there will be held an experiment test to test the new equipment; Gas Mixing Equipment
Complete
Part I Experiment
1 – 8
Part I Experiment cover the information and data needed for kinetic formation for composition 70%CO2:30%CH4 of mixed CO2-CH4 gas hydrate
Complete
Submission of Progress
Report 8
Progress report will be submitted to Supervisor and Internal Examiner to see the progress of the project
Complete
Part II Experiment
9 – 15
Part II Experiment cover the information and data needed for kinetic formation for 0.03 mole% concentration of SDS Solution toward 70%CO2:30%CH4 gas hydrate
Complete
Pre-EDX
11 There will be held a presentation of the
project to the internal examiner Complete Submission of Project
Dissertation (Soft
Bound) 13
Submit the Project Dissertation in soft copy need to be submitted to the co-ordinator, Supervisor and External Examiner
Complete
Submission of
Technical Paper 13 Technical paper regarding the project need
to be done and submit to the supervisor Complete Oral Presentation
14
There will be an oral presentation regarding the project. Student will present their project to the supervisor and internal examiner
Complete Submission of Project
Dissertation (Hard
Bound) 15
Submission of complete report for Project Dissertation in hard Copy to the Co- ordinator of FYP II.
Complete
3.5 Gantt Chart
Project Flow / Task Semester June 2012 Semester September 2012
1 2 3 4 5 6 7 8 9 10 11 12 13 14 15 1 2 3 4 5 6 7 8 9 10 11 12 13 14 15
Information gathering:
Background study
Data gathering
literature review
Mid Semester Break Mid Semester Break
Project Conformation:
Formation Kinetic of Mixed Hydrate of CO2 and CH4 in the Presence of Promoter
Submission of Extended Proposal Proposal Defence Presentation Tutorial for experiment and Learning of SDS solution
Submission of Interim Draft Report Submission of Interim Report Experiment test
Part I Experiment
Submission of Progress Report Part II Experiment
Pre-EDX
Submission of Draft Report
Submission of Dissertation (Soft Bound) Submission of Technical Paper Oral Presentation
Submission of Project Dissertation (Hard Bound)
CHAPTER 4
RESULT AND ANALYSIS
5.1 CSMGem Software Predicted
Figure 4.1.1 : Hydrate Three-Phase (H-LW-V) Equilibria Lines Predicted by CSMGem This data was collected to predict the mixed gas hydrate by CSMGem Modeling Software. This program is built on a thermodynamic model capable of predicting hydrate phase behaviour, including phase boundaries and flash calculations. It performs any selected calculation on our choice of components and conditions. In this case the program calculated the required pressure for hydrate formation at a specified temperature. The calculated values of pressure over a range of temperature formed the hydrate incipient line.
Another advantage of this prediction is that the onset of the nucleation process or induction time can be more easily approximated if we know when the system entered into the hydrate forming region. Thus, through these predictions; it enables us to identify the phase equilibrium of temperature and pressure by showing the separated of the hydrate forming and non-forming regions. We can set the suitable and appropriate condition of pressure and temperature for the experiment. For this project, the pure carbon, pure methane and various composition of mixed CO2-CH4
has been predicted.
According to the Figure 4.1.1, the graph shows the phase equilibrium between H- Hydrate, LW- Liquid water and V-Gas phases. The pure methane, pure carbon dioxide and 70%CO2-30CH4 are being predicted through this software. All the composition shows that the possible region to form the hydrate is between 100 bars of pressure and 288 K (00C) of temperature.
When the experiment started, the temperatures for each sample are set outside of the hydrate forming region which is at 150C to make sure that the hydrate will not form at the beginning of the experiment. Then, after the pressure is stabilized at 100 bars, the temperatures then are slowly reduces to the points where the hydrate are expected to form. However, according to the theory, CO2 will change it phase from gas phase to liquid phase when it reached 100 bars. Thus, for both experiment, the pressure are set to 50 bars.
For both part of experiment, a Gas Mixing Equipment will be used in order to mix the gaseous between Methane and Carbon Dioxide. The Carbon Dioxide and Methane gas are mixed in the cylindrical tank before they are sending to the reactor by a compressor.
5.2 Part I Experiment: 70%CO2:30%CH4 without SDS Solution 4.2.1 Gas Chromatography (GC) Results
Figure 4.2.1.1 : 1) Sample collected in the tedlar sampling bag. 2) Gas Chromatography
At the beginning of the experiment, after the system is being pressurized about 5 times, pressure of the reactor is set to 50 bars and the temperature is set at 150C.
After the pressure is stabilized (at 50 bars), the temperature is slowly reduced to 100C. During the experiment, there will be 2 samples taken from each of the composition of mixed CO2-CH4 which are; sample before the hydrate form and the sample after the hydrate form.
These samples are collected in the tedlar sampling bag and then were send to the GC to be analysed. The results then will re-confirm the composition of the gas mixture form by the Gas Mixing Equipment.
Thus, from the GC result, we can see the composition of CH4 and CO2 where; the composition of CO2 will be reduced after the hydrate form as according to the theory, the gas hydrate will capture CO2 from CH4 gas. Below are the table as well as the graph of the result for 70%CO2:30%CH4 composition of mixed CO2-CH4 (without promoter).
Table 4.2.1.1: Concentration of CO2 & CH4 Before and After Hydrate (without Promoter) Gas Concentration % of gas in mixed CO2-CH4
Before hydrate CO2 70.55 70.60
CH4 29.38 29.40
After hydrate CO2 33.53 64.98
CH4 18.07 35.02
Figure 4.2.1.2 : Concentration of CO2 (without Promoter)
Figure 4.2.1.3 : Concentration of CH4 (without Promoter)
Figure 4.2.1.4 : Percentage of CO2 and CH4 in mixed CO2-CH4 (without Promoter)
From the GC result, it shows that; both of the concentration for CO2 and CH4 are reduce after the hydrate form. The decreasing of concentration of Carbon Dioxide is higher than Methane which it reduces from a concentration of 70.55 to 33.53 that contributes of Carbon dioxide loss about 37.01%. However, it also shows the decreasing of Methane gas from a concentration of 29.38 to 18.07 that contribute of Methane loss about 11.32%.
Thus, it can be conclude that from 70%CO2:30%CH4 composition of mixed CO2- CH4 without promoter, 37.01% of CO2 and 11.32% of CH4 will be captured and removed by gas hydrated. GC result also shows the mole percent of Carbon Dioxide
and Methane that satisfies with the set point which is 70mole% of Carbon Dioxide and 30mole% of Methane.
4.2.2 Experimental Result Sample A (70%CO2- 30%CH4)
Figure 4.2.2.1: Sample A
For sample A; 70% mole of carbon dioxide and 30% mole of methane has been used.
Figure 4.2.2.1 shows the graph of Pressure vs. Temperature that obtained for Sample A. This experiment has being run for more than 5 hours. Based on the graph above, it shows that the pressure drop from 36 bars to 19 bars at 10 minute after it start recorded by the Data Requisition System. After a steady-state condition is reached, the pressure stabilizes until a sudden pressure drop from 19 bars to 16 bars at minute 118. This is where the induction time took place in the experiment.
At 118 minutes is where the hydrate starts to form in the mixed 70CO2:30CH4 composition with the pressure slowly drops from 19 bars to 16 bars. After 20 minutes, the system shows there are less changing of pressure detect after it drop at minute 118 which shows that there are no more hydrate form in the system. Thus, the experiment has been stop when there is less changing in pressure and temperature.
Time (s)
From the graph; it can conclude that the hydrate start to form at 118 minute after Data Requisition System start to recorded with the pressure drop from 19 bars to 16 bars and temperature at 100C.
5.3 Part II Experiment: 70%CO2:30%CH4 with SDS Solution 4.3.1 Gas Chromatography (GC) Results
The condition is same with the experiment Part I. At the beginning of the experiment, after the system is being pressurized about 5 times, pressure of the reactor is set to 50 bars and the temperature is set at 150C. After the pressure is stabilized (at 50 bars), the temperature is slowly reduced to 100C. During the experiment, there will be 2 samples taken from each of the composition of mixed CO2-CH4 which are; sample before the hydrate form and the sample after the hydrate form. These samples are collected in the tedlar sampling bag and then were send to the GC to be analysed.
The results then will re-confirm the composition of the gas mixture form by the Gas Mixing Equipment. Thus, from the GC result, we can see the composition of CH4
and CO2 where; the composition of CO2 will be reduced after the hydrate form as according to the theory, the gas hydrate will capture CO2 from CH4 gas.
Below are the table as well as the graph of the result for 70%CO2:30%CH4 composition of mixed CO2-CH4 (with Promoter).
Table 4.3.1.1: Concentration of CO2 & CH4 before and after hydrate (with Promoter) Gas Concentration % of gas in mixed CO2-CH4
Before hydrate CO2 65.04 69.62
CH4 28.38 30.38
After hydrate CO2 49.40 66.04
CH4 25.40 33.96
Figure 4.3.1.1 : Concentration of CO2 (with Promoter)
Figure 4.3.1.2 : Concentration of CH4 (with Promoter)
Figure 4.3.1.3 : Percentage of CO2 and CH4 in mixed CO2-CH4 (with Promoter)
From the GC result, it shows that; both of the concentration for CO2 and CH4 are reduce after the hydrate form. The decreasing of concentration of Carbon Dioxide is higher than Methane which it reduces from a concentration of 65.04 to 49.40 that contributes of Carbon dioxide loss about 16.74%. However, it also shows the decreasing of Methane gas from a concentration of 28.38 to 25.40 that contribute of Methane loss about 3.20%.
Thus, it can be conclude that from 70%CO2:30%CH4 composition of mixed CO2- CH4 with promoter, 16.74% of CO2 and 3.20% of CH4 will be captured and removed by gas hydrated. GC result also shows the mole percent of Carbon Dioxide and Methane that satisfies with the set point which is 70mole% of Carbon Dioxide and 30mole% of Methane.
4.3.2 Experimental Result Sample B (70%CO2- 30%CH4)
Figure 4.3.2.1: Sample B
For sample B; 70% mole of carbon dioxide and 30% mole of methane has been used.
Figure 4.3.2.1 shows the graph of Pressure vs. Temperature that obtained for Sample B. This experiment has being run for more than 4 hours. Based on the graph above, it shows that the pressure smoothly drop from 38 bars to 36 bars. After a steady-state condition is reached, the pressure stabilizes until a sudden pressure drop from 35 bars
Time (s)
to 20 bars at minute 85 after it start recorded by the Data Requisition System. This is where the induction time took place in the experiment. The moment of pressure to start drop is the time where hydrate is expected to be form in the mixed CO2-CH4.
After that, the pressure keep constant for a while and the experiment has been stop when the hydrate is forming in the system.
Thus, from the graph; it can conclude that the hydrate start to form at 85 minute after Data Requisition System start to recorded with the pressure drop from 35 bars to 20 bars at temperature at 100C.
4.3 Comparison of 70%CO2:30%CH4 With and Without Promoter
Table 4.3.1: Comparison of 70%CO2:30%CH4 With and Without Promoter Concentration of
SDS Solution Induction Time CO2 loss in %
CH4 loss in % Without
Promoter -
At 118 minutes after Data Requisition System start to record
37.01 11.32
With Promoter 0.03 mole%
At 85 minutes after Data Requisition System start to record
16.74 3.20
Based on the Table 4.3.1, it shows the comparison between 70%CO2:30%CH4 with and without the presence of promoter; SDS Solution. It shows that for the composition of mixed CO2-CH4 with promoter; its induction time is at 85 minutes after Data Requisition System start to be recorded which is faster than the composition of mixed CH2-CH4 without promoter which its induction time is at 118 minutes after Data Requisition System start to be recording. Thus, it is proven that by adding SDS Solution, it can promote the gas hydrate formation by; forming the gas hydrate faster than the composition of mixed CO2-CH4 without the presence of promoter at the same condition of pressure and temperature.
![Figure 1.1.1: Structure of Normal Ice and Gas Hydrate [adapted from Reinhard Hesse (2002)]](https://thumb-ap.123doks.com/thumbv2/azpdforg/11107571.0/12.892.306.655.602.744/figure-structure-normal-ice-hydrate-adapted-reinhard-hesse.webp)
![Figure 1.1.3: Illustration of the three different gas hydrate cage structure; within each cage one gas molecules can be held [adapted from Beatrice Castellani (2012)]](https://thumb-ap.123doks.com/thumbv2/azpdforg/11107571.0/13.892.274.649.518.941/figure-illustration-different-hydrate-structure-molecules-beatrice-castellani.webp)
![Figure 1.1.4: Sodium Dodecyl Sulfate (SDS) [adapted from Beatrice Castellani (2012)]](https://thumb-ap.123doks.com/thumbv2/azpdforg/11107571.0/14.892.207.750.478.689/figure-sodium-dodecyl-sulfate-sds-adapted-beatrice-castellani.webp)
![Table 2.1.1: Mol % dry of component in natural gas [adapted from PETRONAS Technical Standards (PTS) 01.00.02.12-Gen; PETRONAS Gas Berhad (PGB)]](https://thumb-ap.123doks.com/thumbv2/azpdforg/11107571.0/16.892.162.795.595.931/component-natural-adapted-petronas-technical-standards-petronas-berhad.webp)
![Figure 2.1.2: Corrosion rates of carbon steel and 13Cr steel in CO 2 -saturated water with and without oxygen for 24 hours [adapted from Yoon-Seok Choi, Srdjan Nesic and David Young (2010)]](https://thumb-ap.123doks.com/thumbv2/azpdforg/11107571.0/17.892.253.702.775.998/figure-corrosion-carbon-saturated-oxygen-adapted-srdjan-nesic.webp)

![Table 2.1.2: Failure Rates for Carbon Dioxide Pipelines [adapted from U.S. Department of Energy- USDOE (2006)]](https://thumb-ap.123doks.com/thumbv2/azpdforg/11107571.0/18.892.169.790.625.801/table-failure-carbon-dioxide-pipelines-adapted-department-energy.webp)
![Figure 2.5.1: Schematic representation of the pressure changes with time during a typical kinetic hydrate formation experiment [adapted from Jensen et al., 2008]](https://thumb-ap.123doks.com/thumbv2/azpdforg/11107571.0/23.892.296.666.195.527/figure-schematic-representation-pressure-changes-typical-formation-experiment.webp)