GOLD PRICE FORECAST USING NEURAL NETWORK
by
Hamadukan Salae
Dissertation submitted in partial fulfillment of the requirement for the
Bachelor of Engineering (Hons) (Electrical and Electronic Engineering)
SEPTEMBER 2011
Universiti Tekno1ogi PETRONAS Bandar Seri Iskandar
31750 Tronoh Perak Darul Ridzuan
CERTIFICATION OF APPROVAL
GOLD PRICE FORECAST USING NEURAL NETWORK
by
Hamadukan Salae
A project dissertation Submitted to the Electrical & Electronics Engineering Programme
Universiti Teknologi PETRONAS in Partial Fulfillment of the Requirements for the BACHELOR OF ENGINEERING (Hons) (ELECTRICAL & ELECTRONICS ENGINEERING)
App;:L~
(DR.ZUHAIRI B.HJ.BAHARUDDIN)
UNIVERSITI TEKNOLOGI PETRONAS TRONOH, PERAK
September 2011
CERTIFICATION OF ORIGINALITY
This is to certify that I am responsible for the work submitted in this project, that the original work is my own except as specified in the references and acknowledgements, and that the original work contained herein have not been undertaken or done by unspecified sources or persons.
HAMADUKAN SALAE
ABSTRACT
Gold is precious metal once widely used as standard for monetary exchange but was replaced by paper currency mostly used today. However interest in gold trading and investment has resurfaced. Recently, the gold future price is very important role f@r economic as well as it is under pressure of crude oil and inflation. And its price is always relatively higher, changing fast and difficult to forecast. Therefore, how to forecast the gold futures price is the. main objective of this project. This project wants to bring up a neural network by using artificial neural network {ANN) model. Hoping this model can forecast the gold futures price to give the investor to make the reference in deciding the best time in the future buy or sell gold. This project background study will include problem .statement to justify. this study, objective and scope of study, the relevancy of the project and feasibility of the project within the scope as well as time frame.
Literature review of history of gold will also cover aspects of the method of forecast the gold future price.
ACKHOWLEDGEMENT
Bismillahirrahmanirrahim, Alhamdulillah.
Thanks to Allah SWT, whom with His willing giving me the opportunity to complete this Final Year Project.
I am heartily thankful to my supervisor, Dr. Zuhairi B. HJ. Baharuddin, whose encouragement, guidance and support from the initial to the final level enabled me to develop an understanding of the subject until the final stage ofFYP process.
I would like to express my gratitude to my university, Universiti Teknologi PETRONAS for giving me the precious opportunity to study as well as provide me with the full support in the material, equipment and laboratory.
Lastly, I offer my regards and blessings to my family and all of those who supported me in any respect during the completion of the project.
Thank you.
CERTIFICATION ABSTRACT
ACKNOWLEDGEMENT
TABLE OF CONTENTS
CHAPTER!: INTRODUCTION
1.1 Background of Study • 1.2 Problem Statement 1.3 Objectives
1.4 Scope of study 1.5 Relevancy 1.6 Feasibility
CHAPTER2: LITERATURE REVIEW 2.1 Gold summary 2.2 Gold functions 2.3 History gold price 2.4 Prediction method 2.5 Artificial neural network 2.6 Network architecture • 2.7 Network Learning
CHAPTER3: METHODOLOGY .
3.1 Research methodology 3.2 Procedure identification 3.3. Project duration
3.4 Project activities 3.3. Key milestone 3.4 Tool required
iii iv
1 1 1 2 2 2 2
4 4 5 5 12 14 15 18
19 19 20 23 25 25 25
CHAPTER4:
CHAPTERS:
REFERENCES APPENDIX .
RESULTS AND DISCUSSION 4.1 Result and Discussion.
CONCLUSION
26 26
43
44 46
LIST OF TABLE
Table I Description of Prediction Methods 13
Table 2 Description of Transfer Functions 17
Table 3 Gantt Chart for Final Year Project I 23
Table 4 Gantt Chart for Final Year Project II 24
Table 5 Key Milestone 25
Table 6 Data Partitioning 26
Table 7 Data Partitioning 40 percent for training data,
10 percent for validation data and 50 percent for testing data 27 Table 8 Data Partitioning 40 percent for training data,
30 percent for validation data and 30 percent for testing data 28 Table 9 Data Partitioning 40 percent for training data,
40 percent for validation data and 20 percent for testing data 29 Table 10 Data Partitioning 40 percent for training data,
50 percent for validation data and 10 percent for testing data 30 Table 11 Data Partitioning 50 percent for training data,
10 percent for validation data and 40 percent for testing data 31 Table 12 Data Partitioning 50 percent for training data,
20 percent for validation data and 30 percent for testing data 32 Table 13 Data Partitioning 50 percent for training data,
30 percent for validation data and 20 percent for testing data 33 Table 14 Data Partitioning 50 percent for training data,
40 percent for validation data and 10 percent for testing data 34 Table 15 Data Partitioning 60 percent for training data,
10 percent for validation data and 30 percent for testing data 35 Table 16 Data Partitioning 60 percent for training data,
20 percent for validation data and 20 percent for testing data 36 Table 17 Data Partitioning 60 percent for training data,
30 percent for validation data and 10 percent for testing data 37
Table 18
Table 19
Table 20
Data Partitioning 70 percent for training data,
10 percent for validation data and 20 percent for testing data Data Partitioning 70 percent for training data,
38
20 percent for validation data and I 0 percent for testing data 39
Example of Gold Price Forecasted 42
LIST OF FIGURE
Figure I Daily gold price from January 2000
to December 2011 (Kitco, 2001) 5
Figure 2 Daily gold price from I January 2011
to 31 January 20 II (Kitco, 200 I) 6
Figure 3 Daily gold price from I February 2011
to 28 February 2011 (Kitco, 2001) 6
Figure 4 Daily gold price from I March 20 II
to 31 March 20 II (Kitco, 200 I) 7
Figure 5 Daily gold price from I April 20 II
to 30 April2011 (Kitco, 2001) 8
Figure 6 Daily gold price from I May 20 II
to 31 May 2011 (Kitco, 200 I) 8
Figure 7 Daily gold price from I June 20 II
to 30 June 2011 (Kitco, 2001) 9
Figure 8 Daily gold price from I July 2011
to 29 July 2011 (Kitco, 200 I) 9
Figure 9 Daily gold price from I August 2011
to 31 August 20 II (Kitco, 2001) 10
Figure 10 Daily gold price from 1 September 2011
to 30 September 20 II (Kitco, 200 I) 10
Figure 11 Daily gold price from 1 October 2011
to 31 October 20 II (Kitco, 200 I) 11
Figure 12 Daily gold price from I November 2011
to 31 November 2011 (Kitco, 2001) 11
Figure 13 Daily gold price from 1 December 2011
to 22 December 2011 (Kitco, 200 I) 12
Figure 14 Artificial Neural Network Concept (NeuroAI, 2011) 14
Figure 15 Simple ANN System Block Diagram 15
Figure 16 Single Layer Feedforward Network Block Diagram 15
Figure 17 Multilayer Feedforwark Network Block Diagram 16
Figure 18 Recurrent Networks Block Diagram 16
Figure 19 Linear transfer function 18
Figure 20 Tan-Sigmoid transfer function 18
Figure 21 Log-Sigmoid transfer function 18
Figure 22 Research Methodology Flow Chart 19
Figure 23 Project's Methodology 20
Figure 24 Comparison between Simulation and Actual 41 Figure 25 Comparison between Gold Price Predicted and Gold Price Actual 41
CHAPTER I INTRODUCTION 1.1 Background of study
In the past for several years until now, the gold has been played very important role in the human's life especially investor. Gold has proved itself to be an effective way to manage wealth. Every year the price of gold has kept pace with inflation. Its performance tends to move independently of other investments and key of economic indicators. And it does not damage with time therefore it has the ability of high store value. Thus the forecasting for the future gold prices now become an important to help the investor to pick a right time to do the selling or buying transaction of gold.
Forecasting is a planning tool that helps management in its attempts to deal with the improbability of the future, relying mainly on data from the past and present analysis of trends. Therefore, neural networks emerge to be a highly promising approach to financial forecasting and decision-making in fmancial analysis.
Initial experimentation with neural networks has been successful in a variety of domains with differing financial instrument.
1.2 Problem statement
The investors are not venture for gold investment because the price of gold is changing every day. Factors influencing gold prices are many such as due to weakening of us dollar, growth in demand for jewelry and increase in demand for exchange-traded paper backed products.
In this study, the forecast model to predict the future gold prices using Artificial Neural Network (ANN) is proposed.
1.3 Objectives
The objectives of the project are shown as follows;
• To outline the principle of ANN method
• To outline the history data of gold prices index
• To develop a forecast model to predict gold prices using ANN method
1.4 Scope of study
Generally, the scope of study will cover the following areas;
• Fundamentals of ANN method solving forecast problem
• Historical data for gold price index
• Simulation of develop model by using MATLAB software
• Study gold demand
1.5 Relevancy
The significance of the project is to make people know about the future gold price. As many countries have economic stuffer and the economic is depends on gold and oil price. In consequence the relevancy of the project is helps analyst for analyze the economic role in the future and have ability to know what will economic happen in the future is. While analyst know about the economic, analyst have ability to control the economic role and able to make the better economic for each country.
1.6 Feasibility study
The feasibility of this project is to complete the project within the scope and time frame, while maintaining substance to this project.
During the final year second semester (FYP I), the scope and task that will be covered are;
• Research on forecast method
• Analyze the history gold price
covered are;
• Study and analyze data
• Design the forecast method
• Forecast and Simulation
• Analyze result and conclusion
• Decision for the best forecast method
CHAPTER2
LITERATURE REVIEW
2.1 Gold summary
Gold is a fairly soft metal with a beautiful golden color. It is unusually ductile and malleable and can be hanunered into very thin sheets with a thickness of only 0.00001 in (0.00025 em). Gold foil of this thickness is used to make lettering on window signs. Gold has a melting point of 1,947°F (1,064°C), a boiling point of about 5,070°F (2,800°C), and a density of 19.3 grams per cubic centimeter. Gold is an excellent conductor of electricity and has a high optical reflectivity (Gale, 2005-2006).
Gold occurs in both elemental and compound states. At one time, large nuggets of gold could be found lying on the Earth's surface. Pieces of such size have long since been collected, although very finely divided gold dust still exists in a number of locations. The most common minerals of gold are the tellurides, such as gold telluride (AuTe2), present in the mineral calavarite. About a quarter of the world's gold comes from South Africa. Other leading producers of the metal are the United States, Australia, Canada, China, and Russia (Gale, 2005-2006).
In the few years ago, the economic has suffered; the price of oil stays at high level as well as all country was dropping in stock the oil. However, this problem are not affected to the gold price, which could resist the inflation, hedging and has a good conservative value. In addition the gold price has risen rapidly (Ismail, et al., 2009).
The main demand of gold comes from industry electronic industry and jewelry (Ismail, et al., 2009). However it a shreds with gold price change. The other demand comes from the government and investor's purchase that is the main factor to influence gold price (Xu, et al., 2009).
2.2 Gold function
Gold is the standard currency exchange for many countries. Most the gold is use for make jewelry. Some of industry also needs gold such as electronic industry user gold and alloy to weld, even though medical treatment and generally as investment tool (Xu, et al., 2009).
Intended for gold future function is divided in three categories which are hedging, price discovery and speculation (Xu, eta!., 2009).
• Hedging means the best way to avoid loss by the price fluctuation who wants to buy and sell gold in the future
• Price discovery means let people understand the gold expectation in the future
• Speculation means the people who have the ability and willing to accept the risk from the hedgers
2.3 History gold price
Appropriate gold price must be considered. Data are obtained from (History Gold Price, 2011). (History Gold Price, 2011) provide daily, monthly and yearly gold price data since 1975 until recent. The graph for gold price index from January 2000 to December 2011 is depicted in the Figure I.
Gold - London
PM
Fix 2000- present:1.900 181111 :1.780 1688 :1.580 11 14118
!! :1.380 61208 :1.180
; 1000
""
980~ 800
"'
=
780 6911it
580 480 380
280 &88B~~~~gg8~~~~~~~~~~~~~
<=- ~- ~- <=- ~ ... ::= ... <=- ~ ... ~ ... <=- <: - <: -
" " " " "' " " "
""
"'" " " " "
"'" " " " " " "
Figure 1: Daily gold price from January 2000 to December 2011 (Kitco, 2001)
This project is forecast daily gold price. Thus the daily gold price has been illustrate in Figure 2,3,4,5,6,7,8,9,10,11,12,and 13 respectively for daily gold price in year 2011
GOLD - London Fix - Janua.-y 2811 • AM
1440 -e-PM
1420
1400
•
"
"
c 1380"
"
1360'•
I-
•
"
...
+
Cl 1340
., =
13201300
1280. i ___ www.kitco.cOm
" " " " "
fij" " " " " " " " " "
"' "' "' "' "' "' "' "' "' "' "' "' "' "' ..
..., ..., ..., ..., ..., ..., ...,
...,
..., ..., ..., ..., ...,...,
..., ...,I I I I I I I I I I I I I I I I
,..,
"'
10 ,._"'
,..,"'
10 ,._"'
,..,"'
10 ,._"'
,..,<> <> <> 0 <> ,.., ,.., ,.., ,.., ,.., N N N N N
"'
Figure 2: Daily gold price from 1 January 2011 to 31 January 2011 (Kitco, 2001) Observed from the Figure 2, the gold prices for the month of January 2011 were decreasing. The highest price was 1388.5 USD per ounce which was on 4 January 2011. The lowest price was 1319 USD per ounce which was on 28 January 20lland the average price was 1356 USD per ounce.
1440 1420
"
1400"
c"
0 1380..
1L 1360Cl
.,
1340
= • •
1320 1300.
.<> .c
"' "'
....
....I I
s "'
0GOLD - London Fix - Feb.-ua.-y 2811 • AM -e-PM
•
•
www.kitc~.com
.c .<> .<> .<> .c -" -" .<> .c -" .Q .C.Q
"' "' "' "' "' "' "' "' "' "' "' "' "' ....
.... ........
........
.... ........
.... .... ...I I I I I I I I I I I I I
10 ,._
"' ,..,
\4 10 ,._"'
,..,"'
10 [::;~<> 0 0 ,.., ,..,
.... ....
N N NFigure 3: Daily gold price from 1 February 2011 to 28 February 2011 (Kitco, 2001)
Observed from the Figure 3, the gold prices for the month of February 2011 were increasing. The highest price was 1410.4 USD per ounce which was on 24 February 2011. The lowest was 1328 USD per ounce which was on 3 February 20lland the average price was 1356.4 USD per ounce.
GOLD - London fiH - Harch 2011 +AM
1460 -11-PM
1450
1440
•
"
" •
c 1430
•
::0
•
"
..
1420• • •
"
... • •
Cl 1410
"'
=
14001390
1380 '~ ~ww. ki
teo.
com'- '- '- '- '- '- '- '- '- '- '- '- '- '- '- '-
"' "' "' "' "' "' .. .. "' .. "' "' "' "' "' ..
"' "' "' "'
I I I I"'
I"' "' "' "' "' "' "'
I I I I I I I :E: I"' "'
I I"'
I.,..,
.., ..,
~ g) .,..,
~
.., ....
"'
.,.., r:l..,
1'-"'
.,..,0 0 0 .,.., .,.., .,.., .,.., N N N N
"'
Figure 4: Daily gold price from 1 March 2011 to 31 March 2011 (Kitco, 2001) Observed from the Figure 4, the gold prices for the month of March 2011 were not stable. The gold price was dropped in the middle of the month with the lowest price of the gold is 1400 USD per ounce which was on 15 March 2011. And then the gold price was increasing after that day until 24 Mach 2011 and the gold prices were dropped again on 26 March 2011 but in the end on the month gold price was increasing all most nearly the highest price of the month. The highest price of this month was 1447 USD per ounce which on 23 March 2011 and the average price was 1424.01 USD per ounce.
GOLD - London fiK - Rpril 2011 • AM
1560 ... PM
1540 1520
., "
c 1500" •
"
1480.. 8.
1460 .
•
=
1440., •
=
1420.1400'
1380 www.kitco.com
'- '- '- '- '- '-
a
'- '- '- '- '- '- '- '- '-0. 0. 0. 0. 0. 0. 0. 0. 0. 0. "- 0. 0. 0.0.
0: 0: 0: 0: 0: 0: 0: 0: 0: 0: 0: 0: 0: 0: 0:0:
I I I I I I I I I I I I I I I I
... .., "'
,.._ 0\... .., "' "
0\... .., "'
,.._ 0 \ 00 0 0 0 0
... ... ... ... ...
N N N N"'"'
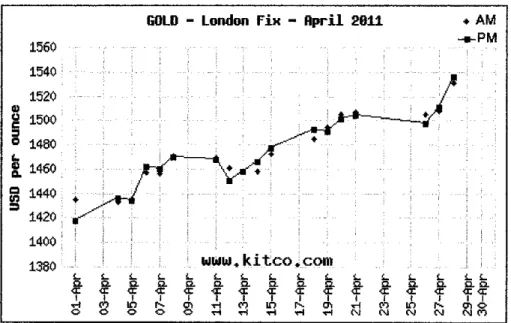
Figure 5: Daily gold price from I April2011 to 30 April2011 (Kitco, 2001) Observed from the Figure 5, the gold prices for the month of April 2011 were increasing from the beginning of the month until the end of the month. The highest price is 1535.5 USD per ounce which was on 28 April 2011. Therefore, the date of 29 and 30 April 2011 was holiday due to this reason the price are not provided. The lowest price was 1418 USD per ounce which was on 1 April 2011 and the average price was 1424.01 USD per ounce.
1560 1550 1540
.,
1530."
c
"
1520"
I; 1510 .
0.. 1500 .
~
1490:1480 1470 1460
"' "'
"'
I...
0•
"' "' "' "'
"' "'
I I.., "'
0 0
GOLD - London fiK - Hay 2011
• •
•
••
www
l
ki teo: •. com"' "' "' "' "' "' "' "' "' "' "'
>1!"' "' "' "' "' "'
"' "'
I I I"' "' "' "'
I I I I"' "'
I I,.._ 0\
... .., "'
,.._ 0\... ..,
0 0
... ... ... ... ...
N N•
"' "'
"' "'
"' "'
I I.,
,.._N N
+AM ... PM
"' ""
"' "'
:;;:
"'
I I
0\
...
N
..,
Figure 6: Daily gold price from 1 May 2011 to 31 May 2011 (Kitco, 2001) Observed from the Figure 6, the gold prices for the beginning of month for May
was1478.5 USD per ounce which was on 17 May 2011. However the prices were increasing subsequently until the end of month. The average price was 1510 USD per ounce.
GOLD - London Fix - June 2011 • AM
1560 ---PM
1550
•
1540
• •
"
"
c 1530
•
= " •
..
1520•
"
...
c 1510
"' ••
=
15001490
1480 www.kitco.com
"' "' "' "' "' "'
c"'
c c" "' "' "'
c"'" " " " " " " " " " " " " " " "
..., ..., ...., ..., ...., ..., ...., ..., ..., ..., ..., ..., ..., ..., ..., ...,
I I I I I I I I I I I I I I I I
,..,
"' .,
"' "'
,..,"' .,
"' "'
,..,"' "' "'
0 \ 00 0 0 0 0
.. .. .. .. ..
N N N N Nl'>Figure 7: Daily gold price from 1 June 2011 to 30 June 2011 (Kitco, 2001) Observed from the Figure 7, the highest price for the month of June 2011 was 1552.5 USD per ounce which was on 22 June 2011 and the lowest price was 1498 USD per ounce which was on 27 June 2011. The average price was 1528 USD per ounce.
GOLD - London Fix - July 2011 • AM
1660 ---PM
1640 1620
"
1600•
"
c
•
=
1580•
"
..
1560..
... 1540c
•
"'
1520= •
1500
• •
1480
1460 www .. kitco.com
:; :; :; :; ~ ~ ~ ~ ~ :; ~ ~ :; :; :; :;
" " " " " " "
..., ..., ..., ..., ..., ..., ...., ..., ..., ..., ..., ..., ..., ..., ..., ...,
I I I I I I I I I I I I I I I I
.. "' "' "' "'
,..,"' .,
"' "' ..
Kl"' "' "' ..
0 0 0 0 0
.. .. "" "" ""
N N N N"'
Figure 8: Daily gold price from 1 July 2011 to 29 July 2011 (Kitco, 2001)
Observed from the Figure 8, the gold prices for the month of July 2011 were increasing. The lowest price was 1483 USD per ounce which was on 1 July 2011. The highest price was 1628.5 USD per ounce which was on the end of the month (29 July 2011). The average price was 1572.81 USD per ounce.
GOLD - London FiK - August 2011 • AM
1920 -w-PM
1900 1880
1860 1840
•
"
1820•
"
c 1800• •
"'
0 1780• •
.. 1760
• •
" 1740
... 1720
•
..
1700' '.,
1680 i .=
1660 1640 1620 ~1600. www.kitco.com
1580
"' " .. .. " " " " "' .. .. " .. " .. " .. " " " " .. .. .. .. .. .. " " " "
'00<I: <I: <I: <I: <I: <I:
"' "' "' "' "' "'
<I: <I: <I:"'
I I I I I I I I I I I I I I I I
""
0"' "'
0 0 1'-0 0\ 0"" "' "" ""
~ 1'-... ...
0\""'
N"' "'
N N 1'-N g)"" "'
Figure 9: Daily gold price from I August 2011 to 31 August 2011 (Kitco, 200 I) Observed from the Figure 9, the highest gold price for the month of August 2011 was 1877.5 USD per ounce which was on 22 August 2011 and the lowest prices was 1623 ounce which was the beginning of the month ( 1 August 2011 ).
The average price was 1755.81 USD per ounce.
1920 1900 1880 1860 1840.
" 1820
"gc 1800 1780 1760 .. 1740
~ 1720 1700
lil
1680=
16601640 1620 1600 1580.
1560
GOLD - London FiK - Septenber 2011
• • • • •
• •
•
www.kitco.com
"' "' "' "' "' "' "' "' "'
"
~" " " " " " "
"'
I I"' "'
I I"' "' "' "'
I I I I"'
I1'- 0\
""' "' "' "'
0\""' "'
0 0
... ""' ""' ""' ...
N NQ.
"'
" "
"' "'
I Il(J r-. N
•
+AM -w-PM
"'"'
" "
"'"'
I I0 \ 0 N<'>
Observed from the Figure 10, the gold price for the month of September 2011 was decreasing the lowest price was 1598 USD per ounce which was nearly the end ofthe month (16 September 2011). However, the highest gold price of the year 2011 was this month with the price of 1895 USD per ounce which was on 6 September 2011 and the average price was 1771.88 USD per ounce.
GOLD - London Fix - October 2011 + AM
1780 ---PM
1760 1740
"
1720"
c
"
1700 +..
•
+..
1680"
... 1660
"' !!l
1640 +1620 1600!- 1580'
+> 0
0
... I
<:>
Figure 11: Daily gold price from 1 October 2011 to 31 October 2011 (Kitco, 2001) Observed from the Figure 11, the gold price for the month of October 2011 was a little bit increasing of the end of month. The highest price was 1741 USD per ounce which was on 28 October 2011. The lowest was 1617 USD per ounce which was on 5 October 2011 and the average price was 1665.21 USD per ounce.
GOLD - London FiH - Novenber 2811 +AM
:1.820 ~PM
:1.800 :1.780
" •
"
:1.760•
c • •
..
= i740.l
:1.720•
•..
:1.700 -•
..
:::>
1680 •
:1.660
1640 www .• __ ki teo. c<;>m
" " " " 1l " " " " 1l 1l " " " " "
" " ~ " " " " ~ 0 ~ ~ ~~
z z z z z z z z z z
' ' ,}, ' ' ' ~ ,}, "'- ' '
il il
~ ' '...
0 IS C> ""-C> "' C>... ... ... ... ...
"'...
N "' " ' C> "'Observed from the Figure 12, the highest gold price for the month of November 2011 was 1795 USD per ounce which was on 8 November 2011. The lowest price was 1682 USD per ounce which was on 23 November 2011 and the average price was 1738.98 USD per ounce.
GOLD - London FiH - Decenber 2811 • AM
1780 ... PM
1760
1740
•
"
1720..
1700 ..c
"
1680"
..
1660~ 1640.
•
..
1620 .., =
1600.•
1580'
•
1560.
1540 i www.kitco.com
0 0 0 0 0 0 0 0 0 0 0 0 0 0 0 0
., ., ., ., .,
i!l
" ., .,
" " " " " " "
"' "' "' "'
I I I I c I I c I c I c I c I c I c I c I c I c I c I...
0"' "'
0 0....
0"'
0... ... ... ... "' "' .... ... ... "' ...
N"' "'
N N .... N"'
N"' ...
Figure 13: Daily gold price from 1 December 2011 to 22 December 2011 (Kitco, 2001)
Observed from the Figure 13, the gold price for the month of December 2011 was drastically from the beginning of the month until the middle of the month.
The highest price was 1752 USD per ounce which was on 1 December 2011.
The lowest price was 1574 USD per ounce which was on 15 December 2011 and the average price was1664.97
2.4 Prediction method
Many of forecasting methods have been used for gold prices prediction in the past such as Multiple Linear Regression Method, Radial Basis function neural network, genetic algorithms, Back propagation, Multi layered feedforward, group method of data handling, moving data forecast (Ismail, et a!., 2009).
(Ismail, et al., 2009, Hussein, et al., 2009,Liu,2009, Varahrarni,2011) The descriptions of some of the methods are shown as follows:
Table!: Description of Prediction Methods
Method Description
Multiple Linear
•
The linear relationship between Regression response variable and one or more explanatory variables by appropriate a linear equation to observed data (Ismail, et al., 2009)Radial Basis function
•
A nourish forward three-layeredneural network network
•
Apposite to use in nonlinear time series forecasting (Hussein, et al., 2009) Back Propagation•
Consists of two parts: the input signal's network positive transmission and the errorsignal's back propagation
•
The input information is transmitted to the transmit system, if the output got error signal will finally return to the input (Liu,2009)Genetic algorithm
•
Optimize the parameters of coding according to certain fitness function and a series of genetic operation it screens individuals (Liu,2009)MLFF neural network
•
Interconnected in a feed forward way . Each neuron in one layer has directed connections to the neurons of the subsequent layer (V arahrarni, 2011) GMDH neural network•
Sets of neurons in which different pairsof them in each layer are connected through a quadratic polynomial and thus produce new neurons in the next layer (V arahrarni, 2011)
Artificial Neural
•
Has a natural property for storingavailable for use (Hung, eta!., 2008)
• Used to model complex relationships between inputs and outputs to find patterns in data (Haykin, 1998)
• An information processing paradigm that is inspired by the way biological nervous system (Dr.S.K.Dss, 2006)
Table I shows the description of some of the methods used for pnce forecasting. ANN is used to model complex relationships between inputs and outputs to fmd patterns in data as well as an information processing paradigm that is inspired by the way biological nervous system. Hence the methods that suitable for developing forecast tool is ANN method.
2.5 Artificial neural network
An Artificial Neural Network (ANN) is an information processing paradigm that is inspired by the way biological nervous systems, such as the brain, process information (Dr.S.K.Dss, 2006).The ANN consists of many artificial neurons. It is more or less duplicate brain neuron and it gets data from outside or other artificial neurons. It is use of easy operation, and output results to outside or other artificial neurons (NeuroAI, 2011)
Hold value
Input
Processing until net value
f
Connect weight
Transform function
Output
Figure 14: Artificial Neural Network Concept (NeuroAI, 2011)
array which can be anything such as data from an image file. Once an input is presented to the neural network, and a corresponding desired or target response is set at the output, an error is composed from the difference of the desired response and the real system output. (NeuroAI, 2011) and illustrates as below:
Process data
Figure 15: Simple ANN System Block Diagram 2.6 Network architecture
The basic architecture consists of three (3) types of neuron layers which is input, hidden, and output layers. In the Feedforward, networks with interconnections that do not perform any of loops, while recurrent or network at least one loops of interconnection are used with a cycles (Dr.S.K.Dss, 2006).
• Single layer feedforward network
Figure 16: Single Layer Feedforward Network Block Diagram
The Single Layer Feedforward Network consists of input layer and output layer.
Where the inputs are directly connect to the outputs, via a series of weights. The sum of the products of the weights and the inputs is calculated in each neuron node (NeuroAI, 2011).
• Multilayer feedforward network
Figure 17: Multilayer Feedforwark Network Block Diagram
The Multilayer Feedforward nework consists of input layer, output layer and one or more intermediary layers called hidden layer (NeuroAI, 2011 ).
• Recurrent networks
Figure 18: Recurrent Networks Block Diagram
The Recurrent networks differ from Single Layer Feedforward Network and Multilayer Feedforward Network architecture. A Recurrent networks has at least one feedback loop (NeuroAI, 2011 ).
The behavior of an ANN depends on both the weights and the input-output function (transfer function) that is specified for the units (NeuroAI, 2011). This function typically falls into one of three categories which are purelin, tansig and logsig.
Table 2: Description of Transfer Functions
Transfer functions Description
Purelin (Linear transfer function) Transfer functions calculate a layer's output from its net input (MarkWorks,
1984) .
Tansig (Hyperbolic tangent sigmoid transfer function)
Logsig(Log sigmoid transfer function)
•
a:::: purelin(nj
Linear Transfer Function
Figure 19: Linear transfer function
• Syntax
- A = purelin(N) - info = purelin( code)
Transfer functions calculate a layer's output from its net input (MarkWorks,
1984) .
•
a = tam>ig( n)
Tan-Sigmoid Transfer Function
Figure 20: Tan-Sigmoid transfer function
• Syntax
- A
=
tansig(N) - info = tansig( code)Transfer functions calculate a layer's output from its net input (MarkWorks, 1984).
a= /ogs!g(n)
O:J-Sicmoic -ransfer FJncti~n
Figure 21: Log-Sigmoid transfer function
• Syntax
- A = logsig(N) - info = logsig( code)
2. 7 Network Learning
The network learning is dividing in three different prototypes used to train neural network The three of different prototypes are supervised learning, unsupervised learning and reinforced learning.
• Supervised Learning
Every input pattern is used to train the network while learning process is based on comparison between network's computed output and the correct expected output and the error generate is used to change network parameters that result improved performance (Feedforward Neural Network, 2010).
• Unsupervised Learning
The expected or desired output is not presented the network as well as the system learns of its own by discovering and adapting to the structural features in the input patterns (Feedforward Neural Network, 2010).
• Reinforced Learning
The information proved helps the network in its learning process and reward is given for correct answer computed and penalty for a wrong answer
CHAPTER3 METHODOLOGY
3.1 Research methodology
Define Problem Statements
•
Search Journals, Articles, &
books according the problem
t
Perform Literature Review
t
Differential Forecasting Method
t
Perform Analysis
t
Propose Suitable Forecasting Method
Figure 22: Research Methodology Flow Chart
3.2 Procedure identification
Collect gold price data
Dividing into Training, Validation and Testing data
~
Assemble the training data
~
Assemble the validation data
~
Assemble the testing data
Simulate the data
No MAPE< 10%
Yes
Figure 23: Project's Methodology
3.2.1 Collect gold price data
The historical daily gold prices data have been gathered from 4th January 2005 until 14 December 2011.
3.2.2 Dividing into Training, Validation and Testing data
The gathered data has been partitioned into three (3) partitions for the purpose of training, validation and testing as follows:
1) Training data 2) Validation data 3) Testing data
The partition has been done based on the total data of 1745. The partitioning of the data is based on the non-randomization data that need to done to the historical data in order to obtain accurate result accept holiday and weekend.
For the weekend data has been done by average data.
3.2.3 Assemble the training data
The training data involves of the beginning of gathered data. The numbers of training data is depended on each model because different models are different number of training. Example of model 1, the training data is 40 percent thus the training number of this model is 698 data.
3.2.4 Assemble the validation data
The validation data involves of the middle of the gathered data. The numbers of validation data also depended on each model because different models are also different number of validation. Example of model 1, the validation data is 10 percent thus the validation number of this model is 175 data.
3.2.5 Assemble the testing data
The testing data involves of remaining from training data and validation data.
Example of model, the training data is 40 percent and validation is I 0 percent therefore the remaining data is 50 percent as a result the testing data is 872 data
3.2.6 MAPE
MAPE or Mean Absolute Percentage Error is calculated once the forecasting gold prices obtained. The program will compare the actual gold prices with forecast gold prices and the errors have been calculated base on the following formula:
Where,
Where,
RE = Fg-Ag X 100%
Ag
RE is Relative Error F g is Forecast gold price Ag is Actual gold price
... (1)
Absolute Relative Error =
I
REI ... (2) MAPE = 1:1REIN
MAPE is Mean Absolute Percentage Error RE is Relative Error
N is the number of trail
... (3)
3.3 Project duration
A Gantt chart is one of the tools that monitor the progress of the project. The Gantt chart consist of one year duration planning had been construct.
Table 3: Gantt Chart for Final Year Project I FINAL YEAR PROJECT I
ACTIVITIES 1 2 3 4 5 6 7 8 9 10 11 12 Plan
Topic selection Actual
Search Plan
information Actual Study on Plan research Actual Literature Plan
review Actual
Extended Plan
proposal Actual Proposal Plan defence Actual Draft interim Plan
report Actual
Plan
Interim report Actual -
13 14 15 16
..:..:
~ ~
~
=
Q::: ell
· = -
,.::,11
~
e
~
=
~ ~
;;....
"0 -;
= =
-
~00
17 :
..:.:
~ t
=
:.c Q ell
=
·a
ell~
r;ail
-;
=
~
- - -
• Plane
D
Actual*
Key MilestoneACTIVITIES Gather gold prices data
Study and analyze data
Design the forecast method
Forecast and Simulation
Result and conclusion
Dissertation Submission of Technical oaoer Oral Presentation Submission ofProject Dissertation
Table 4: Gantt Chart for Final Year Project II
I
Actual PlanActual Actual Plan
A.,..t-.,~::tol
14 I 15 I 16 I 17
..:.1: ..:.1:
$ $
~ ~
= =
~ ::::: Q
~ ~
= =
·a ·- a
• Plane~ ~
loC loC
D
Actuallilil lilil
-; -;
= = i;?
Key Milestone·-
~ fi:3.4 Project activities
The project activities for this project are;
• Reading and research about the gold prices and the method of prices forecasting
• Study the method of forecasting for apply and develop method for this project.
• Compare different method of each journals, research papers and articles for forecasting method
• Designing and developing method for prices forecasting
3.5 Key milestone
Table 5: Key Milestone
Milestone Plane timescale progress
Literature review Week 5 of Semester I COMPLETE Extended proposal Week 5 of Semester I COMPLETE Draft interim report Week 14 of Semester 1 COMPLETE Interim report Week 5 of Semester I COMPLETE Forecast and Simulation Week 7 of Semester 2 COMPLETE Result and conclusion Week 8 of Semester 2 COMPLETE Progress report Week 11 of Semester 2 COMPLETE Electrex Presentation Week 13 ofSemester2 COMPLETE Draft dissertation report Week 13 ofSemester2 COMPLETE Dissertation Week 14 of Semester 2 COMPLETE Technical paper Week 14 of Semester 2 COMPLETE Oral Presentation Week 15 of Semester 2 COMPLETE Submit Project Dissertation Week 16 of Semester 2 COMPLETE 3.6 Tool required
This project will use MATLAB software as the main tool for the gold forecast model. It is more performing vector and matrix calculations therefore MATLAB
CHAPTER4
RESULTS AND DISCUSSION
4.1 Results
The following content illustrate the gold price prediction using Neural Network.
The project is using 3 layer feedforwark network and the number of neurons in the each hidden layer for the model is 9 and the transfer function for the model are Purelin for the input, Purelin for the output and Trainlm for the training. The input data is the previous data with the number of 1745 and data partitioning for each of the models has been shown in the table 6.
Table 6: Data Partitioning Data Partitioning
Model Training Data Validation Data Testing Data
Modell 40% 10% 50%
Model2 40% 30% 30%
Model3 40% 40% 20%
Model4 40% 50% 10%
ModelS 50% 10% 40%
Mode16 50% 20% 30%
Model 7 50% 30% 20%
ModelS 50% 40% 10%
Model9 60% 10% 30%
Model!O 60% 20% 20%
Modell! 60% 30% 10%
Model12 70% 10% 20%
Model13 70% 20% 10%
Table 7: Data Partitioning 40 percent for training data, 10 percent for validation data and 50 percent for testing data
14-Dec-11 13-Dec-11 12-Dec-11 9-Dec-11 8-Dec-11 MAPE
Trial Actual Forecast Actual Forecast Actual Forecast Actual Forecast Actual Forecast % I 1603 1611.8 1672.5 1671.3 1659.5 1665.9 1709 1710 1715 1717.8 0.1351
2 1603 1598 1672.5 1666 1659.5 1654.1 1709 1702.8 1715 1709.1 0.5192
3 1603 1602.7 1672.5 1671.9 1659.5 1659.2 1709 1708.5 1715 1714.6 0.0569 4 1603 1601.6 1672.5 1671.1 1659.5 1658.1 1709 1707.6 1715 1713.6 0.1184 5 1603 1600.1 1672.5 1669.2 1659.5 1656.5 1709 1705.8 1715 1711.8 0.2616 6 1603 1604.6 1672.5 1673.5 1659.5 1660.9 1709 1710.1 1715 1716.2 0.1104
7 1603 1602.2 1672.5 1671.4 1659.5 1658.6 1709 1708 1715 1714 0.0942
8 1603 1603 1672.5 1672.1 1659.5 1659.4 1709 1708.7 1715 1714.8 0.0386 9 1603 1603.6 1672.5 1680 1659.5 1661.7 1709 1714.9 1715 1719.6 0.6143 10 1603 1623.2 1672.5 1692.9 1659.5 1679.9 1709 1729.6 1715 1735.6 1.5634 11 1603 1603.1 1672.5 1672.5 1659.5 1659.5 1709 1709 1715 1715 3.00E-03 12 1603 1588.8 1672.5 1657.5 1659.5 1645.1 1709 1694.1 1715 1700.3 1.2242
13 1603 1598.6 1672.5 1669 1659.5 1655.3 1709 1705.2 1715 1711 0.2107
14 1603 1604.5 1672.5 1674 1659.5 1661 1709 1710.5 1715 1716.5 0.1322
15 1603 1602.3 1672.5 1672.4 1659.5 1659 1709 1708.8 1715 1714.7 0.0248 Average 1603 1603.207 1672.5 1672.32 1659.5 1659.613 1709 1708.907 1715 1714.973 0.340467
According to table 7, the daily gold price for 17 45 days is used. The price of the first 698 days is used for training, the price of the next 175 days is used for validation and the remaining 872 days is used for training. The average of MAPE is 0.340467 percent.
Table 8: Data Partitioning 40 percent for training data, 30 percent for validation data and 30 percent for testing data
14-Dec-11 13-Dec-11 12-Dec-11 9-Dec-11 8-Dec-11 MAPE
Trial Actual Forecast Actual Forecast Actual Forecast Actual Forecast Actual Forecast % 1 1603 1611.8 1672.5 1671.3 1659.5 1665.9 1709 1710 1715 1717.8 0.1184
2 1603 1598 1672.5 1666 1659.5 1654.1 1709 1702.8 1715 1709.1 0.4869 :
3 1603 1602.7 1672.5 1671.9 1659.5 1659.2 1709 1708.5 1715 1714.6 0.0513 4 1603 1601.6 1672.5 1671.1 1659.5 1658.1 1709 1707.6 1715 1713.6 0.1103 5 1603 1600.1 1672.5 1669.2 1659.5 1656.5 1709 1705.8 1715 1711.8 0.2461 6 1603 1604.6 1672.5 1673.5 1659.5 1660.9 1709 1710.1 1715 1716.2 0.1
7 1603 1602.2 1672.5 1671.4 1659.5 1658.6 1709 1708 1715 1714 0.0871
8 1603 1603 1672.5 1672.1 1659.5 1659.4 1709 1708.7 1715 1714.8 0.035
9 1603 1603.6 1672.5 1680 1659.5 1661.7 1709 1714.9 1715 1719.6 0.5641 10 1603 1623.2 1672.5 1692.9 1659.5 1679.9 1709 1729.6 1715 1735.6 1.4848 11 1603 1603.1 1672.5 1672.5 1659.5 1659.5 1709 1709 1715 1715 2.70E-03 12 1603 1588.8 1672.5 1657.5 1659.5 1645.1 1709 1694.1 1715 1700.3 1.1479
13 1603 1598.6 1672.5 1669 1659.5 1655.3 1709 1705.2 1715 1711 0.2119
14 1603 1604.5 1672.5 1674 1659.5 1661 1709 1710.5 1715 1716.5 0.1227
15 1603 1602.3 1672.5 1672.4 1659.5 1659 1709 1708.8 1715 1714.7 0.0219 Average 1603 1603.207 1672.5 1672.32 1659.5 1659.613 1709 1708.907 1715 1714.973 0.319407
According to table 8, the daily gold price for 1745 days is used. The price of the first 698 days is used for training, the price of the next 524 days is used for validation and the remaining 523 days is used for training. The average of MAPE is 0.319407 percent.
Table 9: Data Partitioning 40 percent for training data, 40 percent for validation data and 20 percent for testing data
14-Dec-11 13-Dec-11 12-Dec-11 9-Dec-11 8-Dec-11 MAPE
Trial Actual Forecast Actual Forecast Actual Forecast Actual Forecast Actual Forecast % 1 1603 1611.8 1672.5 1671.3 1659.5 1665.9 1709 1710 1715 1717.8 0.1132
2 1603 1598 1672.5 1666 1659.5 1654.1 1709 1702.8 1715 1709.1 0.4256
3 1603 1602.7 1672.5 1671.9 1659.5 1659.2 1709 1708.5 1715 1714.6 0.040713 4 1603 1601.6 1672.5 1671.1 1659.5 1658.1 1709 1707.6 1715 1713.6 0.09496 5 1603 1600.1 1672.5 1669.2 1659.5 1656.5 1709 1705.8 1715 1711.8 0.2168 6 1603 1604.6 1672.5 1673.5 1659.5 1660.9 1709 1710.1 1715 1716.2 0.0805
7 1603 1602.2 1672.5 1671.4 1659.5 1658.6 1709 1708 1715 1714 0.0735
8 1603 1603 1672.5 1672.1 1659.5 1659.4 1709 1708.7 1715 1714.8 0.0279 9 1603 1603.6 1672.5 1680 1659.5 1661.7 1709 1714.9 1715 1719.6 0.4673 10 1603 1623.2 1672.5 1692.9 1659.5 1679.9 1709 1729.6 1715 1735.6 1.3368 11 1603 1603.1 1672.5 1672.5 1659.5 1659.5 1709 1709 1715 1715 2.40E-03 12 1603 1588.8 1672.5 1657.5 1659.5 1645.1 1709 1694.1 1715 1700.3 1.004
13 1603 1598.6 1672.5 1669 1659.5 1655.3 1709 1705.2 1715 1711 0.2145
14 1603 1604.5 1672.5 1674 1659.5 1661 1709 1710.5 1715 1716.5 0.1049
15 1603 1602.3 1672.5 1672.4 1659.5 1659 1709 1708.8 1715 1714.7 0.2145 Average 1603 16~0~07. 1672.5 1672.32 1659.5 - - - - 1659.613 1709 1708.907 1715 1714.973 0.294505
According to table 9, the daily gold price for 1745 days is used. The price of the first 698 days is used for training, the price of the next 698 days is used for validation and the remaining 349 days is used for training. The average of MAPE is 0.294505percent.
Table 10: Data Partitioning 40 percent for training data, 50 percent for validation data and 10 percent for testing data
14-Dec-11 13-Dec-11 12-Dec-11 9-Dec-11 8-Dec-11 MAPE
Trial Actual Forecast Actual Forecast Actual Forecast Actual Forecast Actual Forecast % I 1603 1611.8 1672.5 1671.3 1659.5 1665.9 1709 1710 1715 1717.8 0.1306
2 1603 1598 1672.5 1666 1659.5 1654.1 1709 1702.8 1715 1709.1 0.3844
3 1603 1602.7 1672.5 1671.9 1659.5 1659.2 1709 1708.5 1715 1714.6 0.0336 4 1603 1601.6 1672.5 1671.1 1659.5 1658.1 1709 1707.6 1715 1713.6 0.0847 5 1603 1600.1 1672.5 1669.2 1659.5 1656.5 1709 1705.8 1715 1711.8 0.197 6 1603 1604.6 1672.5 1673.5 1659.5 1660.9 1709 1710.1 1715 1716.2 0.0675
7 1603 1602.2 1672.5 1671.4 1659.5 1658.6 1709 1708 1715 1714 0.0644
8 1603 1603 1672.5 1672.1 1659.5 1659.4 1709 1708.7 1715 1714.8 0.0234 9 1603 1603.6 1672.5 1680 1659.5 1661.7 1709 1714.9 1715 1719.6 0.4032 10 1603 1623.2 1672.5 1692.9 1659.5 1679.9 1709 1729.6 1715 1735.6 1.2374 11 1603 1603.1 1672.5 1672.5 1659.5 1659.5 1709 1709 1715 1715 2.10E-03 12 1603 1588.8 1672.5 1657.5 1659.5 1645.1 1709 1694.1 1715 1700.3 0.9073
13 1603 1598.6 1672.5 1669 1659.5 1655.3 1709 1705.2 1715 1711 0.2164
14 1603 1604.5 1672.5 1674 1659.5 1661 1709 1710.5 1715 1716.5 0.0928
15 1603 1602.3 1672.5 1672.4 1659.5 1659 1709 1708.8 1715 1714.7 0.0136 Av_erage 1603 ... 1603.207 1672.5 1672.32. '1659.5 1659.613 1709 1708.907 1715 1714.973 0.257227
According to table 10, the daily gold price for 1745 days is used. The price of the first 698 days is used for training, the price of the next 873 days is used for validation and the remaining 174 days is used for training. The average of MAPE is 0.257227 percent.
Table II: Data Partitioning 50 percent for training data, I 0 percent for validation data and 40 percent for testing data
14-Dec-11 13-Dec-11 12-Dec-11 9-Dec-11 8-Dec-11 MAPE
Trial Actual Forecast Actual Forecast Actual Forecast Actual Forecast Actual Forecast 0/o I 1603 160.8 1672.5 1671.8 1659.5 1663.3 1709 1709.7 1715 1716.7 0.0814 2 1603 1602.6 1672.5 1671.4 1659.5 1658.9 1709 1708.1 1715 1714.2 0.0729 3 1603 1603.4 1672.5 1672.8 1659.5 1659.9 1709 1709.4 1715 1715.4 0.021
4 1603 1602.5 1672.5 1672 1659.5 1659 1709 1708.5 1715 1714.5 0.0395
5 1603 1601.5 1672.5 1670.8 1659.5 1657.9 1709 1707.3 1715 1713.4 0.1246 6 1603 1604.2 1672.5 1673.5 1659.5 1660.7 1709 1710.1 1715 1716.1 0.0989 7 1603 1602.3 1672.5 16717 1659.5 1658.8 1709 1708.3 1715 1714.3 0.0611 8 1603 1602.8 1672.5 1672.1 1659.5 1659.2 1709 1708.7 1715 1714.7 0.0327 9 1603 1607.8 1672.5 1681.8 1659.5 1665.3 1709 1717.1 1715 1722.3 0.7336 10 1603 1617.3 1672.5 1686.9 1659.5 1673.9 1709 1723.5 1715 1729.5 1.0579
11 1603 1603 1672.5 1672.5 1659.5 1659.5 1709 1709 1715 1715 1.70E-03
12 1603 1589.1 1672.5 1658.4 1659.5 1645.5 1709 1694.9 1715 1700.9 1.0837 13 1603 1603.9 1672.5 1673.8 1659.5 1660.5 1709 1710.3 1715 1716.2 0.0793 14 1603 1603.2 1672.5 1672.8 1659.5 1659.7 1709 1709.2 1715 1715.2 0.0197 15 1603 1602.5 1672.5 1672.2 1659.5 1659.1 1709 1708.7 1715 1714.6 0.0262 Average 1603 1507.127 1672.5 2675.987 1659.5 1660.08 1709 1709.52 1715 1715.533 0.235613
According to table 11, the daily gold price for 1745 days is used. The price of the first 873 days is used for training, the price of the next 174 days is used for validation and the remaining 698 days is used for training. The average of MAPE is 0.235613 percent.
Table 12: Data Partitioning 50 percent for training data, 20 percent for validation data and 30 percent for testing data
14-Dec-11 13-Dec-11 12-Dec-11 9-Dec-11 8-Dec-11 MAPE
Trial Actual Forecast Actual Forecast Actual Forecast Actual Forecast Actual Forecast % 1 1603 1608.3 1672.5 1671.8 1659.5 1663.3 1709 1709.7 1715 1716.7 0.0742 2 1603 1602.6 1672.5 1671.4 1659.5 1658.9 1709 1708.1 1715 1714.2 0.0687 3 1603 1603.4 1672.5 1672.8 1659.5 1659.9 1709 1709.4 1715 1715.4 0.0212
4 1603 1602.5 1672.5 1672 1659.5 1659 1709 1708.5 1715 1714.5 0.0364
5 1603 1601.5 1672.5 1670.8 1659.5 1657.9 1709 1707.3 1715 1713.4 0.1165 6 1603 1604.2 1672.5 1673.5 1659.5 1660.7 1709 1710.1 1715 1716.1 0.0876 7 1603 1602.3 1672.5 16717 1659.5 1658.8 1709 1708.3 1715 1714.3 0.0557 8 1603 1602.8 1672.5 1672.1 1659.