I would like to take this opportunity to express my sincere appreciation to everyone who has greatly assisted me in achieving the goal of this study. In addition, I would like to thank my family and friends for their support and tolerance, which enabled me to conduct this research and successfully complete my dissertation. The title of this study is “The Impact of Social Media Marketing on Consumer Loyalty: A Study of Generations X and Y”.
This study aims to identify the factors that influence consumer loyalty in social media marketing between Gen X and Y. As a consequence, the researcher conducted this study to investigate the factors that influence consumer loyalty in Generation X and Y. The purpose of this study is to investigate the impact of social media marketing (SMM) on consumer loyalty between generation X and Y via customer equity drivers (CED).
On the other hand, this study will help marketers increase consumer loyalty to Generation X and Y by examining SMM.
RESEARCH OVERVIEW
- Introduction
- Research Background
- Social Media Marketing
- Consumer Loyalty
- Problem Statement
- Research Questions
- Research Objectives
- General Objective
- Specific Objectives
- Scope of the Study
- Research Significance
- Chapter Layout
- Conclusion
With such a good background, the purpose of this study is to address a vacuum in the literature on the effect of social media marketing on consumer loyalty, a study on Generation X and Y. Currently, social media is an Internet communication medium that has had a significant impact on the world (Dân & Nam, 2018). In addition, about 42% of users use social media to reach different products and services (Bedgood, 2021).
It is critical to research social media marketing and its impact on customer loyalty as social media is constantly trendy due to its interactivity and ability to build relationships. Is there a relationship between brand value and customer loyalty in generations X and Y. f) Is there a relationship between relationship value and customer loyalty in generations X and Y. The main objective of this study is to identify the impact of social media marketing on consumer loyalty in generations X and Y . a). The overall survey focuses on Malaysian Generation X and Y consumers who own at least one social media account.
As a result, policy makers are able to develop policies and regulate activities in social media marketing.
LITERATURE REVIEW
- Underlying Theory
- Review of Variables
- Word-of-Mount (WOM)
- Interactivity
- Personalization
- Value Equity
- Brand Equity
- Relationship Equity
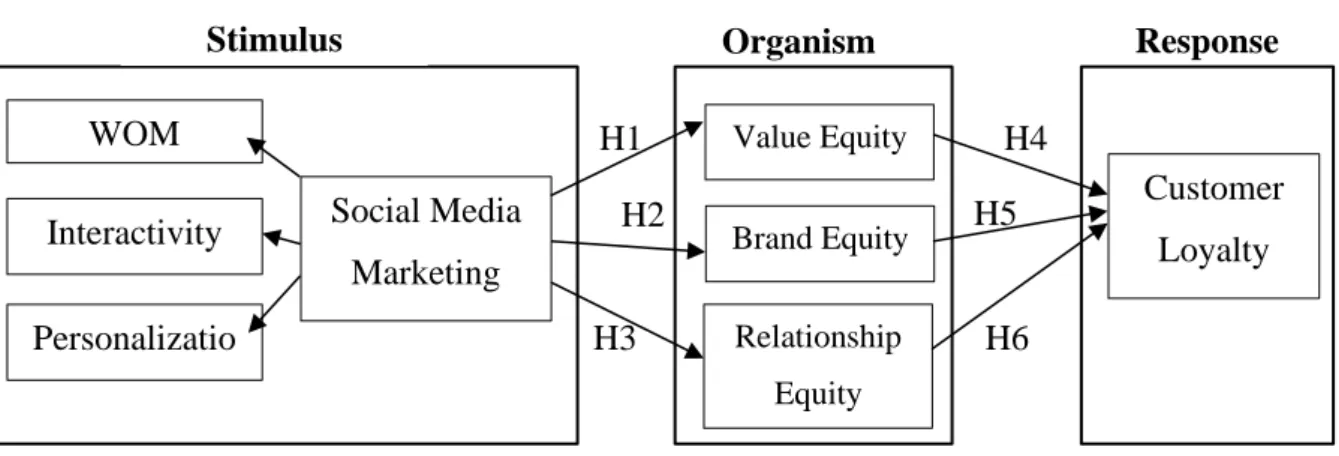
- Proposed Conceptual Framework
- Hypotheses Development
- The relationship between SMM and value equity
- The relationship between SMM and brand equity
- The relationship between SMM and relationship equity
- The relationship between value equity and customer loyalty
- The relationship between brand equity and customer loyalty
- The relationship between relationship equity and customer loyalty 19
- Introduction
- Research Design
- Quantitative Research
- Data Collection Method
- Primary Data
- Sampling Design
- Target Population
- Sampling Frame and Sampling Location
- Sampling Element
- Sampling Technique
- Sample Size
- Research Instrument
- Questionnaire Design
- Pilot Test
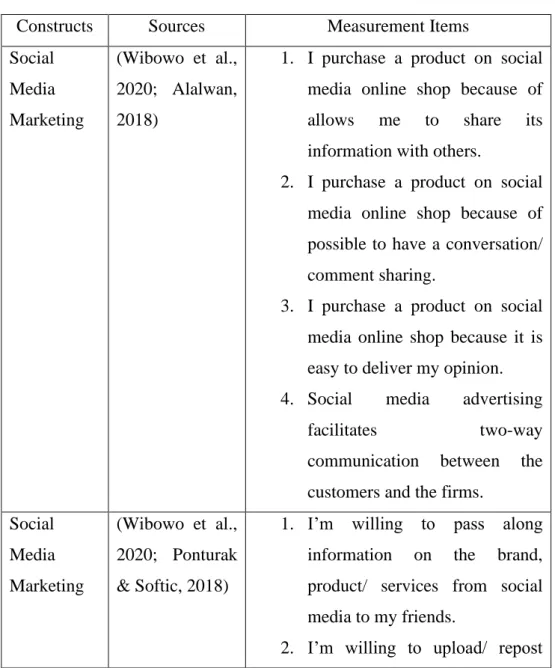
- Construct Measurement
- Origin of Construct
- Scale of Measurement
- Data Processing
- Data Checking
- Data Editing
- Data Coding
- Data Transcribing
- Data Analysis
- Jamovi System
- Descriptive Analysis
- Reliability Analysis
- Inferential Analysis
- Conclusion
This research covered five chapters, which included research review, literature review, methodology, data analysis, discussion and conclusion.
DATA ANALYSIS
Introduction
The data analysis discussed in this chapter, as well as the data obtained from the 200 questionnaires. All the findings are presented in tables and graphs, and a summary of the hypothesis will be presented at the end of this chapter.
Descriptive Analysis
- Demographic Profile of Respondents
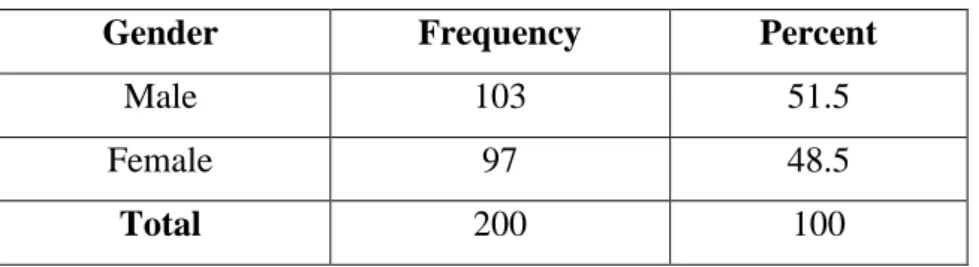
- Gender
- Age
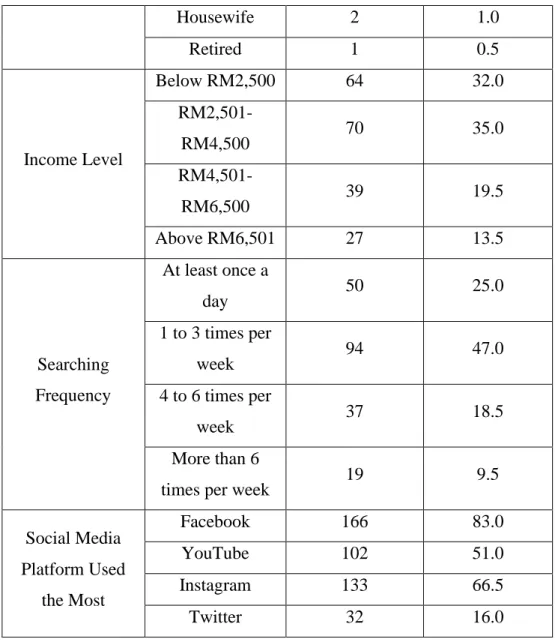
- Occupation Status
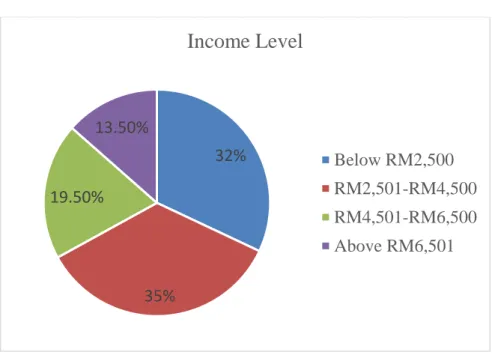
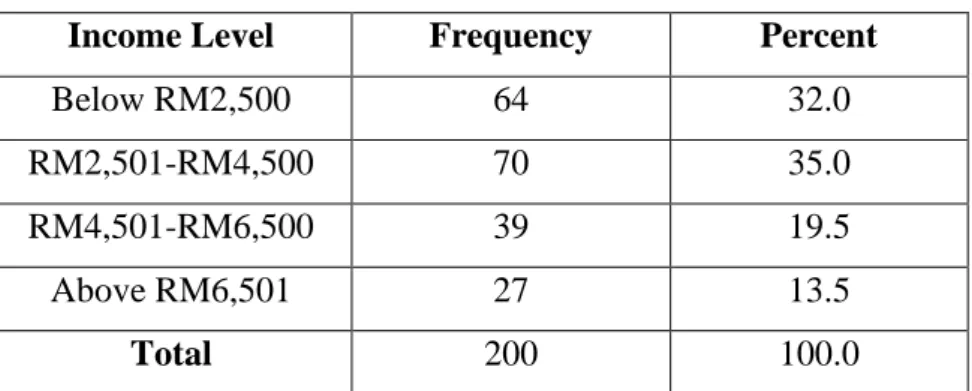
- Income Level
- Searching Frequency
- Social Media Platform Used the Most
- Central Tendencies Measurement of Constructs
- Consumer Loyalty (Dependent Variable)
- Interactivity (Independent Variable)
- Word-Of-Mouth (WOM) (Independent Variable)
- Personalization (Independent Variable)
- Value Equity (Independent Variable)
- Brand Equity (Independent Variable)
- Relationship Equity (Independent Variable)
Table 4.7 shows the value of mean, standard deviation, skewness and kurtosis for 5 customer loyalty items. CSL1 has the highest mean value of 4.33, while CSL3 has the lowest mean value of 4.17 in total items. Among the 5 items, CSL1 has the highest standard deviation of 0.795, while CSL2 has the lowest standard deviation of 0.725.
Table 4.8 shows the value of mean, standard deviation, skewness and kurtosis for 4 items of interactivity. Table 4.9 showed the value of mean, standard deviation, skewness and kurtosis for 4 word-of-mouth (WOM) topics. Table 4.10 shows the value of mean, standard deviation, skewness and kurtosis for 4 personal fits.
In addition, PER4 with a value of 0.893 has the largest standard deviation, while PER3 with a value of 0.740 has the lowest. Table 4.11 shows the value of mean, standard deviation, skewness, and kurtosis for five items of value equity. Table 4.12 shows the value of mean, standard deviation, skewness, and kurtosis for four brand equity items.
The BRE1 has the largest mean value of 4.26, while BRE4 has the lowest mean value of 4.16 in the total items. Among the 4 items, BRE4 has the largest standard deviation of 0.811, while BRE1 has the lowest standard deviation of 0.718. The Table 4.13 showed the value of mean, standard deviation, skewness and kurtosis for 5 items of relational fairness.
RLE5 has the highest mean of 4.09 while RLE3 has the lowest mean of 4.00 in total items. Among the 5 items, RLE2 and RLE3 have the largest standard deviation of 0.871, while RLE5 has the smallest standard deviation of 0.824.
Scale Measurement
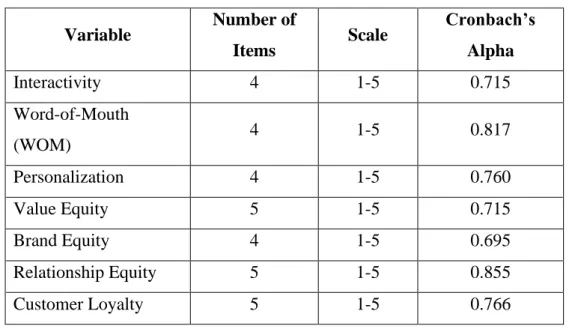
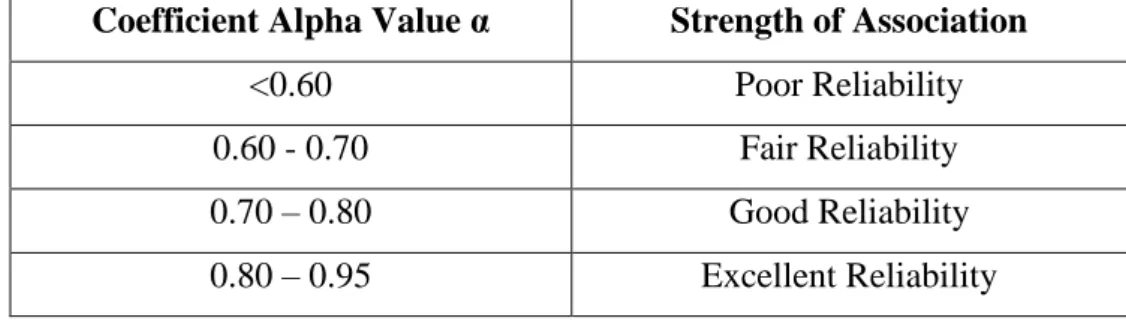
- Reliability Test
Pearson Correlation Analysis
Moreover, it has shown that the relationship between all the independent variables and dependent variables are statically significant, despite being positively related. According to Table 4.15, Value Equity has the highest correlation (0.549) with Consumer Loyalty among all the variables, indicating that there is a significant positive relationship between Value Equity and Consumer Loyalty. Furthermore, Relationship Equity has the second largest positive relationship with Consumer Loyalty with a value of 0.522.
Next, Personalization is the third strongest positive relationship with Consumer Loyalty with a value of 0.499, followed by Interactivity at 0.454 and Brand Equity at 0.451. On the other hand, WOM has the lowest correlation with Consumer Loyalty with a value of 0.376 among all the variables.
Testing of Hypothesis
- Correlation Analysis
Conclusion
DISCUSSIONS, CONCLUSIONS, AND IMPLICATIONS
Introduction
Summary of Statistical Analysis
- Descriptive Analysis
- Scales of Measurement
- Inferential Analysis
- Pearson Correlation Coefficient
- Multiple Regression Analysis
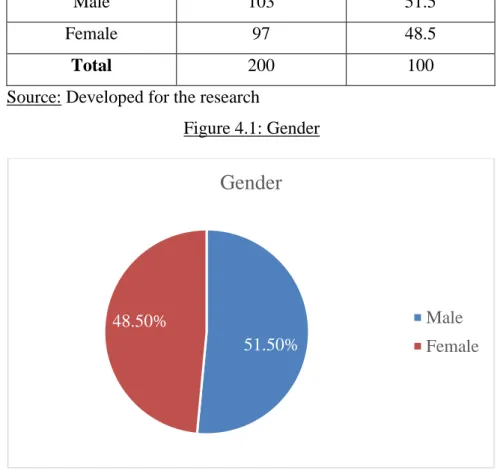
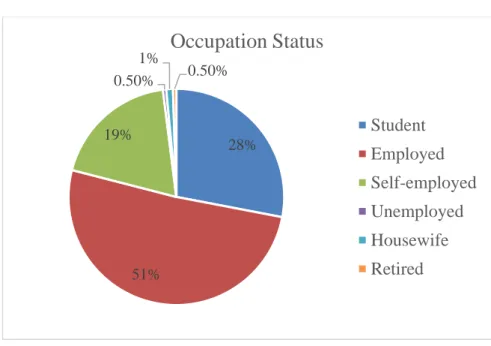
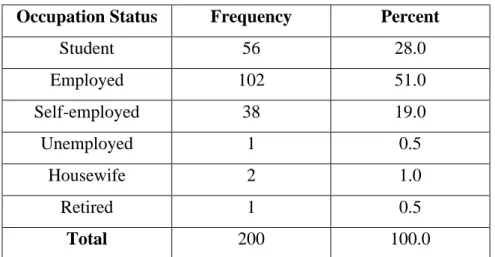
There are 103 men and 97 women among the respondents, which is 51.5% and 48.5% of the sample, respectively. In addition, the majority of respondents are employed with 51%, namely 102 respondents are employed, and 56 (28%) respondents are students. However, housewives, unemployed and retired are in the minority in the answers, housewives are 2 (1%) and unemployed and retired only 1 (0.5%) respondents.
Apart from that, 94 (47%) respondents search for product or brand information on social media 1 to 3 times a week, while 50 (25%) of respondents search at least once a day. In addition, there are respondents who search at least 4 to 6 times for product or brand information on social media per week, and 19 (9.5%) of the respondents search for product and brand information on social media more than 6 times per week. Finally, Facebook and Instagram are the most popular channels that respondents used to search for product or brand information, which are 166 (83%) and respondents respectively.
In addition, there are 102 (51%) and 32 (16%) respondents who seek product or brand information through YouTube and Twitter. Pearson Correlation analyzed the relationship between independent variables (Interactivity, WOM, Personalization, Value Equity, Brand Equity, Relationship Equity) and dependent variable (Consumer Loyalty). Value Equity has the highest correlation (0.549) with Customer Loyalty, followed by Relationship Equity and Customer Loyalty with a value of 0.522, Personalization and Customer Loyalty is 0.499, Interactivity at 0.454 and Brand Equity 0.451.
Multiple regression analysis was used to identify the relationship between the independent variables (Interactivity, WOM, Personalization, Value Attribute, Brand Attribute, Relationship Attribute) and the dependent variable (Consumer Loyalty). The p-value of interactivity, WOM, and personalization for equity is less than 0.05, and the R square is 0.314, which is greater than 0.2. In addition, the p-value of interactivity, WOM, and personalization for brand value is less than 0.05, and the R square is 0.291, which is more than 0.2.
Further, the p-value of interactivity, WOM and personalization in Relationship Equity is less than 0.05 and R-square is 0.328 which is greater than 0.2. Moreover, the p-value of value equity, brand equity and relationship equity with customer loyalty is less than 0.05 and R square is 0.430 which is greater than 0.2.
Discussion of Major Finding
- Relationship between SMM and Value Equity
- Relationship between SMM and Brand Equity
- Relationship between SMM and Relationship Equity
- Relationship between Value Equity and Consumer Loyalty
- Relationship between Brand Equity and Consumer Loyalty
- Relationship between Relationship Equity and Consumer Loyalty 62
H1: There is a positive relationship between SMM and Value Equity According to Table 5.3, the finding shows that the p-value of SMM is less than 0.001 (<0.001) and the t-value is and 3.519 respectively, which indicates that SMM has a positive relationship with value capital. Moreover, the result is similar to Al-alak (2014), where the study confirmed that SMM has a positive impact on the equality of relationships. Empirical research has confirmed the beneficial relationship between SMM and relationship equity (Kim & Ko, 2012).
Table 5.3 shows that the p-value is less than 0.001 and the t-value is 4.89, which indicates that value capital and customer loyalty have a positive relationship. The finding is consistent with previous research by Dwivedi et al., (2012), which showed that value capital is strongly related to customer loyalty, because when a company offers greater benefits to customers compared to competitive alternatives, it leads to an increase in customer loyalty. The outcome is similar to the study by Bolton et al., (2004), where they found that customer loyalty is influenced by their perception of the brand.
According to Table 5.3, the result shows that the p-value is less than 0.001 and the t-value is 5.50, which indicated that Relationship Equity and Consumer Loyalty have a positive relationship. The finding is consistent with previous research by Gustafsson et al., (2005), which showed that relationship similarity and consumer loyalty have a significant relationship, as customer loyalty is predicted to improve as relationship similarity strengthens. Furthermore, the study by Ou et al., (2014) has confirmed that there is a strong relationship between relationship equity and customer loyalty.
As a company seeks to increase customer loyalty in order to retain current customers and attract new potential customers. The results of this study will help to achieve this goal and customer loyalty can be improved by focusing on an affective SMM that includes all three main components. Based on the favorable impact of all CED on customer loyalty in this study, especially relationship equity and value equity, managers should cultivate strong and cordial relationships with customers, using the power of SMM by providing also a tremendous value to customers.
Therefore, in this study the impact of SMM on the relationship variables customer loyalty was investigated. Apart from that, there is also a lack of research in the Malaysian context that examines the impact of SMM on customer loyalty.
Limitation of the Study
Recommendation of Study
Conclusion
Role of social media marketing to enhance CRM and brand equity in terms of purchase intention. The Impact of Social Media Marketing Medium on Purchase Intention and Brand Loyalty among Generation Y. The Impact of Perception-Related Social Media Marketing Applications on Consumers' Brand Loyalty and Purchase Intention.
Understanding the effect of social media marketing activities: the mediation of social identification, perceived value and satisfaction. The role of trust in understanding the impact of social media marketing on brand equity and brand loyalty. The influence of perceived social media marketing activities on brand loyalty. The mediation effect of brand and value awareness.
Impact of social media marketing on purchase intention and brand loyalty: Evidence from Indonesia's banking sector. Customer behavior as a result of social media marketing: The role of social media marketing activity and customer experience. I am currently working on a study entitled "The impact of social media marketing on consumer loyalty: A study on Gen X and Y".
I enjoy spreading the positive word about brands, products and services to my family through social media.