Page Figure 1.1: Number of IPOs in the USA from 2001 to 2020 5 Figure 2.1: Proposed theoretical framework for the relationship between. This helps students improve their understanding of the relationship between macroeconomic variables and the number of IPOs. Therefore, the idea of this topic came from the limited research that focused on the number of IPOs and macroeconomic factors.
Finally, this research will contribute to IPO stakeholders by providing them with a better understanding of the relationship between the number of IPOs and macroeconomic variables. This study is being conducted to measure the relationship between macroeconomic variables and the number of IPOs in the United States from the period of 2001 Quarter 1 to 2020 Quarter 4, which total up to 80 observations. To study the relationship between the independent variables and the number of US IPOs, we performed several statistical tests using E-Views 12.
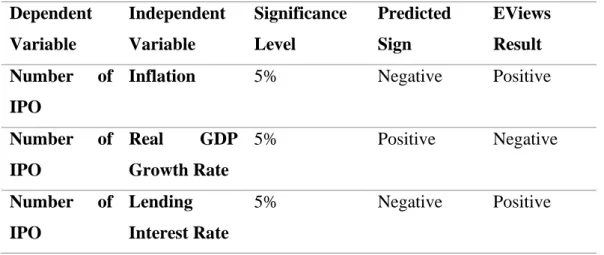
The result showed that inflation and lending rates have a positive relationship with the number of IPOs in the USA.
RESEARCH OVERVIEW
- Introduction
- Research Background
- Introduction of Initial Public Offering
- Benefits and Challenges to Become a Listed Company
- Reasons for the Company to be Listed in the U.S
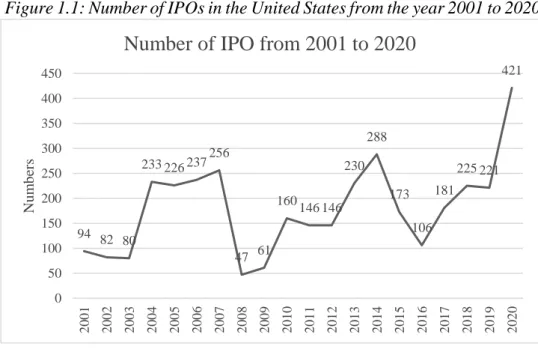
- Trend of Initial Public Offering in U.S
- Research Problem
- Research Question
- Research Objectives
- Research Significance
The final step is that the underwriters will conduct an analysis of the IPO stock and the company is successfully listed on the market. Therefore, the company will be disadvantaged in the event of raising additional funds from IPOs due to the unfavorable development of macroeconomic factors. To examine the relationship between macroeconomic factors and the number of IPOs in the United States.
To examine the relationship between inflation and the number of IPOs in the United States. This study contributed the importance of the study to policy makers, retail investors, the educational field, and the company that wants to issue an IPO in the United States. Since this research provides information on the effect of the macroeconomic factors on the IPOs in the United States, the company can consider the study as a reference to decide the best timing for the company's IPO.
Therefore, it is important for the company to make a wise decision by referring to the research.
LITERATURE REVIEW
- Introduction
- Underlying Theories
- Capital Demand Hypothesis
- Theory of IPO Wave
- Business Cycle Theory
- Hypothesis Development
- Number of Initial Public Offering
- Inflation (Consumer Price Index)
- GDP Growth Rate
- Lending Interest Rate
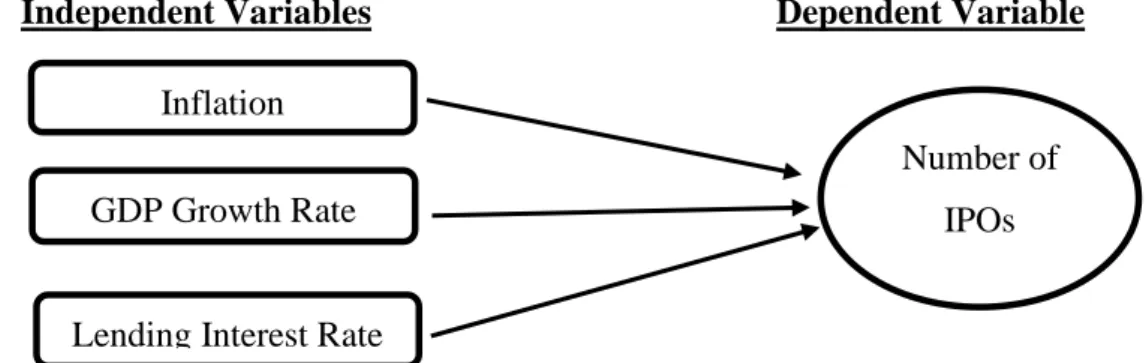
- Proposed Theoretical Framework
Additional factors that change the number of IPOs are also the result of asymmetric information in the market (Ritter &. A clear manifestation of unexpected inflation will make the company reluctant to go public, which will further reduce the number of IPOs. The rate of GDP growth also serves as a major factor , which may affect the number of IPOs issued.
2014) have stated that GDP growth has a crucial impact on the number of IPOs in Poland from the period from 1992 to 2012. 2018) have stated that interest rates on loans can have a negative and significant impact on the number of IPOs in Nepal . This negative relationship represents the number of IPOs that decline when interest rates on loans rise.
The box above shows the relationships between macroeconomic factors and the number of IPOs in the United States.
METHODOLOGY
- Introduction
- Research Design
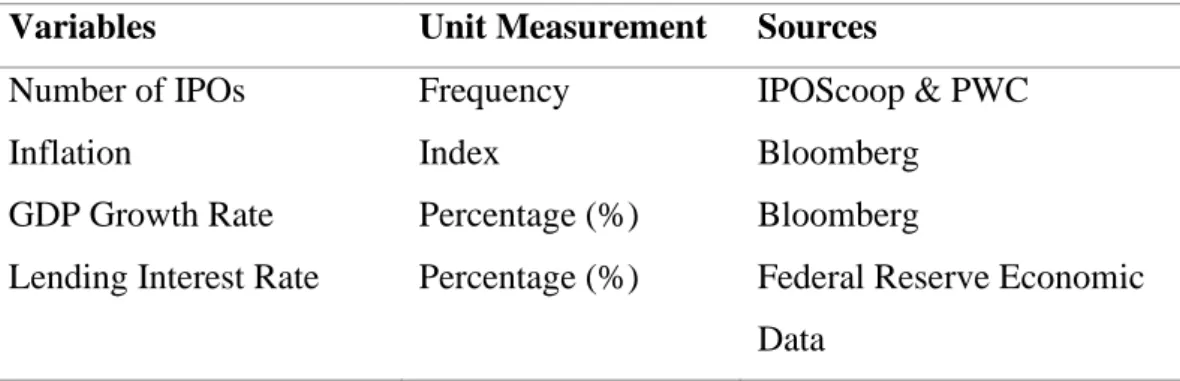
- Data Collection Method
- Proposed Data Analysis Tool
- Augmented Dickey Fuller Test (ADF)
- Johansen Co-integration Test
- Granger-causality Test
- Normality Test- Jarque-Bera Test
- Multicollinearity
- Heteroscedasticity
- Autocorrelation
In addition, the Schwarz Bayesian Criterion is also chosen to identify the appropriate lag length number in the regression for the ADF test (Prabhakaran, 2019). So, this Johansen cointegration test is suitable for us to perform in our research, since we focus our research on the United States, which has a large population or sample size, and we use time series data. like our research data. It is used to test the causality relationship between independent and dependent variables in the short run (Gujarati & Porter, 2009).
Heteroscedasticity refers to the uneven dispersion of the error term in a regression analysis (Frost, n.d.). In order to determine the presence of heteroscedasticity in the research, the autoregressive conditional heteroscedasticity (ARCH) test can be used in the data analysis. When the problem of heteroscedasticity is present in a regression model, this problem can be solved using generalized least squares (GLS) and weighted least squares (WLS).
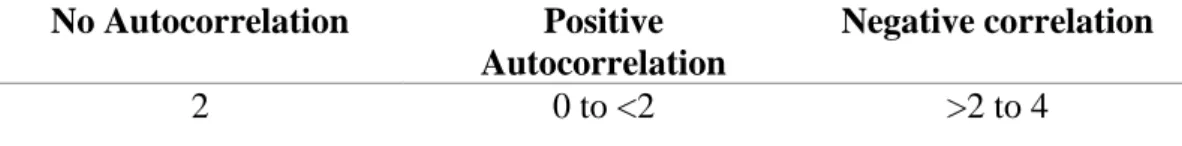
To determine whether there is an autocorrelation problem, tests such as the Durbin-Watson test must be performed.
DATA ANALYSIS
- Introduction
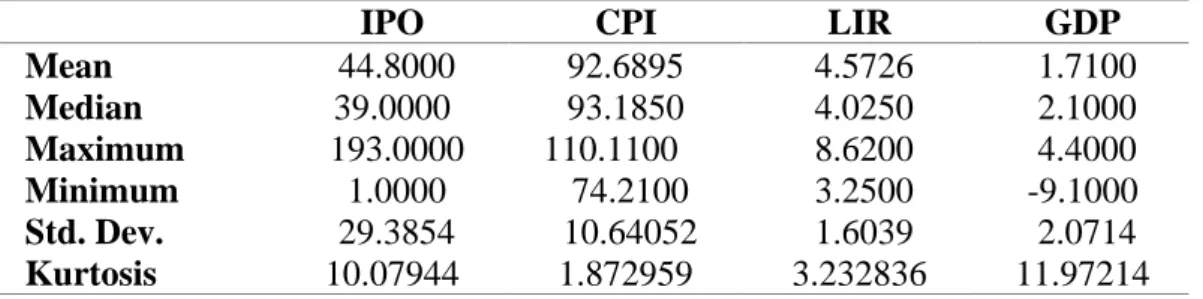
- Descriptive Analysis
- Inferential Analysis
- Multiple Linear Regression Model
- Augmented Dickey Fuller Test (ADF Test)
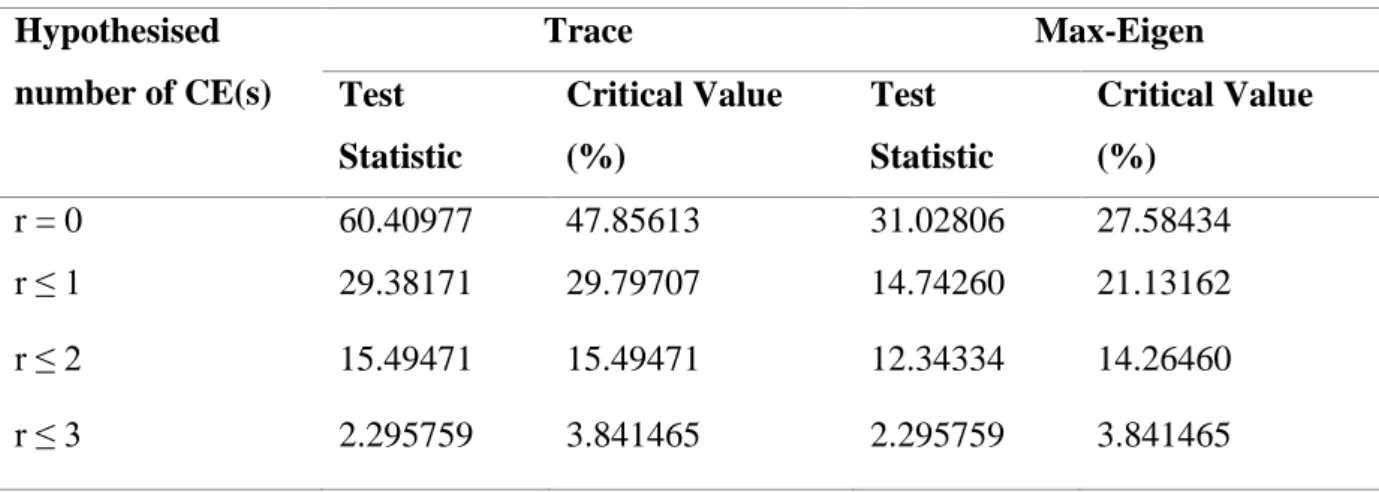
- Johansen Co-integration Test
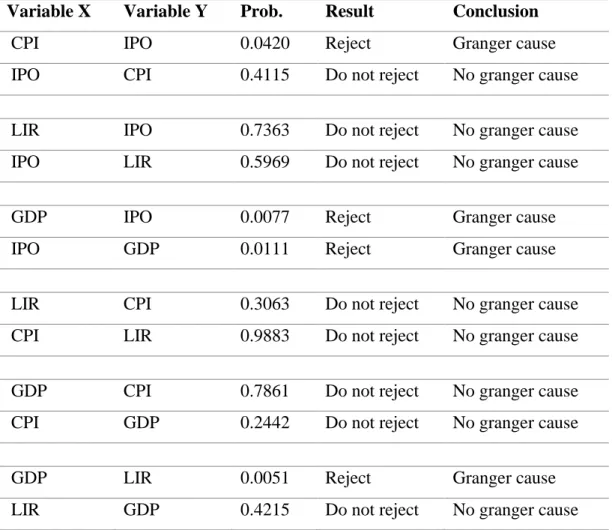
- Granger Causality Test
- Diagnostic Checking
- Jarque-Bera Test
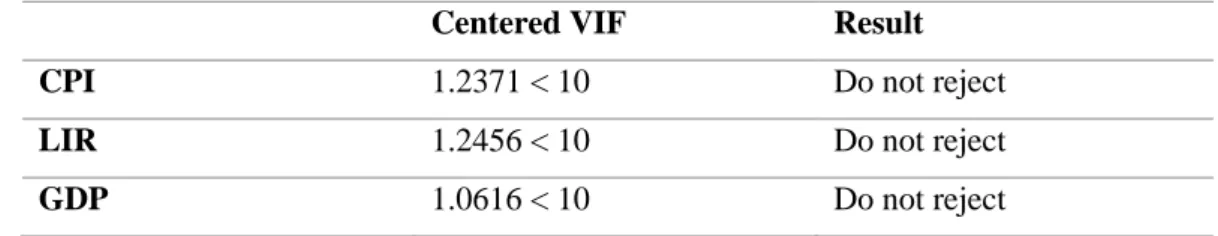
- Multicollinearity
- Heteroscedasticity
- Autocorrelation
A multiple linear regression model is formed to identify the estimate of the number of IPOs in the United States and the three variables. The number of IPOs is the output variable, while inflation, GDP growth and credit rates are the explanatory variables selected for this project. When all variables are held constant, the number of IPOs will decrease by an average of 87.1511.
If the consumer price index increases by 1 index on average, the number of Initial Public Offerings will increase by 1.1795, ceteris paribus. If the lending rate increases by 1 percent on average, the number of initial public offerings will increase by 4.9883, ceteris paribus. If growth domestic product increases by 1 percent on average, the number of Initial Public Offerings will decrease by 0.1089, ceteris paribus.
This means that 15.83% of the variation in the number of IPOs is explained by the variation in the consumer price index, the credit interest rate and the gross domestic product. There are 80 sample size observations and the standard error of the model is 27.4861. The above table showed the result of Johansen cointegration test which is obtained from EViews12.
Based on the table above, 0 is rejected because the test statistic of 60.40977 for the trace test is greater than the critical value of 47.85613 at the 5% significance level. Based on Table 4.6, the result shows that the VIFs of each variable are below 10, which means that the model does not have multicollinearity problem. The Autoregressive Conditional Heteroskedasticity (ARCH) test is designed to test for the presence of the heteroskedasticity problem.
The table above showed the result of the ARCH test obtained from the EViews 12 to test for the heteroskedasticity. Autocorrelation is also called as serial correlation which should identify the repeating pattern of the model.
CONCLUSION
- Introduction
- Discuss of Findings
- Summary on Statistical Analysis
- Implication of Study
- Implication to Policymaker
- Implication to Investor
- Implication to Educational Field
- Implication to Company which Want to Issue IPO
- Limitations of Study
- Recommendation for Future Research
On the other hand, real gross domestic has a negative relationship with the number of IPOs. As mentioned above in the table, there is a positive relationship between number of IPO and inflation. 2018) studied the relationship between the number of IPO in Nepal and GDP growth rate.
The result finally indicated that GDP growth has no significant influence on the number of IPO. The table points out that the lending interest rate has a positive relationship with the number of IPOs in the United States, which is opposed to the finding of Mehmood et al. It is necessary to highlight that capital demand hypothesis is also based on the state of the market.
The implication of our research for policymakers is to provide them with an understanding and discussion of how macroeconomic variables affect the number of US IPOs. Therefore, policy makers can use our study as a reference so that they can achieve the development of the economy. growth as well as economic stability of the country. Thus, policy makers can issue an appropriate monetary policy to control the country's inflation. First, our research studies the relationship between the number of IPOs and independent variables such as stock market return, industrial production, inflation, GDP growth rate and credit interest rate.
As mentioned in the limitations of the study section earlier, we can note that there is limited availability of data. Those textbooks and reference books required to be carried out as supporting evidence of the research carried out by prospective researchers can be found in the library. The application of different reference sources can contribute to improving the result of the research carried out by future researchers and lead to success.
Impact of the macroeconomic factors on the initial public offerings in the Gulf cooperation countries. Ownership structure and the life cycle of the firm: A theory of the decision to go public.
Descriptive analysis
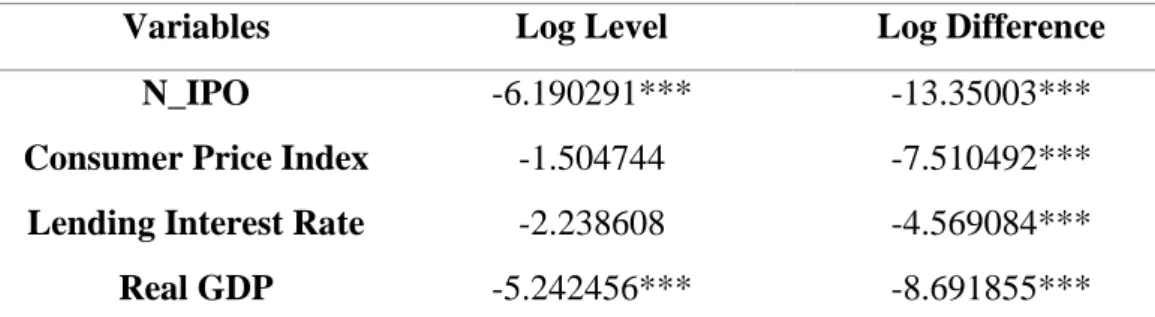
Augmented Dickey Fuller Test
Number of IPO (log level)
Number of IPO (log difference)
Consumer Price Index (log level)
Consumer Price Index (log difference)
Lending Interest Rate (log level)
Lending Interest Rate (log difference)
Real GDP (log level)
Real GDP (log difference)
Johansen Co-Integration Test
Granger Causality Test
Jarque-Bera Test
Multicollinearity
Heteroscedasticity
Autocorrelation
Durbin-Watson Test
Breusch-Godfrey Serial Correlation LM Test
It is hereby certified that Evon Foo Yuet Wen (ID No: 18ABB02588) has completed this final year project entitled "Relationship between Initial Public Offerings and Macroeconomic Factors in the USA". under the leadership of mr. Adam Arif Lee Aik Keang from the Department of Finance, Faculty of Business and Finance. I understand that the University will upload soft copy of my final year project in pdf format in UTAR Institutional Repository, which can be made accessible to UTAR community and public.
It is hereby certified that Tang Hui Yi (ID No: 18ABB02196) has completed this final year project entitled "Relationship between Initial Public Offerings and Macroeconomic Factors in the US". under the supervision of mr. I understand that the University will upload soft copy of my final year in pdf format in UTAR Institutional Repository, which can be made accessible to UTAR community and public. It is hereby certified that Wong Wee Kang (ID No: 18ABB05735) has completed this final year project entitled "Relationship between Initial Public Offerings and Macroeconomic Factors in the USA". under the leadership of mr. Adam Arif Lee Aik Keang from the Department of Finance, Faculty of Business and Finance.
I understand that the University will upload an electronic copy of my final year report in pdf format to the UTAR Institutional Repository, which will be readily accessible to the UTAR community and the public. Form Title: Supervisor Comments on Originality Report Generated by Turnitin for Final Year Project Report Submission (for Undergraduate Programs). Final Year Project Title Relationship between Initial Public Offerings and Macroeconomic Factors in the US Mandatory if the originality parameters exceed the limits approved by UTAR).
The required parameters of originality and the limits approved by UTAR are as follows: (i) The overall similarity index is 20% and below, and. ii) Match of individual sources listed must be less than 3% each and (iii) Matching texts in continuous block must not exceed 8 words. Note: Parameters (i) – (ii) will exclude quotes, bibliography and text matching that are less than 8 words. Note The Supervisor/Candidate(s) must/are required to provide the Faculty/Institute with a full copy of the complete set of originality report.
Based on the above results, I declare that I am satisfied with the authenticity of the Final Year Project Report submitted by my student(s) as mentioned above. 34; Land Availability and Housing Price in China: Empirical Evidence from Nonlinear Distributed Autoregressive Lag (NARDL)”, Land Use Policy, 2022.