Therefore, the information is adapted and extracted from the literature review on past studies in order to investigate the counter-performance, risk and benefits of risk diversification between Malaysian listed companies and Singapore listed companies. This study investigates the performance index, risk characteristics and risk diversification benefits of Malaysian-listed companies and Singapore-listed companies from January 2009 to December 2018. The total risk of Singapore-listed companies is higher than Malaysian-listed companies, while the Beta values for both countries are less than one.
RESEARCH OVERVIEW
- Introduction
- Research Background
- Problem Statements
- Research Objectives
- Research Questions
- Research Significance
- Chapter Layouts
To determine and compare the investment performance of selected Malaysia-listed and Singapore-listed companies using Jensen's Alpha. To determine and compare the non-systematic risk for each of the selected Malaysia-listed companies and Singapore-listed companies. This chapter aims to inspect the previous studies of the companies listed in Malaysia and Singapore.
LITERATURE REVIEW
- Introduction
- Review of Literature on Market Capitalization
- Measuring the Investment Performance
- Hypotheses Development
REITs have a lower total risk compared to Malaysian Publicly Owned Listed Companies (M-PPLC). Obviously, Malaysian listed companies perform much better than Singapore listed companies. This shows that companies listed in Singapore bear almost 2 times more risk compared to companies listed in Malaysia.
Therefore, it indicates that there are more diversification opportunities and better diversification benefits among listed companies in Malaysia. Singapore Listed Companies TR (Malaysia Listed Companies have higher Treynor Ratio compared to Singapore Listed Companies).
RESEARCH METHODOLOGY
Introduction
Research Design
In addition, this chapter shows the methods of secondary data collection and the mathematical formulas used to obtain the necessary data.
Data Collection Method
- Secondary Data
- Ranking of Companies based on Market
- Mathematical Formulas
- Calculating Weekly Returns
- Calculating Performance of Listed
- Calculating Risk Features of Listed
Pt-1= The company's closing price on the chosen day of the week prior to week t. There are three main components to calculating the Sharpe ratio: standard deviation/total risk, average portfolio return, and the risk-free rate of return. The standard deviation indicates the degree of variation of each company's returns over the sampling period (Choo & Tan, 2019).
Generally, if the result produced a positive Sharpe ratio value, it indicates that there are returns generated in excess of the risk-free rate of return. In other words, the larger the value of Sharpe ratio, the more attractive the company return compared to the risk-free rate of return. The Beta of each listed company was calculated to measure the market-related risk or volatility of the company.
Based on the research by Fama & Macbeth (1973) it mentioned that the beta of the efficient portfolio will usually be stable and vice versa. Cov (Ri ,Rm) = Covariance of the company's stock & the market σm2 = Market portfolio's variance of return. According to the research by Ng, Leong, Lau & Abdul Rahim (2018), diversification can be defined as "the method of allocating capital with the aim of reducing the risk exposure".
In general, if the value of R2 is higher, there will be a greater probability that the listed companies move with the market index, which in other words indicates that most of the risk is caused by the systematic risk.
Method of Analysis
Conclusion
DATA ANALYSIS
Introduction
Empirical Findings and Discussions
- Summary Statistic
- Analysis of Performance Measure
- Analysis of Risk Features
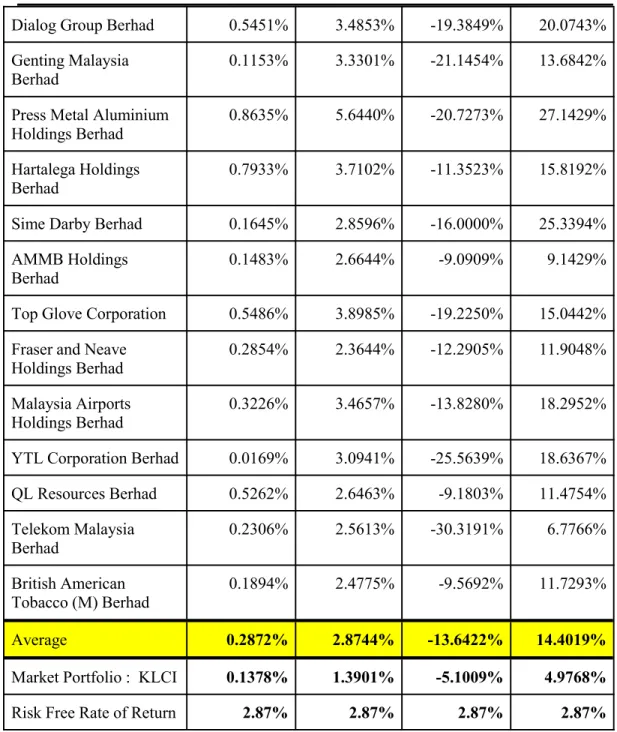
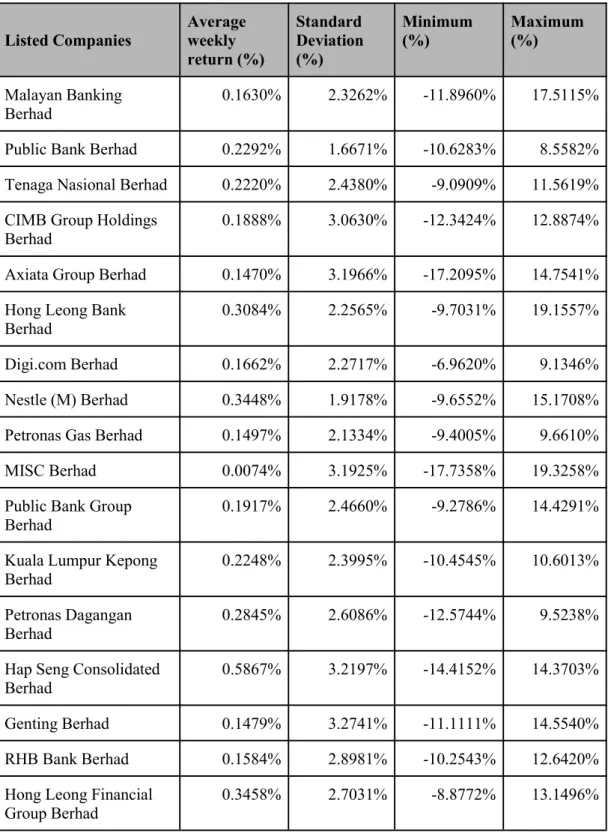
In addition, Singapore-listed companies have a higher standard deviation of about 3.2390% compared to Malaysia-listed companies of about 2.8744%. In addition, not all listed companies in Singapore have achieved a Sharpe ratio greater than one. Malaysia's listed companies generate an average Jensen Alpha of -0.0011, while Singapore's listed companies are valued at -0.0034.
However, in Singapore, there are 17 out of 30 listed companies that produced a negative value of Jensen Alpha. On the other hand, it indicates that the listed companies in Malaysia are highly diversified compared to the listed companies in Singapore. Moreover, the diversifiability measure of Malaysia listed companies and Singapore listed companies are valued at 0.7817 and 0.6642 respectively.
As we can see, most of the diversification value of Malaysian listed companies is estimated at around 0.5227 and above. It also shows that most Malaysian listed companies have high diversification value and greater opportunities for diversification compared to Singapore. The overall risk borne by companies listed in Malaysia is slightly lower than companies listed in Singapore.
In addition, the systematic value of risk recorded in Singapore listed companies and Malaysian listed companies is approximately 3.5778% and 1.8127%. This also means that in most listed companies in Singapore, there is a higher risk that cannot be diversified away. Therefore, the calculated value for Malaysian listed companies is 6.9890 and for Singapore listed companies is 7.2114.
Conclusion
In addition, the study also compares the risk diversification benefits of Malaysian listed companies and Singapore listed companies using a diversification measure. The total average weekly return of Malaysian listed companies (0.2872) is generally higher than that of Singapore listed companies (0.2097). Companies listed in Malaysia have generated an average rate of return that is even higher than the risk-free rate in Malaysia compared to companies listed in Singapore in Singapore.
Moreover, compared to Malaysia listed companies, Singapore listed companies have a higher value of R-squared, which (0.3358 >. In other words, this indicates that Malaysia listed companies may have greater and better diversification benefits. Malaysia listed companies have lower overall risk compared to Singapore listed companies). systematic risk < Systematic risk of Singapore Listed Companies.
Malaysia listed companies have lower systematic risk compared to Singapore listed companies). unsystematic risk < Unsystematic risk of Singapore listed companies. The purpose of this research study is to provide a comparative analysis for the overall performance and risk diversification benefits of the listed companies in Malaysia and Singapore. According to the results shown in Chapter 4, the results show that Malaysia listed companies perform favorably compared to Singapore listed companies.
In a nutshell, this research has examined and compared the performance, risk and risk spread benefits between the Malaysia listed companies and Singapore listed companies by market capitalization.

CONCLUSION
Introduction
The risk-adjusted performance of Malaysian listed companies and Singapore listed companies was assessed using tried and true valuation methods such as Sharpe Ratio, Jensen's Alpha and Treynor Ratio. Furthermore, according to Jensen's Alpha, it is found that 18 Malaysian listed companies underperformed the KLCI index. However, 17 out of 30 Singapore-listed companies have negative alphas, which also underperforms the STI index.
After comparing and contrasting the listed companies in both countries, the result of measuring risk and risk spread is tabular data in the preceding. It indicates that Singapore listed companies are more diversified than Malaysian listed companies and suggests that Singapore's market has been diversified. Besides that, when measuring the risk diversification benefit, a greater value of diversification objective is shown in the listed companies in Malaysia compared to Singapore.
In addition, unsystematic risk is also more diversified if investors choose listed companies in Malaysia as their portfolio. But the findings of this study differ from previous studies as the Beta of Malaysian listed companies is higher than the Beta of Singapore listed companies. At the same time, it also means that Malaysian listed companies had extremely high performance and risk diversification benefits compared to Singapore listed companies in terms of higher value of SR, TR and αi.
In conclusion, the results of this study also indicate that the listed firms in Singapore actually have lower diversification benefits, as shown by their lower diversifiability measures.
Limitations of the Study
The quantitative evaluation is provided as it allows readers/investors to understand and compare the capabilities and potential of both countries' listed companies in terms of their overall performance, risk characteristics and risk diversification benefits. This is similar to the results of Choo and Tan (2019) found that J-REITs actually have lower diversification benefits compared to M-REITs. First of all, there may be data collection errors while using the Bloomberg terminals, as some of the data is unavailable and incomplete.
For example, the most common problem is that some stock quotes are missing, which may bias the findings in this study. This study entitled “Malaysia and Singapore Listed Companies by Market Capitalization - A Comparative Risk and Performance Analysis” was a study that had not been conducted before. There is also a limited number of previous magazines comparing listed companies by market capitalization in both Malaysia and Singapore.
In addition, as we are able to seek advice from the research advisor, Dr David Ng, and have taken his previous studies as a basic reference for the assignment, which ease the research process. Therefore, the companies that are selected are based on their ranking by market capitalization as well as the year of that company's listing. Therefore, the ranking of companies by market capitalization will also change from day to day and the data we received is as of May 29, 2019.
This may cause the data collected to be biased and result in inaccuracies in the research.
Recommendations for Future Research
Conclusion
Analyzing the Performance and Benefits of Risk Diversification between Real Estate Investment Trust and Listed Property Companies in Malaysia.Tunku Abdul Rahman University. Comparing the Performance and Risk Diversification Benefits of Real Estate Investment Trusts (REITs) in Malaysia and Japan. Empirical investigation on the performance of Malaysian Real Estate Investment Trust in Pre-crisis, during the crisis and post-crisis period.
A Study on Comparative Analysis of Risk and Return with Reference to Selected Stocks of BSE Sensex Index, India. Retrieved January 2 from https://www.researchgate.net/publication/235250152_The_long-. term_investment_performance_of_Singapore_real_estate_and_property_stoc ks?fbclid=IwAR2vN8ucnls9Jk3Uw69nQVJ_yw03GAszzle8Cnz1Prpisc9Fw RKmt0k Naes. Hotel real estate investment trusts' risk characteristics and beta determinants. 2003), “Risk-adjusted performance: a sector analysis of restaurant firms”, Journal of Hospitality & Tourism Research, Vol.
A comparison of performance and risk diversification benefits of real estate investment trusts in Malaysia and Singapore. A study on the performance of Malaysian real estate investment trusts in 2005-2010 using the net asset value approach.