Cost effective thermoelectric composites from recycled carbon fibre: From waste to energy
Priyanka R. Jagadish, Mohammad Khalid, Lau Phei Li, Mohammad Taghi Hajibeigy, Nowshad Amin, Rashmi Walvekar, Andy Chan
PII: S0959-6526(18)31591-9 DOI: 10.1016/j.jclepro.2018.05.238 Reference: JCLP 13095
To appear in: Journal of Cleaner Production Received Date: 26 March 2018
Revised Date: 14 May 2018 Accepted Date: 28 May 2018
Please cite this article as: Jagadish PR, Khalid M, Li LP, Hajibeigy MT, Amin N, Walvekar R, Chan A, Cost effective thermoelectric composites from recycled carbon fibre: From waste to energy, Journal of Cleaner Production (2018), doi: 10.1016/j.jclepro.2018.05.238.
This is a PDF file of an unedited manuscript that has been accepted for publication. As a service to our customers we are providing this early version of the manuscript. The manuscript will undergo copyediting, typesetting, and review of the resulting proof before it is published in its final form. Please note that during the production process errors may be discovered which could affect the content, and all legal disclaimers that apply to the journal pertain.
M AN US CR IP T
AC CE PT ED
Cost Effective Thermoelectric Composites From Recycled Carbon Fibre: From Waste 1
to Energy 2
3
Priyanka R. Jagadish1,2*, Mohammad Khalid2*, Lau Phei Li1,Mohammad Taghi Hajibeigy3, 4
Nowshad Amin4,5, Rashmi Walvekar3, Andy Chan6 5
6
1Department of Chemical and Environmental Engineering, Faculty of Engineering, 7
The University of Nottingham Malaysia Campus, 43500, Semenyih, Selangor, Malaysia 8
2 Graphene & Advanced 2D Materials Research Group (GAMRG), School of Science and 9
Technology Sunway University, No. 5, Jalan Universiti, 47500 Bandar Sunway, 10
Selangor Darul Ehsan, Malaysia 11
3School of Engineering, Taylor’s University, No. 1 Jalan Taylor's, 47500 Subang Jaya, 12
Selangor Darul Ehsan 13
Malaysia 14
4Department of Electrical, Electronic and Systems Engineering, Faculty of Engineering and 15
Built Environment, The National University of Malaysia, 16
43600 Bangi, Selangor, Malaysia 17
5Institute of Sustainable Energy, Universiti Tenaga Nasional, Jalan IKRAM-UNITEN, 43000 18
Kajang, Selangor, Malaysia 19
6Department of Civil Engineering, Faculty of Engineering, 20
The University of Nottingham Malaysia Campus, 43500 Semenyih, Selangor, Malaysia 21
22
Corresponding Authors: [email protected] 23
25 26
Abstract 27
Within the framework of recycling and reusing carbon fibre, this study focused on the 28
fabrication of a thermoelectric composite encompassing recycled carbon fibre and two 29
thermoelectric fillers (i) bismuth telluride and (ii) bismuth sulphide. This study investigated 30
the effect of the concentration of bismuth telluride and bismuth sulphide fillers respectively 31
on the thermoelectric, morphology, structural and thermal stability of the recycled carbon 32
fibre thermoelectric composites. The optimum thermoelectric filler concentration is 45 wt%
33
for both fillers, which resulted in a power factor of 0.194 ± 9.70×10⁻³ µWK-2m-1 and 0.0941 ± 34
4.71×10⁻³ µWK-2m-1 for recycled carbon fibre-bismuth telluride and recycled carbon fibre- 35
bismuth sulphide composites respectively. This study exhibited the energy harvesting 36
M AN US CR IP T
AC CE PT ED
capabilities of recycled carbon fibre composites from low grade waste heat when coated with 37
thermoelectric materials.
38
Keywords: recycled carbon fibre, thermoelectric composites; bismuth telluride, bismuth 39
sulphide; energy.
40
1. Introduction 41
Carbon fibre-reinforced composites are now steadily being preferred in the automotive, 42
aerospace and industrial applications due to its lightweight, flexibility and robust mechanical 43
properties (Shuaib & Mativenga, 2016; Marsh, 2014; Timmis et al., 2015; Tian et al., 2017).
44
This increasing preference has led to approximately 3000 tonnes of carbon fibre scrap 45
composites produced by United States of America (USA) and Europe annually (McConnell, 46
2010). The Landfill Directive (1999/31/EC) has enforced environmental legislation that 47
compels industry stakeholders to explore alternative disposal methods for these carbon fibre- 48
reinforced scrap instead of conventional incineration and landfill disposal (Marsh, 2009;
49
Howarth et al., 2014).
50
Recycled carbon fibre (RCF) has been primarily explored for its mechanical properties in 51
structural applications (Cholake et al., 2016; Li et al. , 2016; Feng et al. , 2013), however 52
recycling leads to a slight decrease in tensile strength properties which makes it challenging 53
to be used for structural purposes currently. RCF cannot be used as a direct substitute of 54
virgin carbon fibre in critical structural applications, as it would not have the same strength 55
and rigidity (Li et al., 2016). Hence, different routes to use RCF should be explored to close 56
the recycling loop in which mechanical properties are not as vital. One such application is 57
utilising RCF in the field of thermoelectricity. Thermoelectricity is the conversion of widely 58
available thermal energy (i.e. waste heat from refrigerators, air-conditioners, exhaust pipes of 59
vehicles, electronic gadgets) into usable electricity (Fernández-Yáñez et al., 2018; Kishita et 60
al., 2016).
61
M AN US CR IP T
AC CE PT ED
Though recycling leads to reduction of mechanical properties, the electrically conductive 62
nature of carbon fibres are preserved despite recycling (Wong et al., 2010). Carbon fibre is an 63
electrical conductor that is weakly thermoelectric, has enabled it to be integrated into 64
polymer-matrix composites and also cement composites for thermoelectric and heating 65
applications as fillers (Wang et al., 2014; Tsukamoto et al., 1989; Hambach et al., 2016).
66
RCF has previously been explored by the authors as a flexible substrate in electrodeposited 67
bismuth telluride (Bi2Te3) thin films and exhibited positive thermoelectric capabilities (Pang 68
et al., 2012; Jagadish et al., 2016; Jagadish et al., 2017).
69
However, for practical application the thickness of thin films are just too small to sustain a 70
substantial temperature difference for thermoelectric energy harvesting. Moreover for large- 71
scale conversion of thermal to electrical energy, thin film techniques require high cost of 72
processing, special infrastructure, time consuming and are energy intensive. In addition to 73
that, the previously used electrodeposition technique also results in toxic solvent disposal 74
issues as most electrolytes used are strongly acidic such as hydrochloric and nitric acids.
75
Therefore, in order to overcome the shortcomings of the previous technique, this research 76
work focuses on the development of a low-cost effective RCF polymer thermoelectric 77
composite using a combination of hot compression and brushing technique. To the best of the 78
author’s knowledge, no prior work has been done on the hybrid RCF-inorganic 79
thermoelectric filler polymer thermoelectric composite. In this study, the inorganic 80
thermoelectric filler chosen is n-type bismuth telluride (Bi2Te3) as it has the highest reported 81
value of ZT≈ 1.4 at a room-temperature range of 200–400 K which is suitable for portable 82
power generators (Venkatasubramanian et al., 2001; Kusagaya and Takashiri, 2015).
83
Although telluride based thermoelectric materials especially Bi2Te3 have high figure of merit 84
(ZT) values at approximately 1.2 (Venkatasubramanian et al., 2001; Wang et al., 2015) 85
M AN US CR IP T
AC CE PT ED
showing superior thermoelectric properties and hold dominant market share in thermoelectric 86
industry, it is imperative to develop alternative materials because of the rare nature of 87
availability and toxicity of tellurium (Zhao et al., 2008). Bi2S3 has recently acquired much 88
attention due to its environmentally friendly nature and its potential application in the 89
thermoelectric field (Yu et al., 2011; Wong et al., 2016). Bismuth sulphide (Bi2S3) is 90
promising in this respect because of its abundance, high Seebeck coefficient and low thermal 91
conductivity. Thus, the second part of this study also investigated the thermoelectric 92
properties of Bi2S3 coated RCF composite.
93
This work focused on the optimisation of the concentration of thermoelectric fillers and its 94
subsequent effect on the thermoelectric properties (i.e. Seebeck coefficient, electrical 95
resistivity and power factor) for both Bi2Te3 and Bi2S3. The morphological, structural and 96
also the thermal stability of the RCF composites filled with Bi2Te3 and Bi2S3 were also 97
demonstrated in this work.
98 99
2. Material and Methods 100
2.1. Materials 101
The inorganic thermoelectric fillers used are bismuth (III) telluride and bismuth (III) sulphide 102
powders. The bismuth (III) telluride powders with a relative density of 7.6 g/cm3 and purity 103
of 99.99% was purchased from Sigma Aldrich Sdn. Bhd. Bismuth (III) sulphide powders 104
with a relative density of 7.7 g/cm3 and purity of 99% was purchased from Sigma Aldrich 105
Sdn. Bhd. A water-based formaldehyde-free cross-linked acrylate binding polymer, Acrodur 106
DS 3530 was supplied by BASF Malaysia Sdn. Bhd. The recycled carbon fibres used in this 107
experiment are recycled Toray T600 carbon fibre recovered via fluidised bed process 108
supplied by Recycled Carbon Fibre Limited (RCF) Coseley, UK.
109
M AN US CR IP T
AC CE PT ED
2.2. Thermoelectric Composite Fabrication 110
2.2.1 RCF Composite 111
Layers of randomly oriented RCF were placed in a binder-water suspension with a 1: 10 112
(volume ratio). The RCF was soaked in the suspension for approximately 15 minutes. The 113
soaked RCF was sandwiched between two metal plates that were covered with laboratory 114
wipes on the top and bottom plate to remove the residual water. The top metal plate was then 115
manually subjected to a brick load of 10 kg to produce a uniform RCF composite with a 116
thickness of 1 mm. The laboratory wipes were replaced with new ones once it was wet and 117
the RCF were subjected to the same load for approximately three times until it was dried. The 118
dried RCF with an applied top load of 5 kg was then placed in a Memmert oven at 200 °C for 119
1 hour for moisture evaporation and also curing and formation of the RCF composite.
120 121
2.2.2 Thermoelectric Filler Coating on RCF composite 122
Two thermoelectric fillers are used in this work, namely Bi2Te3 and Bi2S3 particles. The 123
thermoelectric filler particles are mixed with ethylene glycol and Acrodur DS 3530 binder 124
and are subjected to ultrasonication for one hour, this ultrasonicated solution will thereafter 125
be referred to as thermoelectric filler coating. The thermoelectric filler coating is then applied 126
to the surface of the RCF composite using a brushing technique (using paint brush). The 127
coated RCF composite is then placed into the oven at 200 °C for 1 hour. The weight percent 128
of both thermoelectric fillers were varied from 15 to 60 weight percent (wt%) within the 129
composite.
130 131
M AN US CR IP T
AC CE PT ED
2.3. Characterization 132
2.3.1. Seebeck coefficient 133
The Seebeck coefficient was measured using an in-house measurement system (see Figure 134
S.1 in Supplementary data).
135
The Seebeck coefficient is calculated using the formula shown in Eq (1):
136
=∆
∆ =−
− (1)
∆V in millivolts is the open circuit potential difference (VOC) generated between VH, the 137
potential at the hot side and VC, the potential at cold side, ∆T in Kelvin is the temperature 138
induced between the TH, temperature on the hot side and Tc, temperature on the cold side.
139
The test was conducted with an average measuring temperature of 40 °C on the hot side and 140
cold side subjected to room temperature. Whereby, α is the combined measured value of the 141
Seebeck coefficient of copper (αCU) and RCF thermoelectric composite (αCF), therefore the 142
Seebeck coefficient of RCF thermoelectric composite is given by Eq (2).
143
= − (2)
The Seebeck coefficients of the carbon fibres were calculated using Eq (2) by taking an 144
average of all six readings.
145
2.3.2. Hall Effect measurement 146
The electrical parameters such as electrical resistivity, carrier concentration and carrier 147
mobility was measured using a Hall Effect measurement system, HMS ECOPIA 3000 with a 148
magnetic field 0.57T and probe current of 15mA for all samples.
149
2.3.3. Power Factor Calculation 150
The performance/efficiency of a thermoelectric composite is given by the power factor (PF) 151
with the formula shown in Eq (3) (Kim and Oh, 2009).
152
M AN US CR IP T
AC CE PT ED
=
(3) PF is calculated based on measured values of both α and ρ.
153
2.3.3. Phase analysis 154
The phase structure and crystallinity property analysis of the RCF thermoelectric composites 155
was determined by X-ray powder diffraction (XRD) (Cu-Kα, Bruker D8 Advance) operating 156
at 40kV and 40 mA. XRD patterns were recorded in the 2θ range from 10 to 80° with a step 157
size of 0.025° using Cu Kα radiation wavelength of 1.540 Å.
158
Crystallite size (D) can be calculated using the Scherrer equation as shown in Eq (4):
159
= . (4) (Hasan and Shallal, 2014) 160
Where θ is the Bragg diffraction angle, λ is the wavelength of x-ray (1.540 Å), β is the full 161
width at half maximum (FWHM) of the main peak in the XRD pattern.
162
The microstrain ( ) of the thermoelectric composites are calculated using the formula in Eq 163
(5):
164
=! "#$ (5) (Yücel and Yücel, 2017a) 165
Dislocation density (δ) is defined as the length of dislocation lines per unit volume of 166
the crystal space is calculated using Eq (6):
167
δ =(') (6) (Yücel and Yücel, 2017b) 168
169
M AN US CR IP T
AC CE PT ED
2.3.4. Field Emission Scanning Electron Microscope (FESEM) and Energy Dispersive 170
X-Ray (EDX) Analysis 171
The RCF thermoelectric composites were cut into 1 cm x 1 cm and placed onto a double- 172
sided sticky tape that was positioned on sample pins before being placed into the FESEM 173
machine. The FESEM images were taken using the FEI Quanta 400 to obtain the 174
morphological structure of the composites. The EDX analysis was carried out to determine 175
the percentage distribution of bismuth, tellurium and sulphur in the composites.
176 177
2.3.5. Thermogravimetric Analysis (TGA) 178
Thermal degradation and stability of the RCF thermoelectric composites were measured 179
using a thermogravimetric analyser ( Perkin Elmer STA 6000). A sample of approximately 180
10-15 mg in weight was placed in an open alumina pan under an air flow rate of 20 ml/min 181
and heated from ambient 30 °C to 900 °C at a heating rate of 10 °C/min. The onset 182
degradation temperature (Tonset) is defined as the temperature at 5% weight loss. Maximum 183
degradation temperature (Tmax) is defined as temperature at which the thermoelectric 184
composite losses its maximum weight, that is identified by the peak of derivative (dW/dT) 185
curve. These temperatures were used to indicate the thermal degradation and stability of the 186
RCF thermoelectric composites.
187 188 189 190
M AN US CR IP T
AC CE PT ED
3. Results and discussions 191
3.1. Thermoelectric properties of RCF composites coated with Bi2Te3 and Bi2S3
192
Seebeck coefficient, electrical resistivity and power factor of RCF composites coated with 193
different weight concentrations of Bi2Te3 and Bi2S3 are shown in Figure 1 to Figure 4. Based 194
on Figure 1, it was observed that RCF composites exhibited weakly p-type thermoelectric 195
nature with a Seebeck coefficient of +4.52 ± 0.226 µV/K. Upon the incorporation of Bi2Te3 196
and Bi2S3 coating on the surface of RCF composite, the thermoelectric nature of the RCF 197
composite shifts from p-type to n-type as shown in Figure 1. All Bi2Te3 and Bi2S3 coated 198
RCF composites displayed negative Seebeck coefficients owing to the change in 199
conductivity. This shift is because Bi2Te3 and Bi2S3 used in this study are n-type 200
semiconductors which are electron dominant.
201
202
Figure 1:The effect of Bi2Te3 and Bi2S3 concentrations on the Seebeck coefficient of 203
RCF-Bi2Te3 and RCF-Bi2S3 composites.
204 205
M AN US CR IP T
AC CE PT ED
As both Seebeck coefficient and electrical resistivity are highly dependent on the carrier 206
concentration, their changes can be justified by the variation in carrier concentration as 207
shown in Eq (7) and Eq (8).
208
= +,-' (7) (Li et al., 2011) 209
= ±0,1 2(3 + 2) + ln(78=∗;0+1:);/)> (8) (Li et al., 2011) 210
Where, ρ is the electrical resistivity, n is carrier concentration, e is the electron charge (1.60 × 211
10-19 coulombs), µ is carrier mobility, α is the Seebeck coefficient, kB is Boltzmann’s 212
constant, r is the scattering factor, m* is effective mass, h is Planck constant and T is 213
temperature.
214
The Seebeck coefficient of both composites was observed to increase linearly with respect to 215
the concentration of the Bi2Te3 and Bi2S3 particles as shown in Figure 1. An increase in 216
Seebeck coefficient is a result of decreased carrier concentration as deduced from Eq (8) 217
above. The carrier concentration for RCF-Bi2Te3 composites decreased by approximately 218
62% from 1.43 × 1021 cm-3 (15 wt%) to 4.50× 1020 cm-3 (60 wt%) and that of RCF-Bi2S3
219
composites by approximately 92% from 4.59 × 1019 cm-3 (15 wt%) to 3.27× 1018 cm-3 (60 220
wt%) as shown in Table 1. RCF are inherently conductive due to its carbon content, thus 221
having a higher amount of carrier concentrations. However, with the increased incorporation 222
of semiconductors such as Bi2Te3 and Bi2S3 on RCF, the composites transition from a 223
conductive to semi-conductive nature, suppressing the density of its carrier concentration. It 224
is also important to emphasize that the Seebeck coefficient of RCF-Bi2S3 composites are 225
higher than that of RCF-Bi2Te3 composites at all loadings. This is because Bi2S3 has intrinsic 226
carrier concentrations around 1018 cm-3 that are two orders lower than that of Bi2Te3(1020 cm- 227
3) (Rowe, 1995).
228
M AN US CR IP T
AC CE PT ED
A similar increase in Seebeck coefficient was observed by Li et al., as the concentration of 229
Bi2Te3 was increased in a high performance (Bi2Te3)x(Sb2Te3)1-x bulk materials due to the 230
large difference in electronegativity between Bi and Te atoms that suppresses the carrier 231
concentrations (Li et al., 2011).
232
Table 1: Carrier concentration and carrier mobility of thermoelectric composites with 233
respect to increasing Bi2Te3 and Bi2S3 concentrations.
234
Weight percent of thermoelectric
filler (wt%)
Carrier concentration for RCF-Bi2Te3
composites (cm-3)
Carrier mobility for RCF-Bi2Te3
composites (cm2V-1s-1)
Carrier concentration for RCF-Bi2S3
composites (cm-3)
Carrier mobility for RCF-Bi2S3
composites (cm2V-1s-1)
15 1.43 × 10²¹ 4.62 × 10⁻³ 4.59 × 10¹⁹ 5.94 × 10⁻³
30 9.70 × 10²⁰ 7.31 × 10⁻³ 9.55 × 10¹⁸ 3.40 × 10⁻²
45 6.01 × 10²⁰ 1.27 × 10⁻² 4.27 × 10¹⁸ 6.67 × 10⁻²
60 4.50 × 10²⁰ 1.49 × 10⁻² 3.27 × 10¹⁸ 7.37 × 10⁻²
235
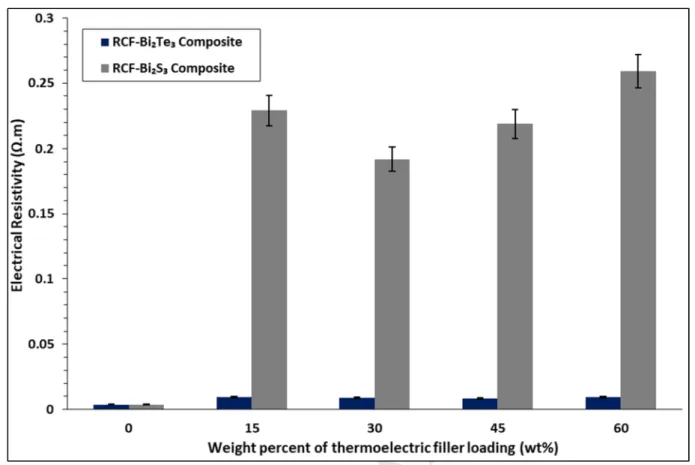
The influence of the concentration of Bi2Te3 and Bi2S3 particles on the electrical resistivity of 236
the composites are shown in Figure 2. As the changes in electrical resistivity of RCF-Bi2Te3
237
composites are not apparent in Figure 2 due to much higher resistivity of RCF-Bi2S3
238
composites, a zoomed in-view is plotted in Figure 3. All RCF-Bi2Te3 and RCF-Bi2S3 239
composites exhibited higher electrical resistivity than that of pure RCF composites (0 wt%), 240
attributed to the decreased carrier concentrations. Both RCF-Bi2S3 and RCF-Bi2Te3 depicted 241
an initial increase in resistivity from 0 wt% to 15 wt% as shown in Figure 2, this behaviour is 242
observed due to the presence of polymeric binder in the coating on the surface of RCF.
243
However, a decreasing trend in the electrical resistivity was observed from 15 wt% to 45 wt%
244
and 15 wt% to 30 wt% for RCF-Bi2Te3 and RCF-Bi2S3 composites respectively. This 245
decreasing trend is owing to the improvement in carrier mobility by one order from 4.62 × 246
10-3 cm2V-1s-1 (15 wt%) to 1.27 × 10⁻² cm2V-1s-1 (45 wt%) in RCF-Bi2Te3 and 5.94 × 10⁻³ 247
cm2V-1s-1 (15 wt%) to 3.40 × 10⁻² cm2V-1s-1 (30 wt%) in RCF-Bi2S3 respectively as shown in 248
Table 1. Bi2Te3 and Bi2S3 particles acts as a bridge between the haphazardly arranged RCF 249
strands, thus facilitating electron transport throughout the composite. Rahman et al. also 250
M AN US CR IP T
AC CE PT ED
observed a similar decrease in electrical resistivity when poly(3.4-ethylenedioxythiophene)- 251
poly(styrenesulfonate) (PEDOT: PSS) was doped with Bi2Te3 until a maximum of 0.8 wt%
252
whereby beyond that there was intense dopant aggregation that resulted in increased electrical 253
resistivity (Rahman et al., 2015). However increased loading of Bi2Te3 and Bi2S3 beyond 45 254
wt% and 30 wt% respectively, exhibited a detrimental effect on the electrical resistivity as 255
shown in Figure 2, due to the continuous decrease in carrier concentration and only marginal 256
improvement in carrier mobility at higher loadings.
257
Based on Figure 2, it is also observed that RCF-Bi2S3 displayed a higher resistivity than that 258
of RCF-Bi2Te3 at all concentrations. This is due to the difference in band gap between these 259
two semiconductors, Bi2S3 has a band gap of 1.3 eV (Liufu et al., 2007) whereas that of 260
Bi2Te3 is at 0.17 eV (Kioupakis et al., 2010). Band gap influences the intrinsic carrier 261
concentration and this relationship is described in Eq (9) below:
262
@A = BCCDexp(−HIK2J) (9) ( Keuch, 2015) 263
Where, ni is the intrinsic carrier concentration, NC is the effective density of states in the 264
conduction band, NV is the effective density of states in the valence band, Eg is the band gap, 265
k is Boltzmann’s constant and T is temperature. Therefore, as the band gap of Bi2S3 is wider 266
than that of Bi2Te3, intrinsically it has fewer carrier concentrations thus rendering it more 267
resistive.
268 269 270
M AN US CR IP T
AC CE PT ED
271
Figure 2: The effect of Bi2Te3 and Bi2S3 concentrations on the electrical resistivity 272
of RCF-Bi2Te3 and RCF-Bi2S3 composites.
273
274
275
Figure 3: Zoomed in view on the electrical resistivity of RCF-Bi2Te3 composites with 276
respect to varying concentrations of Bi2Te3. 277
M AN US CR IP T
AC CE PT ED
The power factor of RCF-Bi2Te3 and RCF-Bi2S3 composites is calculated taking into 278
consideration both Seebeck coefficient and electrical resistivity and the corresponding values 279
is as shown in Figure 4. The highest power factor obtained for RCF-Bi2Te3 and RCF-Bi2S3
280
composites are 0.194 ± 9.70×10⁻³ µWK-2m-1 and 0.0941 ± 4.71×10⁻³ µWK-2m-1 respectively, 281
both composites attained the highest power factor at 45 wt% of thermoelectric filler loading.
282
The environmentally friendly RCF-Bi2S3 thermoelectric composite is approximately 95%
283
lower in power factor compared to that of RCF-Bi2Te3 composites. The lower thermoelectric 284
performance of RCF-Bi2S3 composites could be attributed to its resistivity. The highest 285
resistivity of RCF-Bi2S3 composites is 0.259 ± 1.30 ×10⁻² Ω.m whereas that of RCF-Bi2Te3 is 286
9.44×10⁻³ ± 4.72×10⁻⁴ Ω.m, which renders Bi2S3 27.4 times more resistive than Bi2Te3.The 287
resistive nature of Bi2S3 is due to its low carrier concentrations, the lowest carrier 288
concentration of RCF-Bi2S3 composite is 3.27 × 1018 cm-3 whereas that of RCF-Bi2Te3 289
composite is 4.50 × 1020 cm-3 as shown in Table 1 which is approximately two orders lower 290
than Bi2Te3. However, the naturally low carrier concentrations in Bi2S3 resulted in higher 291
Seebeck coefficient of RCF-Bi2S3 (-150.1±7.51 µV/K) composites approximately 252%
292
higher than that of RCF-Bi2Te3 (-42.6±2.13 µV/K) composites.
293 294 295 296 297 298 299 300
M AN US CR IP T
AC CE PT ED
301
Figure 4: The effect of Bi2Te3 and Bi2S3 concentrations on the power factor of 302
RCF-Bi2Te3 and RCF-Bi2S3 composites.
303 304
The thermoelectric properties of RCF-Bi2S3 can be further enhanced in future works through 305
increase in the electronic density of states (DOS) and band engineering by doping (Yu et al., 306
2011;Du et al., 2014), nanostructuring (Liufu et al., 2007) and introducing sulphur vacancies 307
(Zhao et al., 2008). Though in this study RCF-Bi2S3 composites exhibited lower 308
thermoelectric performance than that of RCF-Bi2Te3, but with future modifications through 309
band engineering, RCF-Bi2S3 composites can be a plausible non-toxic alternative to telluride 310
based thermoelectric materials.
311
The current limitation of the thermoelectric composites produced in this study is its rigidity 312
and lack of flexibility. To enable the usability of these composites on waste heat areas with 313
different surface geometry, flexibility is a vital parameter. Flexibility as well as the electrical 314
conductivity of these composites can be improved by employing electrically conductive 315
M AN US CR IP T
AC CE PT ED
polymers such as polyaniline (PANI), poly (3,4-ethylenedioxythiophene)- 316
poly(styrenesulfonate) (PEDOT: PSS) and polythiopene for future works.
317
The potential application of the recycled carbon fibre thermoelectric composites fabricated in 318
this study is in the field of energy harvesting from waste heat with a minimum hot side 319
temperature of 40 °C such as that from electronic devices, glass windows in air-conditioned 320
buildings and cars and any other mild waste heat generating surface.
321
3.2. FESEM and EDX study of RCF-Bi2Te3 and RCF-Bi2S3 composites 322
The FESEM images were used to study the morphology of the composites. In the cross- 323
sectional view, the RCF strands are seen to be buried in the Bi2Te3–binder coating (see 324
Figure S.2 in Supplementary data). All three components in the RCF-Bi2Te3 composite, 325
which are RCF, polymeric binder and Bi2Te3 powder can be clearly observed in Figure S.3 326
(see Supplementary data). The RCF strands are predominantly carbon, C and have 2 atomic 327
percent (at%) of oxygen, O coming from some residual epoxy from previous applications and 328
also due to some binder attaching itself on the surface of RCF as depicted in Figure S.3 (a) 329
(see Supplementary data). The polymeric binder used in this study was Acrodur 3530 S, a 330
dispersion of a modified polycarboxylic acid and a polyol (cross-linking agent) thus resulting 331
in elements such as C and O in its EDX as shown in Figure S.3 (b) (see Supplementary data).
332
The EDX analysis of Bi2Te3 powder indicated 58.52 at.% of Te and 41.48 at.% of Bi as 333
displayed in Figure S.3 (c) (see Supplementary data).
334
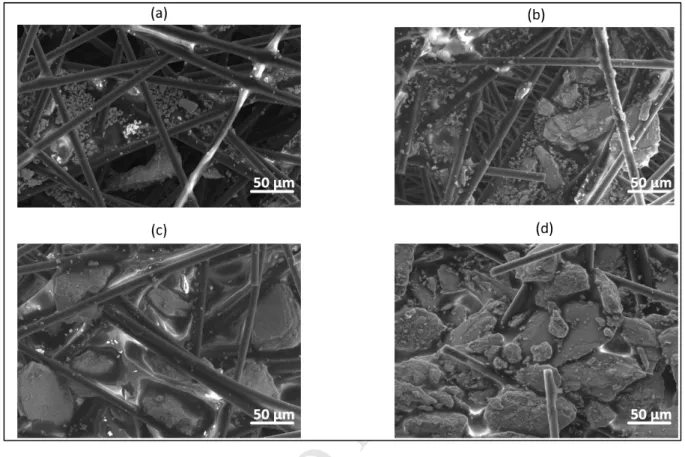
Figure 5 shows the effect of increasing Bi2Te3 concentration within the RCF-Bi2Te3
335
composite. At lower loadings of Bi2Te3 in the composite (15 wt% and 30 wt%), it can be seen 336
that there is not sufficient amount of Bi2Te3 particles filling up the gaps between the RCF 337
strands and having low coverage, thus leading to lower power factors. However, from 45 338
wt% onwards there seems to be sufficient Bi2Te3, and/no visible gaps were observed in the 339
M AN US CR IP T
AC CE PT ED
FESEM image which led to saturation at 60 wt%. Thus, the values of power factors plateaued 340
with no further increase.
341
342
Figure 5: FESEM surface images of RCF-Bi2Te3 composite at (a) 15 wt% (b) 30 wt% (c) 45 343
wt% (d) 60 wt% of Bi2Te3. 344
345
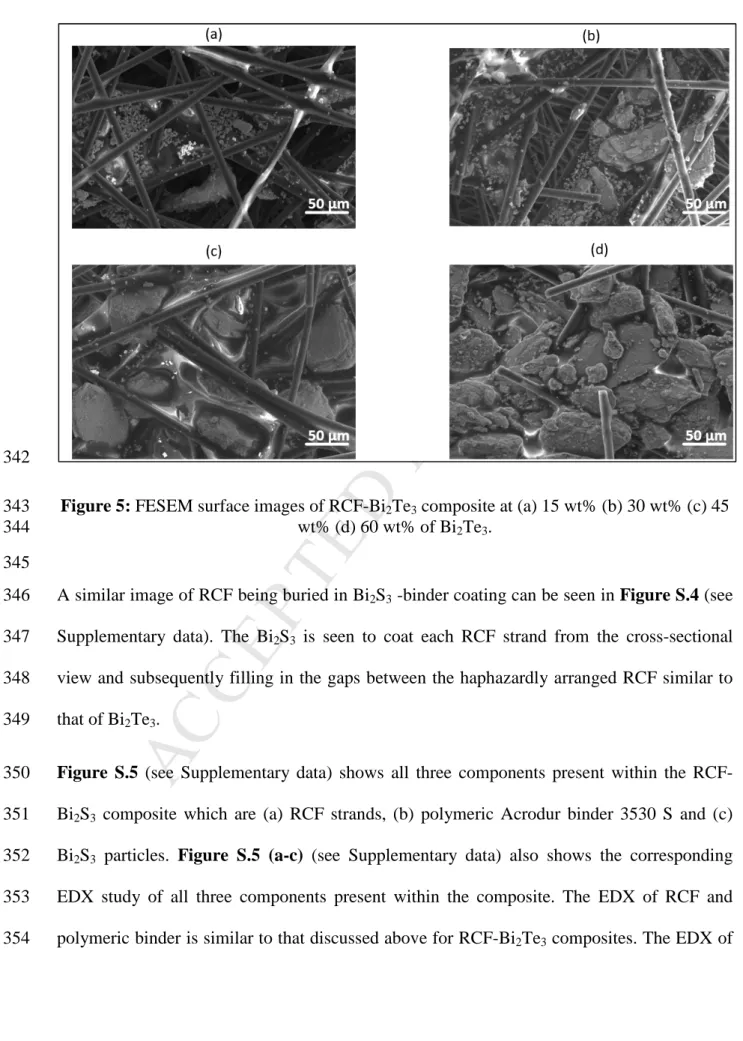
A similar image of RCF being buried in Bi2S3 -binder coating can be seen in Figure S.4 (see 346
Supplementary data). The Bi2S3 is seen to coat each RCF strand from the cross-sectional 347
view and subsequently filling in the gaps between the haphazardly arranged RCF similar to 348
that of Bi2Te3. 349
Figure S.5 (see Supplementary data) shows all three components present within the RCF- 350
Bi2S3 composite which are (a) RCF strands, (b) polymeric Acrodur binder 3530 S and (c) 351
Bi2S3 particles. Figure S.5 (a-c) (see Supplementary data) also shows the corresponding 352
EDX study of all three components present within the composite. The EDX of RCF and 353
polymeric binder is similar to that discussed above for RCF-Bi2Te3 composites. The EDX of 354
M AN US CR IP T
AC CE PT ED
Bi2S3 particles as shown in Figure S.5(c) (see Supplementary data), indicates 61.05 at.% of S 355
and 38.95 at.% of Bi which is deviating from its stoichiometric composition of 60 at.% of S 356
and 40 at.% of Bi. The enrichment in sulphur in the stoichiometry of the as-received powders 357
may have resulted in higher electrical resistivity of the RCF-Bi2S3 composites.
358
Referring to Figure 6, it can be seen that the gap between RCF strands have been filled with 359
Bi2S3 particles from 30 wt% onwards which corresponds to increasing power factor values as 360
shown in Figure 4. At 60 wt% (see Figure 6(d)), it can be seen that the RCF strands are not 361
completely embedded in the polymer-Bi2S3 coating when compared to Figure 6(a-c). There 362
is a separation of polymeric binder phase from the Bi2S3 particles perhaps owing to the high 363
loading of Bi2S3 particles, thus also leading to a drop in power factor as shown in Figure 4.
364
With optimum loading of Bi2Te3 and Bi2S3, the thermoelectric fillers acts as a bridge to fill in 365
the gaps between the RCF strands. Thus, allowing for better transport of electrons across the 366
composite which is proven by the improved carrier mobility as shown in Table 1.
367
Thus, it can be concluded based on surface morphology and thermoelectric properties, 45 368
wt% is the highest optimum filler concentration for both RCF-Bi2Te3 and RCF-Bi2S3
369
composite.
370 371
M AN US CR IP T
AC CE PT ED
372
Figure 6: FESEM surface images of RCF-Bi2S3 composite at (a) 15 wt% (b) 30 wt% (c) 45 373
wt% (d) 60 wt% of Bi2S3. 374
375
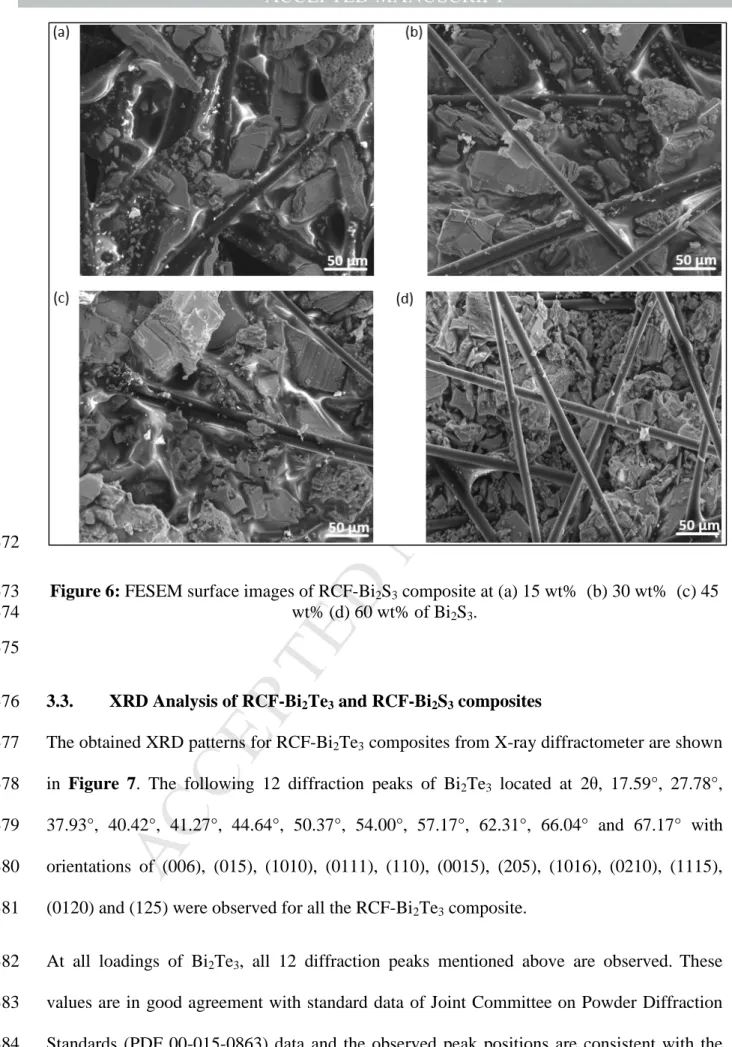
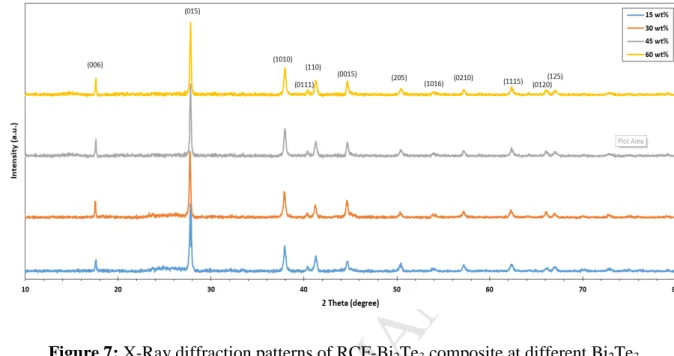
3.3. XRD Analysis of RCF-Bi2Te3 and RCF-Bi2S3 composites 376
The obtained XRD patterns for RCF-Bi2Te3 composites from X-ray diffractometer are shown 377
in Figure 7. The following 12 diffraction peaks of Bi2Te3 located at 2θ, 17.59°, 27.78°, 378
37.93°, 40.42°, 41.27°, 44.64°, 50.37°, 54.00°, 57.17°, 62.31°, 66.04° and 67.17° with 379
orientations of (006), (015), (1010), (0111), (110), (0015), (205), (1016), (0210), (1115), 380
(0120) and (125) were observed for all the RCF-Bi2Te3 composite.
381
At all loadings of Bi2Te3, all 12 diffraction peaks mentioned above are observed. These 382
values are in good agreement with standard data of Joint Committee on Powder Diffraction 383
Standards (PDF 00-015-0863) data and the observed peak positions are consistent with the 384
M AN US CR IP T
AC CE PT ED
rhombohedral structure of Bi2Te3 and observed peak positions are represented by their 385
corresponding Miller indices in the spectra. The most prominent peak is (015) was used to 386
calculate all XRD related parameters for RCF-Bi2Te3 composites.
387
388
Figure 7: X-Ray diffraction patterns of RCF-Bi2Te3 composite at different Bi2Te3 389
concentrations.
390 391
For the RCF-Bi2S3 composite, the XRD spectra are as shown in Figure 8. The following 24 392
diffraction peaks of Bi2S3 located at 2θ, 15.75°, 17.62°, 22.43°,24.99°, 25.23°, 27.49°, 393
28.65°, 31.84°, 33.04°, 33.96°, 35.65°, 36.68°, 39.09°, 39.95°, 45.60°, 46.51°, 47.05°, 48.48°, 394
49.21°, 52.63°, 53.86°, 54.77°, 62.68° and 64.57° with orientations of (200), (201), 395
(202),(301),(103), (210), (112), (212), (013), (303), (402), (312), (410), (411), (020), (314), 396
(511), (600), (512), (321), (610), (611), (711) and (712) were observed for all RCF-Bi2S3 397
composite.
398
At all loadings of Bi2S3, all 24 diffraction peaks mentioned above are observed.These values 399
are in good agreement with standard data of Joint Committee on Powder Diffraction 400
Standards (PDF 01-074-9437) data and the observed peak positions are consistent with the 401
orthorhombic structure of Bi2S3 and observed peak positions are represented by their 402
M AN US CR IP T
AC CE PT ED
corresponding Miller indices in the spectra. The most prominent peak is (301) was used to 403
calculate all XRD related parameters for RCF-Bi2S3 composites.
404
405
Figure 8: X-Ray diffraction patterns of RCF-Bi2S3 composite at different Bi2S3
406
concentrations.
407 408
With the increasing amount of Bi2Te3 and Bi2S3, there is a slight increase in crystallite size 409
from 15 wt% to 30 wt% as shown in Table 2 and Table 3 respectively. However, from 30 410
wt% to 60 wt% the crystallite size is kept constant around 46-47 nm for RCF-Bi2Te3
411
composite and the crystallite size is kept constant around 52-53 nm from 30 wt% to 45 wt%
412
for RCF-Bi2S3 composite as shown in Table 2 and Table 3 respectively. This is probably 413
because at 15 wt% there is not much thermoelectric particles, thus the x-rays may have 414
passed through the gaps between the RCF strands hence recording a smaller crystallite size.
415
However, from 30 wt% there is an increased packing of Bi2Te3 and Bi2S3 particles in the 416
thermoelectric composite thus resulting in a slightly larger crystallite size.
417
M AN US CR IP T
AC CE PT ED
In addition to the crystallite size, there is also a small decrease in the FWHM indicating 418
improved crystallinity with the increasing incorporation of Bi2Te3 and Bi2S3 particles as 419
shown in Table 2 and Table 3 respectively.
420
A lower microstrain and dislocation density is commonly preferred in order to lower 421
electrical resistivity values (Grasso et al., 2013; Jariwala et al., 2015). With increasing Bi2Te3
422
and Bi2S3 concentration, the microstrain and dislocation density is seen to have decreased 423
from 15 wt% to 45 wt% for RCF-Bi2Te3 composite and from 15 wt% to 30 wt% for RCF- 424
Bi2S3 composite as shown in Table 2 and Table 3 respectively. The decreased microstrain 425
and dislocation density is because Bi2Te3 and Bi2S3 particles filled in the gaps between RCF 426
strands, which also led to a decrease in electrical resistivity as shown in Figure 2. Beyond 45 427
wt%, the increased packing of Bi2Te3 particles results in the propagation of small micro 428
cracks on the surface of the RCF-Bi2Te3 composite that may have resulted in increased 429
dislocation density and microstrain with a corresponding increase in electrical resistivity at 60 430
wt%.
431
On the other hand, for RCF-Bi2S3 composite, an increased dislocation density and microstrain 432
was observed at 45 wt%, which also reflected on the increased electrical resistivity as shown 433
in Figure 2. There is still a continuity between the RCF strands and polymer-Bi2S3 coating as 434
shown in Figure 6 (c) thus still improving the power factors of the composite at 45 wt%.
435
However, at 60 wt% there was a significant increase in microstrain and dislocation density 436
even higher than 15 wt%, due to the discontinuity that occurred owing to the separation of the 437
polymeric phase from the Bi2S3 particles as shown in Figure 6 (d). Thus leading to a 438
significant increase in electrical resistivity and drop in power factor at 60 wt%.
439 440
M AN US CR IP T
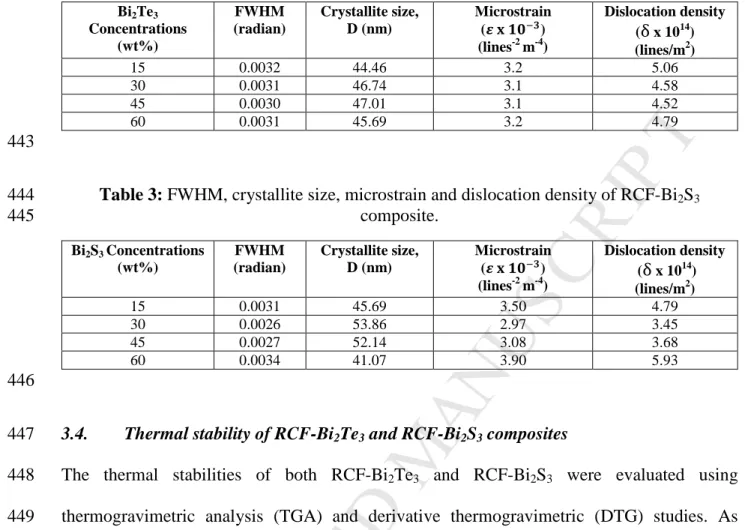
AC CE PT ED
Table 2: FWHM, crystallite size, microstrain and dislocation density of RCF-Bi2Te3
441
composite.
442
Bi2Te3 Concentrations
(wt%)
FWHM (radian)
Crystallite size, D (nm)
Microstrain (M N OPQR) (lines-2 m-4)
Dislocation density (δ x 1014)
(lines/m2)
15 0.0032 44.46 3.2 5.06
30 0.0031 46.74 3.1 4.58
45 0.0030 47.01 3.1 4.52
60 0.0031 45.69 3.2 4.79
443
Table 3: FWHM, crystallite size, microstrain and dislocation density of RCF-Bi2S3
444
composite.
445
Bi2S3 Concentrations (wt%)
FWHM (radian)
Crystallite size, D (nm)
Microstrain (M N OPQR) (lines-2 m-4)
Dislocation density (δ x 1014)
(lines/m2)
15 0.0031 45.69 3.50 4.79
30 0.0026 53.86 2.97 3.45
45 0.0027 52.14 3.08 3.68
60 0.0034 41.07 3.90 5.93
446
3.4. Thermal stability of RCF-Bi2Te3 and RCF-Bi2S3 composites 447
The thermal stabilities of both RCF-Bi2Te3 and RCF-Bi2S3 were evaluated using 448
thermogravimetric analysis (TGA) and derivative thermogravimetric (DTG) studies. As 449
thermoelectric composites are subjected to temperature differences, it is vital to determine the 450
temperature range in which it is thermally stable.
451
The thermal stability of each constituent within the RCF-Bi2Te3 and RCF-Bi2S3 composite 452
such as RCF, Bi2Te3, Bi2S3 and binder in the air are shown in Figure S.6 (see Supplementary 453
data). The polymeric binder experienced major degradation after 180 °C owing to the 454
decomposition of some polyester components such as CO, CO2, CH4, ethylene and acetylene 455
(Khalfallah et al., 2014). The RCF started to decompose from 260 °C, owing to residual 456
epoxy that may still be present on its strands from previous applications. Bi2Te3 particles 457
exhibited a thermally stable behaviour until 400 °C, beyond 400 °C the particles experienced 458
oxidation that results in a sharp weight gain as shown in Figure S.6 (see Supplementary 459
M AN US CR IP T
AC CE PT ED
data). This weight gain was also observed by Brostow et al., that attributed it to the escape of 460
tellurium due to its low vapour pressure and subsequent oxidation of bismuth at 400 °C 461
(Brostow et al., 2012). On the other hand, Bi2S3 particles exhibited a thermally stable 462
behaviour in air as depicted in Figure S.6 (see Supplementary data) until 530 °C, beyond that 463
it experienced a slight oxidation (540 °C) (due to the oxidation of its main constituents such 464
as Bi and Bi2S3 in the presence of oxygen in air (Rincbn, 1996), a subsequent mass 465
degradation (from 600 °C to 800 °C) and oxidized (beyond 800 °C).
466
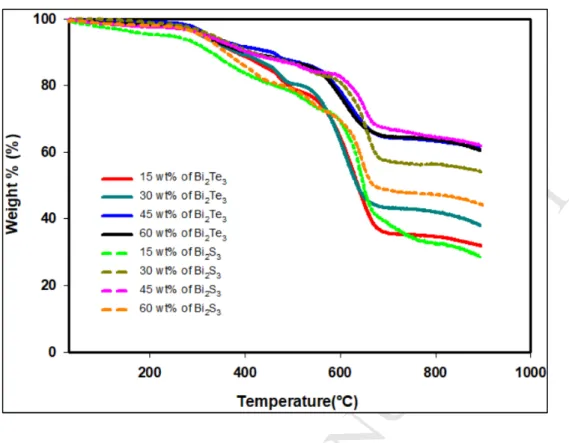
Based on Figure 9, increasing amounts of Bi2Te3 and Bi2S3 had no significant change on the 467
Tonset. For RCF-Bi2Te3 composites, Tonset varied slightly from 308.46 °C (at lower loadings of 468
Bi2Te3) to 316.2 °C (at higher loadings of Bi2Te3). A similar pattern in the TGA analysis was 469
also observed for RCF-Bi2S3 composites until 45 wt% as shown in Figure 9. The Tonset varied 470
from 306.13 °C to 316.82 °C, at 60 wt% there is a slight drop in Tonset to 308.86 °C. At 60 471
wt%, due to high filler loading resulting in the separation of the polymer from the 472
thermoelectric fillers, may have resulted in lower thermal stabilities. All RCF-Bi2Te3 and 473
RCF-Bi2S3 composites started degrading at around 294 °C as shown in Figure 9. The 474
residual char was also seen to increase with increasing concentration of Bi2Te3 and Bi2S3
475
within the thermoelectric composite.
476
M AN US CR IP T
AC CE PT ED
477
Figure 9: TGA analysis of RCF-Bi2Te3 and RCF-Bi2S3 composites.
478
Figure S.7 (see Supplementary data) shows the DTG curve of all the constituents in the RCF- 479
Bi2Te3 and RCF-Bi2S3 composites. It can be seen that both RCF and binder started degrading 480
at lower temperatures around 250 °C due to the lower thermal stability of polymeric 481
compounds. On the other hand, both the thermoelectric fillers only exhibited degradation 482
after 400 °C and 480 °C for Bi2Te3 and Bi2S3 respectively. The mass loss rate of the RCF and 483
binder is higher than that of the thermoelectric fillers.
484
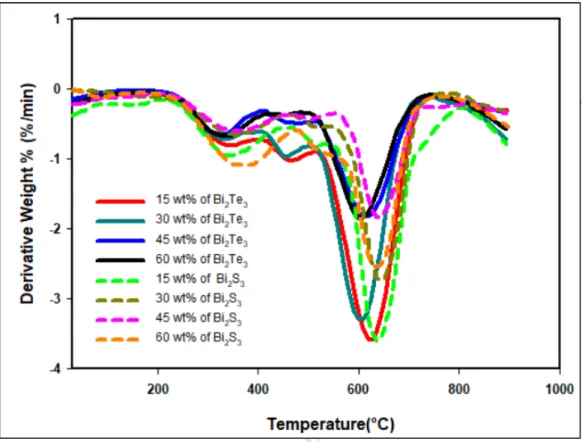
Tmax is approximately 600 °C and 630 °C for all RCF-Bi2Te3 composites and RCF-Bi2S3 485
composites as shown in Figure 10. There was insignificant improvement in Tmax with respect 486
to increasing concentration of Bi2Te3 and Bi2S3. However, the mass loss rate of composites 487
was reduced with increasing amount of Bi2Te3 and Bi2S3 and reached the least mass loss at 45 488
wt% thermoelectric filler loading. At concentrations higher than 45 wt%, there was no 489
improvement in terms of mass loss rate for RCF-Bi2Te3 composites but however for RCF- 490
Bi2S3 composites at 60 wt%, the mass loss rate was accelerated showing that it becomes less 491
M AN US CR IP T
AC CE PT ED
thermally unstable than 45 wt%, which is also reflected on its decreased power factor as 492
shown in Figure 4.
493
494
Figure 10: DTG curves of RCF-Bi2Te3 and RCF-Bi2S3 composites.
495 496
4. Conclusion 497
The power factor of RCF composite improved by 34 and 17 times upon the incorporation of 498
thermoelectric fillers (Bi2Te3 and Bi2S3) respectively. The power factor of RCF composites 499
increased with respect to increasing concentrations of Bi2Te3 and Bi2S3, however, it reached a 500
maximum of 0.194 ± 9.70×10⁻³ µWK-2m-1 and 0.0941 ± 4.71×10⁻³ µWK-2m-1 for RCF-Bi2Te3 501
and RCF-Bi2S3 at 45 wt% respectively. The thermoelectric properties of both RCF-Bi2Te3
502
and RCF-Bi2S3 were remarkably higher than that of bare RCF as proved by the Seebeck 503
coefficient, electrical resistivity, carrier property measurement, FESEM, EDX, XRD and 504
TGA analysis. This is because the presence of the thermoelectric fillers not only suppressed 505
M AN US CR IP T
AC CE PT ED
the carrier concentration but also improved the carrier mobility between the gaps of RCF 506
strands, thus enhancing its thermoelectric capabilities.
507
The environmentally friendly Bi2S3 filler is seen to show promising thermoelectric properties, 508
although it is one order lower than that of Bi2Te3 due to its innate material property that has 509
high electrical resistivity. The thermoelectric composites are proven to be a cost effective and 510
feasible alternative to producing efficient thermoelectric materials, which is economically 511
efficient as well as industrially scalable with minimal infrastructure requirement. The 512
proposed RCF composites in this study could be used for the recovery of low grade waste 513
heat such as that from laptops and mobile devices to power low consumption electronic 514
devices.
515 516
5. References 517
Brostow, W., Datashvili, T., Hagg Lobland, H.E., Hilbig, T., Su, L., Vinado, C., White, J., 518
2012. Bismuth telluride-based thermoelectric materials: Coatings as protection against 519
thermal cycling effects. J. Mater. Res. 27, 2930–2936.
520
https://doi.org/10.1557/jmr.2012.335 521
Cholake, S.T., Moran, G., Joe, B., Bai, Y., Singh Raman, R.K., Zhao, X.L., Rizkalla, S., 522
Bandyopadhyay, S., 2016. Improved Mode I fracture resistance of CFRP composites by 523
reinforcing epoxy matrix with recycled short milled carbon fibre. Constr. Build. Mater.
524
111, 399–407. https://doi.org/10.1016/j.conbuildmat.2016.02.039 525
Du, X., Cai, F., Wang, X., 2014. Enhanced thermoelectric performance of chloride doped 526
bismuth sulfide prepared by mechanical alloying and spark plasma sintering. J. Alloys 527
Compd. 587, 6–9. https://doi.org/10.1016/j.jallcom.2013.10.185 528
F.Keuch, T., 2015. Thin Films and Epitaxy: Basic Techniques, and Materials, Processes, and 529
Technology. Elsevier, Oxford.
530
Feng, N., Wang, X., Wu, D., 2013. Surface modification of recycled carbon fiber and its 531
reinforcement effect on nylon 6 composites: Mechanical properties, morphology 532
and crystallization behaviors. Curr. Appl. Phys. 13, 2038–2050.
533
https://doi.org/10.1016/j.cap.2013.09.009 534
Fernández-Yáñez, P., Gómez, A., García-Contreras, R., Armas, O., 2018. Evaluating 535
thermoelectric modules in diesel exhaust systems: potential under urban and extra-urban 536
driving conditions. J. Clean. Prod. 182, 1070–1079.
537
https://doi.org/https://doi.org/10.1016/j.jclepro.2018.02.006 538
M AN US CR IP T
AC CE PT ED
Grasso, S., Tsujii, N., Jiang, Q., Khaliq, J., Maruyama, S., Miranda, M., Simpson, K., Mori, 539
T., Reece, M.J., 2013. Ultra low thermal conductivity of disordered layered p-type 540
bismuth telluride. J. Mater. Chem. C 1, 2362. https://doi.org/10.1039/c3tc30152d 541
Hambach, M., Möller, H., Neumann, T., Volkmer, D., 2016. Carbon fibre reinforced cement- 542
based composites as smart floor heating materials. Compos. Part B Eng. 90, 465–470.
543
https://doi.org/http://dx.doi.org/10.1016/j.compositesb.2016.01.043 544
Hasan, B.A., Shallal, I.H., 2014. Structural and Optical Properties of SnS Thin Films. J.
545
Nanotechnol. Adv. Mater. 2, 43–49. https://doi.org/10.1080/17458080.2013.788226 546
Howarth, J., Mareddy, S.S.R., Mativenga, P.T., 2014. Energy intensity and environmental 547
analysis of mechanical recycling of carbon fibre composite. J. Clean. Prod. 81, 46–50.
548
https://doi.org/https://doi.org/10.1016/j.jclepro.2014.06.023 549
Jagadish, P.R., Khalid, M., Amin, N., Li, L.P., Chan, A., 2017. Process optimisation for n- 550
type Bi2Te3 films electrodeposited on flexible recycled carbon fibre using response 551
surface methodology. J. Mater. Sci. 52, 11467–11481. https://doi.org/10.1007/s10853- 552
017-1284-2 553
Jagadish, P.R., Li, L.P., Chan, A., Khalid, M., 2016. Effect of Annealing on Virgin and 554
Recycled Carbon Fiber Electrochemically Deposited with N-type Bismuth Telluride and 555
Bismuth Sulfide. Mater. Manuf. Process. 31, 1223–1231.
556
https://doi.org/10.1080/10426914.2015.1090590 557
Jariwala, B., Shah, D., Ravindra, N.M., 2015. Influence of doping on structural and optical 558
properties of Bi 2 Te 3 thin films. Thin Solid Films 589, 396–402.
559
https://doi.org/10.1016/j.tsf.2015.05.020 560
Khalfallah, M., Abbès, B., Abbès, F., Guo, Y.Q., Marcel, V., Duval, A., Vanfleteren, F., 561
Rousseau, F., 2014. Innovative flax tapes reinforced Acrodur biocomposites: A new 562
alternative for automotive applications. Mater. Des. 64, 116–126.
563
https://doi.org/10.1016/j.matdes.2014.07.029 564
Kim, M.Y., Oh, T.S., 2009. Electrodeposition and thermoelectric characteristics of Bi 2Te 3 565
and Sb 2Te 3 films for thermopile sensor applications. J. Electron. Mater. 38, 1176–
566
1181. https://doi.org/10.1007/s11664-008-0653-7 567
Kioupakis, E., Tiago, M.L., Louie, S.G., 2010. Quasiparticle electronic structure of bismuth 568
telluride in the GW approximation. Phys. Rev. B - Condens. Matter Mater. Phys. 82, 1–
569
4. https://doi.org/10.1103/PhysRevB.82.245203 570
Kishita, Y., Ohishi, Y., Uwasu, M., Kuroda, M., Takeda, H., Hara, K., 2016. Evaluating the 571
life cycle CO2 emissions and costs of thermoelectric generators for passenger 572
automobiles: a scenario analysis. J. Clean. Prod. 126, 607–619.
573
https://doi.org/https://doi.org/10.1016/j.jclepro.2016.02.121 574
Kusagaya, K., Takashiri, M., 2015. Investigation of the effects of compressive and tensile 575
strain on n-type bismuth telluride and p-type antimony telluride nanocrystalline thin 576
films for use in flexible thermoelectric generators. J. Alloys Compd. 653, 480–485.
577
https://doi.org/10.1016/j.jallcom.2015.09.039 578
Li, D., Sun, R.R., Qin, X.Y., 2011. Improving thermoelectric properties of p-type Bi2Te3- 579
based alloys by spark plasma sintering. Prog. Nat. Sci. Mater. Int. 21, 336–340.
580
https://doi.org/10.1016/S1002-0071(12)60066-5 581